


Observability
Nowadays, microservice architecture is a pattern that helps to innovate quicker by enabling easier scalability, giving language flexibility, improving fault isolation, etc. Systems built this way also bring some downsides. Moving parts, concurrent invocations, and different retries policies can make operating and troubleshooting such systems challenging. Without proper tools, correlating logs with metrics may be difficult. To overcome these challenges, you need observability.
There are three types of telemetry data through which systems are made observable:
- Logs – lines of text that are emitted by an application.
- Metrics – some data about a system in a given time.
- Traces – activities in request as if they flow through an application.
Distributed tracing
We will take a closer look at one of these telemetry data – traces, in a distributed system.
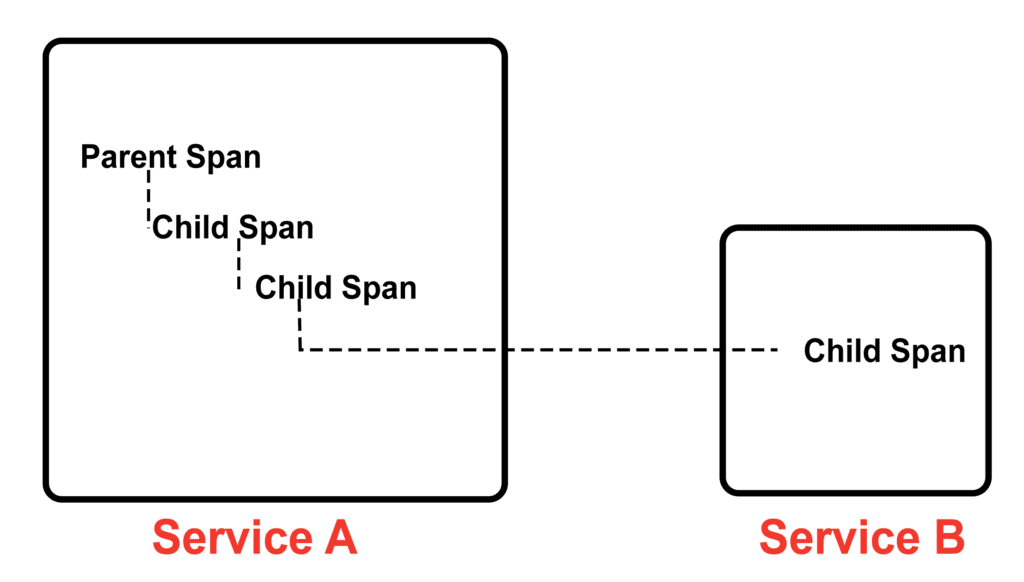
A trace exposes the entire journey of the action or request as it moves across all services in the distributed system. Trace is a collection of linked spans, which are operations representing a unit of work in the request, for example, database read.
Individual span can include:
- Name
- Start and finish timestamp
- Span context is an identifier that represents the unique request that each span is a part of, including trace ID and span ID
- Other attributes and events
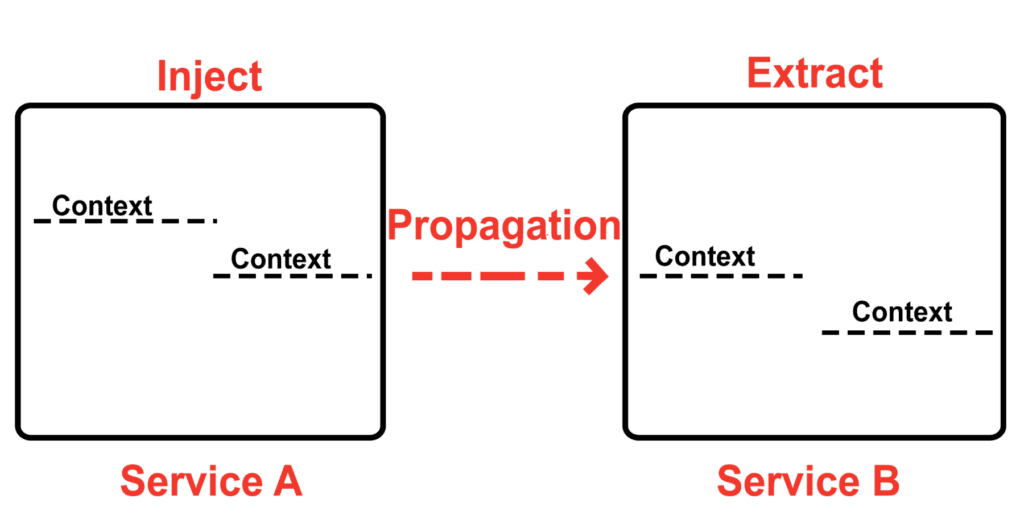
Context propagation
In a monolithic application, a context within one service might be enough. In a distributed system, we need a method to send context from service to service to follow the execution flow. This process is called context propagation.
When the request begins, a trace is created. Every call needs to include a trace ID so it could be possible to reconstruct the trace. Context is included in the calls and transferred between services, typically via HTTP headers.
There are several specifications for context propagation that can be used, for example:
OpenTelemetry
You are probably thinking – “This is great! I want it in my system!”.
But what tool or standard should you choose? First, we need to distinguish between collecting data and analyzing it.
There were/are two projects that could help:
- OpenCensus is a collection of language-specific libraries for instrumenting an application, collecting metrics, and exporting data to supported tools.
- OpenTracing is a standardized API for tracing and provides specifications developers can use to instrument their services.
In 2019 both projects merged into OpenTelemetry, which offers a set of APIs and libraries that standardize how you collect and transfer telemetry data. It is a single transmission method to your analysis system (also called backend).
Intentionally, OpenTelemetry is not an analytic tool. You can choose where to send data to be analyzed. Creators of this project presume that analytic tools are the place where the innovation should be, not the collecting methods.
OpenTelemetry has several benefits:
- Vendor agnostic – if you choose to change your backend, you don’t need to redeploy your application.
- CNCF project, with a large community.
- Cross-platform support integrates with popular libraries and frameworks such as Spring, ASP.NET Core, etc.
- Support for both automatic and manual instrumentation.
- Clean architecture with separation of concerns.
In March 2021, it was released as 1.0 version, claimed as production-ready.
Instrumentation
We discussed that you need additional data in your services for context propagation.
Instrumentation is the process of adding traces and spans code to your application.
You can do it manually by using API and SDK provided by a client library and adding required code changes. In some cases, you can also use auto-instrumentation agents that generate spans automatically so that no code change is required.
Auto-instrumentation adds instrumentation code to the libraries and frameworks that you use. How it is done depends on the language. For example, it can pass a JAR to the JVM or wrap existing Go libraries.
In most cases, I would recommend combining the two, getting benefits from each:
- No code changes with auto-instrumentation.
- Fine-grained control when traces are created or when specific libraries are not supported by auto-instrumentation.
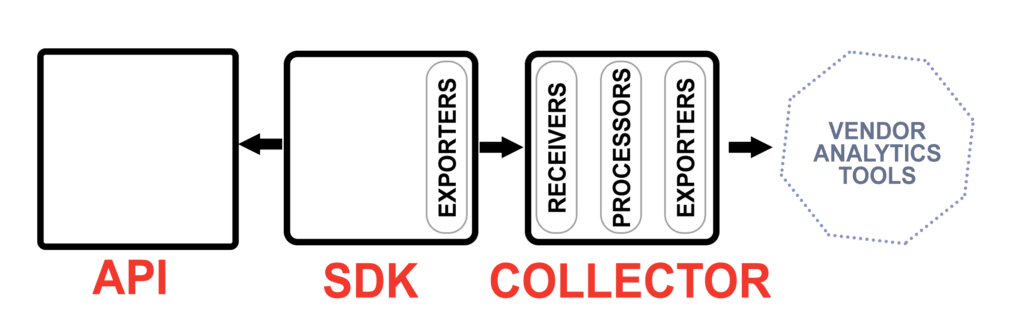
OpenTelemetry architecture
OpenTelemetry is composed of the following components:
- API – used by developers to instrument their code. Also, library authors use it to write instrumentation into their libraries.
- SDK – implements API for specific languages and provides a framework for processing the data.
- Collectors – used to receive, process, and export telemetry data to the analytics systems.
Using collectors is optional; however, it allows you to send the data to different backends without changing instrumentation or redeploying applications. The collector is the default location where the instrumentation libraries export their telemetry data. The collector is composed of receivers, processors and exporters, supporting different source and destination formats. For example, you can send traces data to Jaeger and metrics data to Prometheus.
AWS Distro for Opentelemetry
AWS provides upstream-first, AWS-supported distribution of the OpenTelemetry. It extends the project with AWS specific elements, enabling easier auto-instrumentation and providing sending methods of metrics and traces to multiple AWS and partner monitoring solutions.
Examples of AWS enhancements:
- SDK AWS resource-specific metadata.
- Support to the OpenTelemetry SDKs for the X-Ray trace format and context.
- AWS-specific exporters to the upstream collector (AWS X-Ray, Amazon CloudWatch, and Amazon Managed Service for Prometheus).
AWS also provides an easy way to integrate AWS Lambda with OpenTelemetry. The collector can run as part of the Lambda extension along with the OpenTelemetry language SDK and send data to different backends.
It is all packaged into the Lambda layer, which provides a plug-and-play user experience by automatically instrumenting a Lambda function and including language-specific SDK with an out-of-the-box configuration for AWS X-Ray. The layer is available in multiple languages and can be configured to send trace data also to different destinations that support OpenTelemetry Protocol (OTLP).
Enabling OpenTelemetry for Lambda function
You can add OpenTelemetry to your Lambda function following those few easy steps.
We will use Python 3.8 function and AWS X-Ray in this example, but you can do it with other supported languages and backend tools.
- Go to your Lambda function and click the Configuration tab. Click Edit.
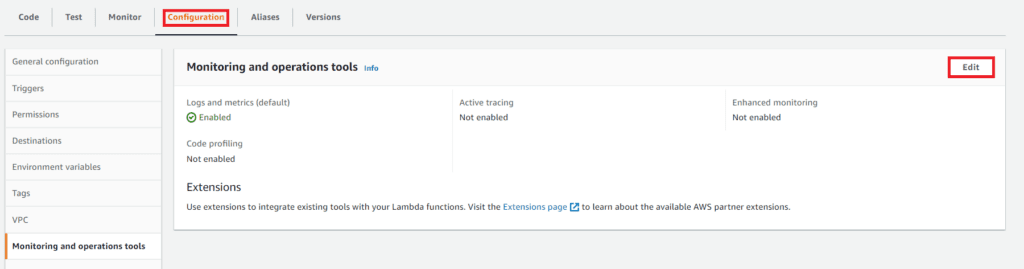
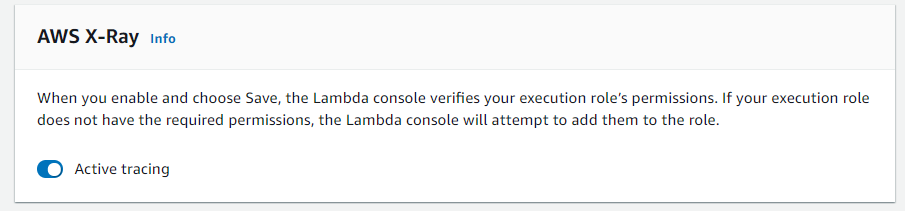
- Click Activate tracing and click Save.
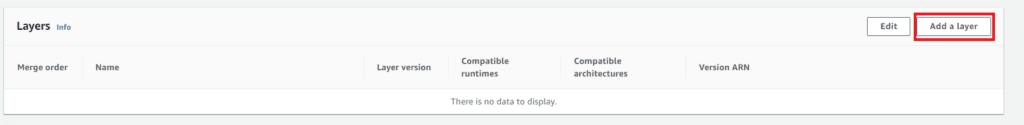
- Add AWS Distro for OpenTelemetry layer to your Lambda function. Go to your Lambda function
main page and click Add a Layer.
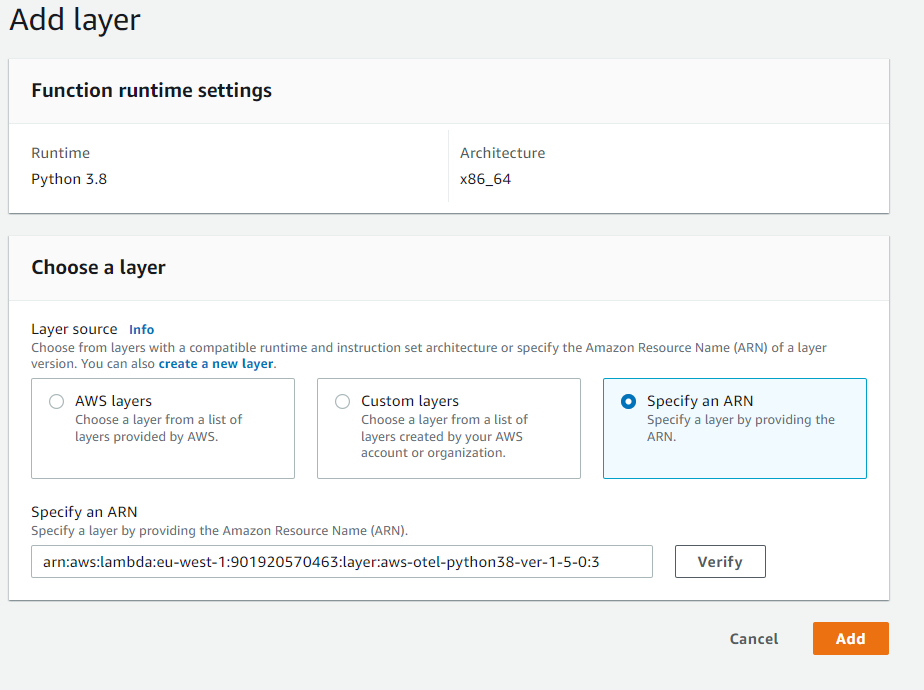
- Select Specify an ARN according to your region and language. You can find all ARNs in the documentation. For example, for Python 3.8 in Ireland region type: arn:aws:lambda:eu-west1:901920570463:layer:aws-otel-python38-ver-1-5-0:3 and click Add.
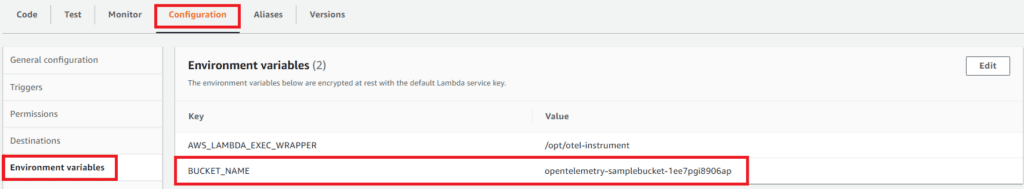
- Go to Configuration tab and click Environment variables. Add the environment variable AWS_LAMBDA_EXEC_WRAPPER and set it to /opt/otel-instrument.
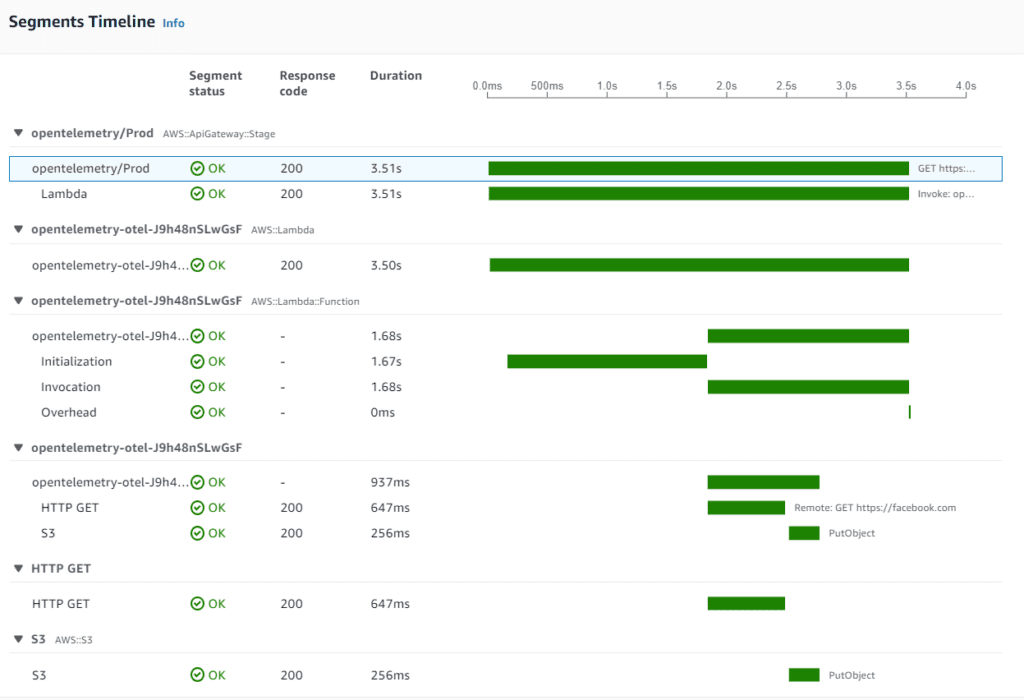
- Test your application. Go to the AWS X-Ray service and check traces. We have an application that communicates with an HTTP endpoint and saves files to the S3 bucket.
Try it yourself in a free AWS sandbox environment.