


Observability is a measure of how well we are able to infer the internal state of our application from its external outputs. It’s an important measure because it indirectly tells us how well we’d be able to troubleshoot problems that will inevitably arise in production.
It’s been one of the hottest buzzwords in the cloud space for the last 5 years and the marketplace is swamped with observability vendors. Different tools employ different methodologies for collecting data. Some require manual instructions while others offer a more automatic process.
The quality and quantity of the data they collect (e.g. logs, distributed traces) also vary greatly. Which directly impacts how much we are able to infer about the internal state of our application and what it’s doing.
In this post, let’s compare two of the most popular observability solutions for serverless applications in AWS — AWS X-Ray and Lumigo.
AWS X-Ray
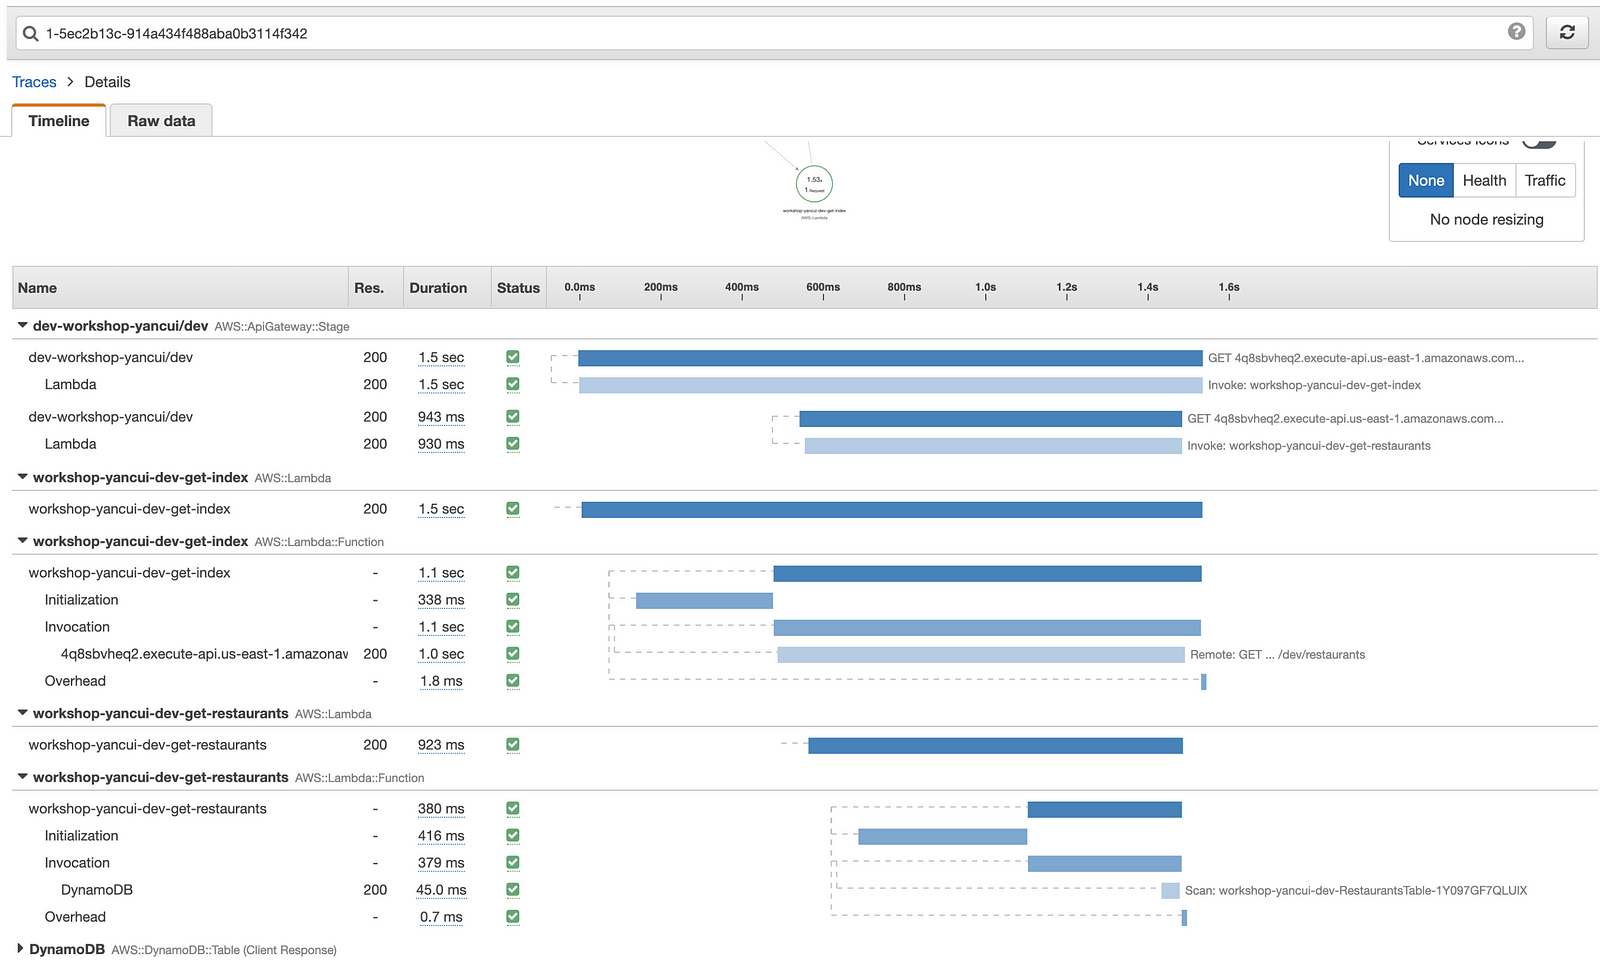
X-Ray can collect traces from your application and reveal useful insights:
- How long did a transaction take?
- What are the biggest performance bottlenecks?
- What services did a Lambda function access during its invocation?
In some instances, X-Ray is able to trace these transactions through multiple Lambda functions and/or containers.
Unlike many third-party services that aim to provide a complete observability package, and give you a single pane of glass to access all the relevant data. X-Ray is limited in scope and cannot provide all the insights you need to troubleshoot issues in your application.
How to get started
X-Ray is able to integrate with numerous AWS services in a number of ways. The most common way is for you to actively instrument your application code to generate the traces and for other supporting AWS services (such as SNS and EventBridge) to participate in the request tracing passively (by propagating the trace headers).
In order to capture requests to other AWS services, you need to instrument the AWS SDK using the X-Ray SDK.
const XRay = require('aws-xray-sdk-core')

const AWS = XRay.captureAWS(require('aws-sdk'))
If you only need one of the AWS clients, e.g. DynamoDB, then you can also instrument individual AWS clients.
const XRay = require(‘aws-xray-sdk-core’)


const DynamoDB = AWSXRay.captureAWSClient(new AWS.DynamoDB())
But what if you’re calling other HTTP endpoints such as Twillio or Stripe, or your own APIs?
To make sure these are included in the X-Ray traces, you will also need to instrument Node.js’s http module too.
const AWSXRay = require(‘aws-xray-sdk-core’)

AWSXRay.captureHTTPsGlobal(require(‘https’))
Without instrumenting your code, the X-Ray traces would be barebone and not add much value at all.
It’s also worth noting that X-Ray has a default sampling limit of 1 req/s and then a fixed rate of 5%.
Pros
- Native integration with AppSync and Step Functions. Able to trace transactions direct integration from AppSync and Step Functions to other AWS services (no Lambda).
- No latency overhead for data collection. AWS manages the collection agent in the Lambda execution environment.
- Built-in sampling keeps the cost down
Cons
- Requires a lot of manual instrumentation in application code.
- Does not capture request and response bodies in traces, nor does it capture Lambda invocation events and responses. These are often crucial in debugging biz logic errors.
- Poor support for event-driven applications. Only SNS and EventBridge are supported. If a request passes through SQS, Kinesis or DynamoDB streams then the trace is broken.
- Doesn’t support Lambda invocations through S3 events.
- The search syntax is difficult to use, and you’re limited to searching 6 hours’ worth of data at once. Combined with the conservative sampling rate, it’s almost impossible to find specific traces. Instead, one tends to “stumble upon” interesting traces by chance.
- Single region.
- Limited to tracing. You still need solutions for collecting and propagating correlation IDs in your application layer to allow you to find related Lambda/container logs.
- No integration with CloudWatch Alerts. Alerts need to be configured and managed separately.
X-Ray is very cost-effective compared to other solutions in the market. But it has many limitations, and in practice, I don’t find a lot of value in X-Ray. This is especially true for complex applications where the failure modes are also more complex.
I would summarize X-Ray as “a cost-effective solution that meets the basic needs of distributed tracing”. However, distributed tracing is not the end goal. The goal is to gain observability in your application so you can deal with any problems that arise.
In a way, you get what you pay for with X-Ray.
Lumigo
Lumigo is an observability tool that helps you troubleshoot problems in serverless and container applications. It has similarities to X-Ray in that it gives you distributed tracing but it does so much more than that.
It’s a much more complete solution and caters for all your needs when it comes to observability and troubleshooting live issues:
- Automatic instrumentation (no need to change your code).
- Automatically capture and aggregate errors by type and source.
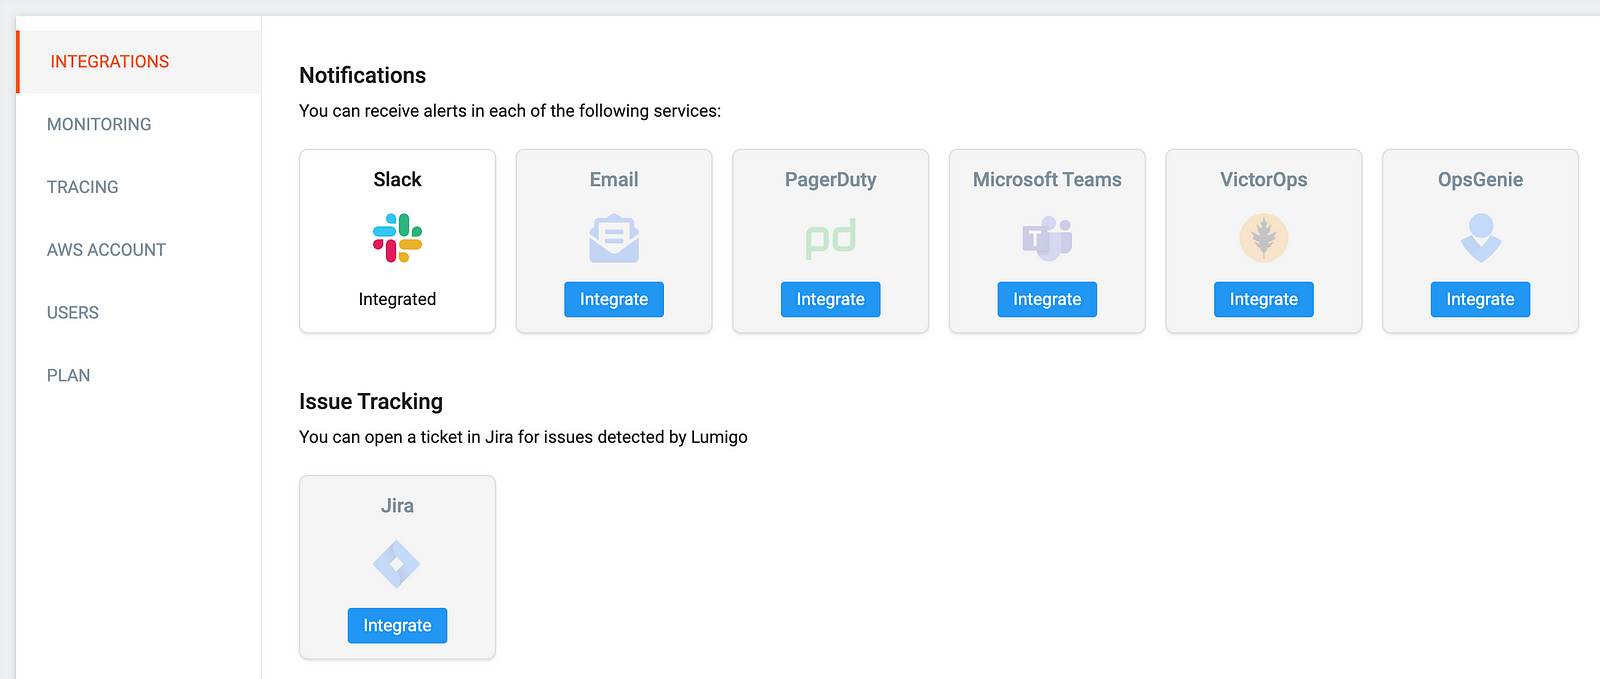
- Issues tracking through Jira.
- Built-in alerting and notification (Email, Slack, PagerDuty, MS Teams, VictorOps, and OpsGenie)
Lumigo supports both serverless and container workloads, but I will focus on serverless here because that’s what I’m most interested in.
How to get started
To get started, head over to lumigo.io and open a free account. This would guide you through the process of creating an IAM role in your account, which gives Lumigo the read access it needs.
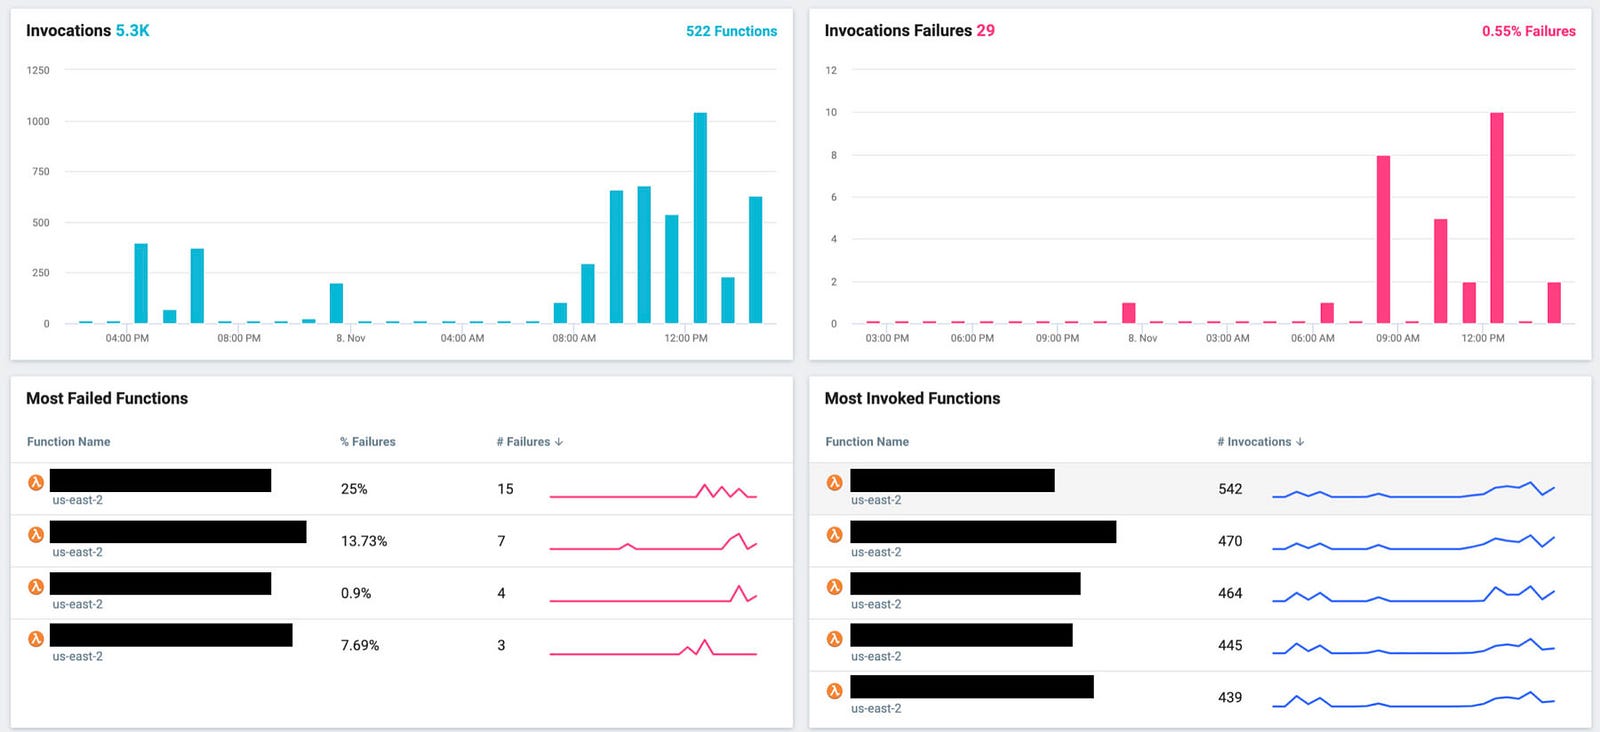
Without doing anything else, you can get some high-level insight into your Lambda functions across all the regions:
- Total invocations and error count.
- Most invoked and failed functions.
- Functions with most cold starts.
- Slowest Lambda functions.
You can also enable tracing on individual functions in the Lumigo console:
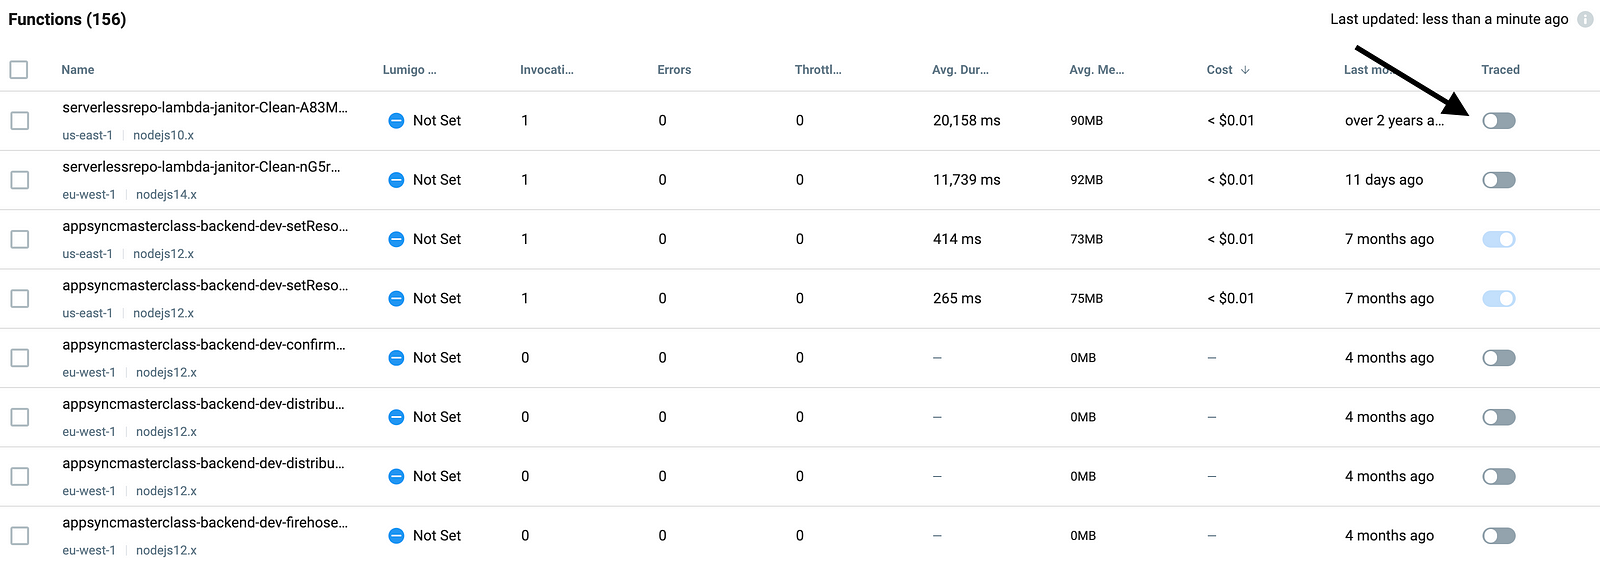
Doing so lets you trace through even complex transactions spanning across multiple Lambda functions and different event sources. And you can see all the relevant Lambda logs side-by-side so everything is in one place.
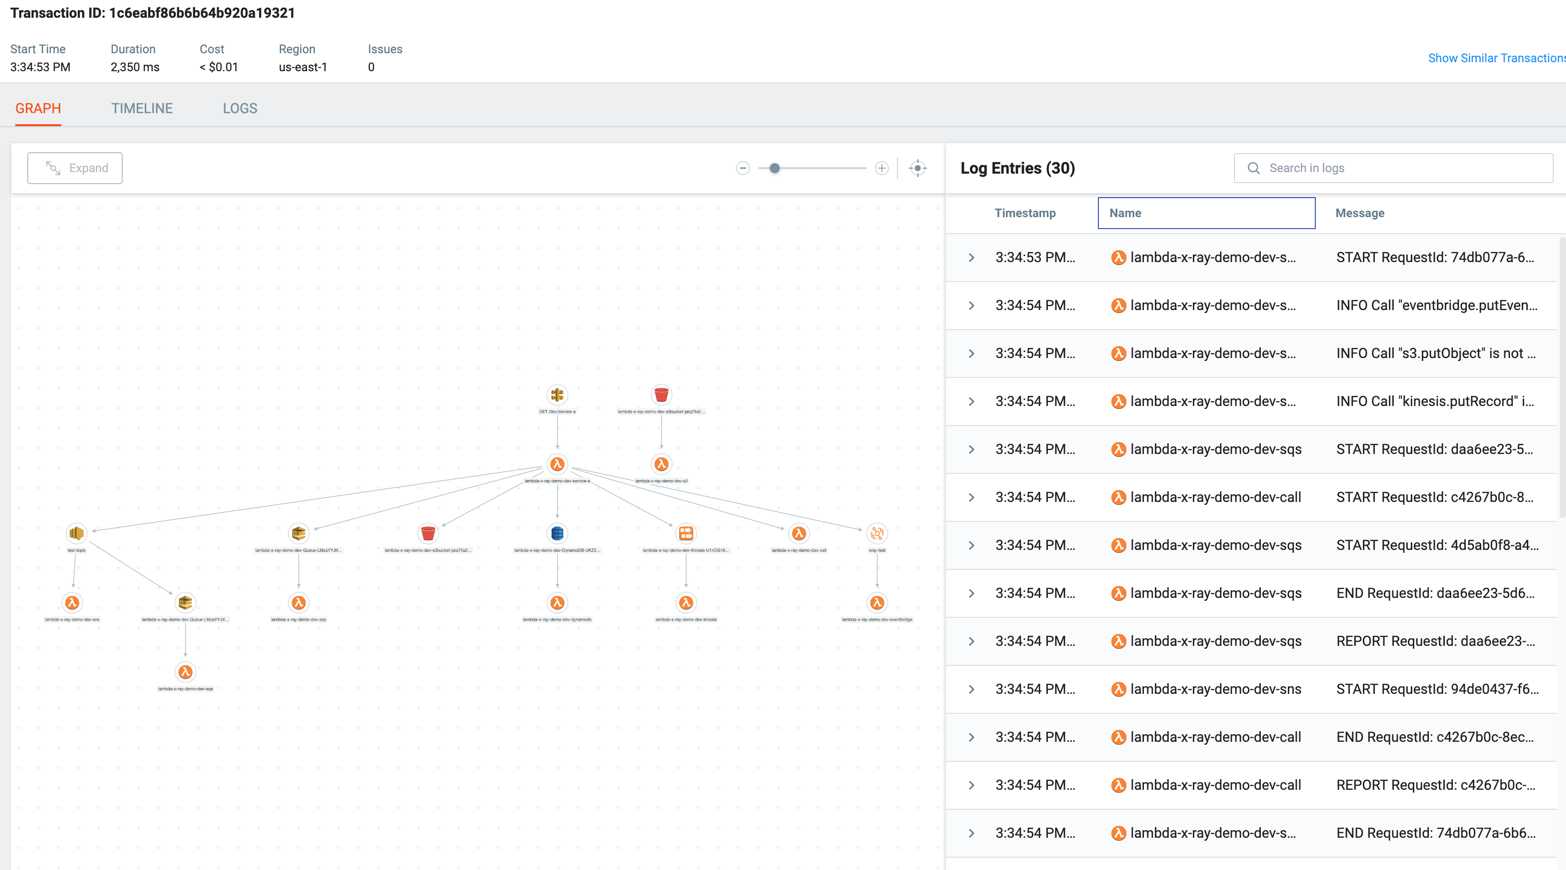
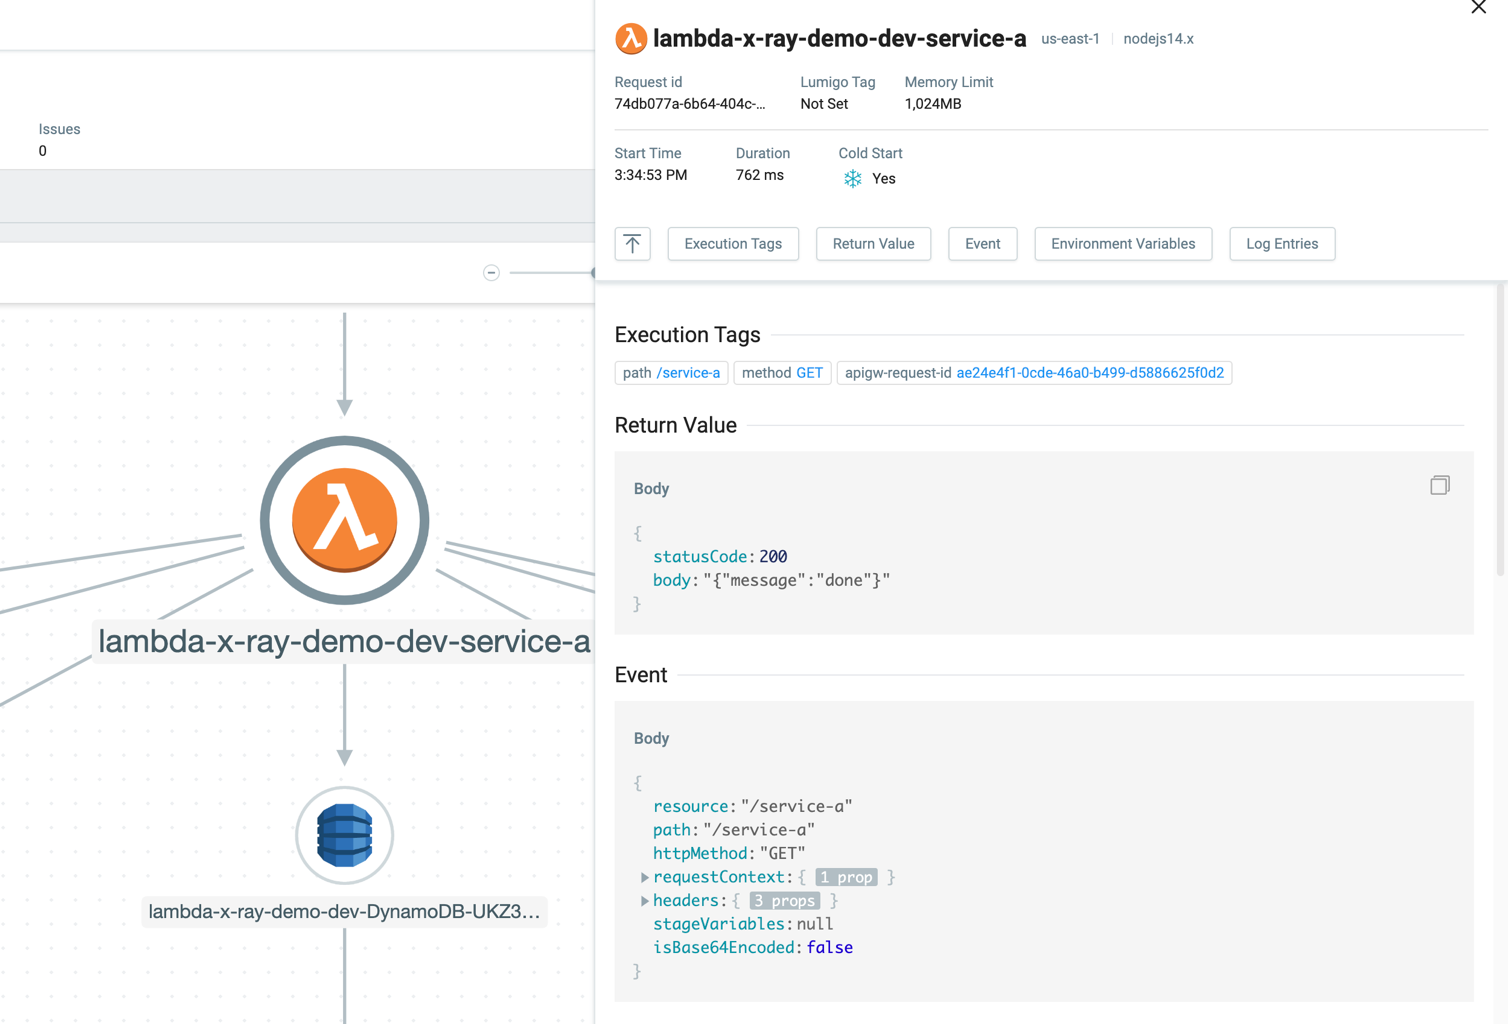
You can click on each of the icons in the transaction to learn more. For example, every traced Lambda invocation records the Lambda invocation event, return value, environment variables and logs.
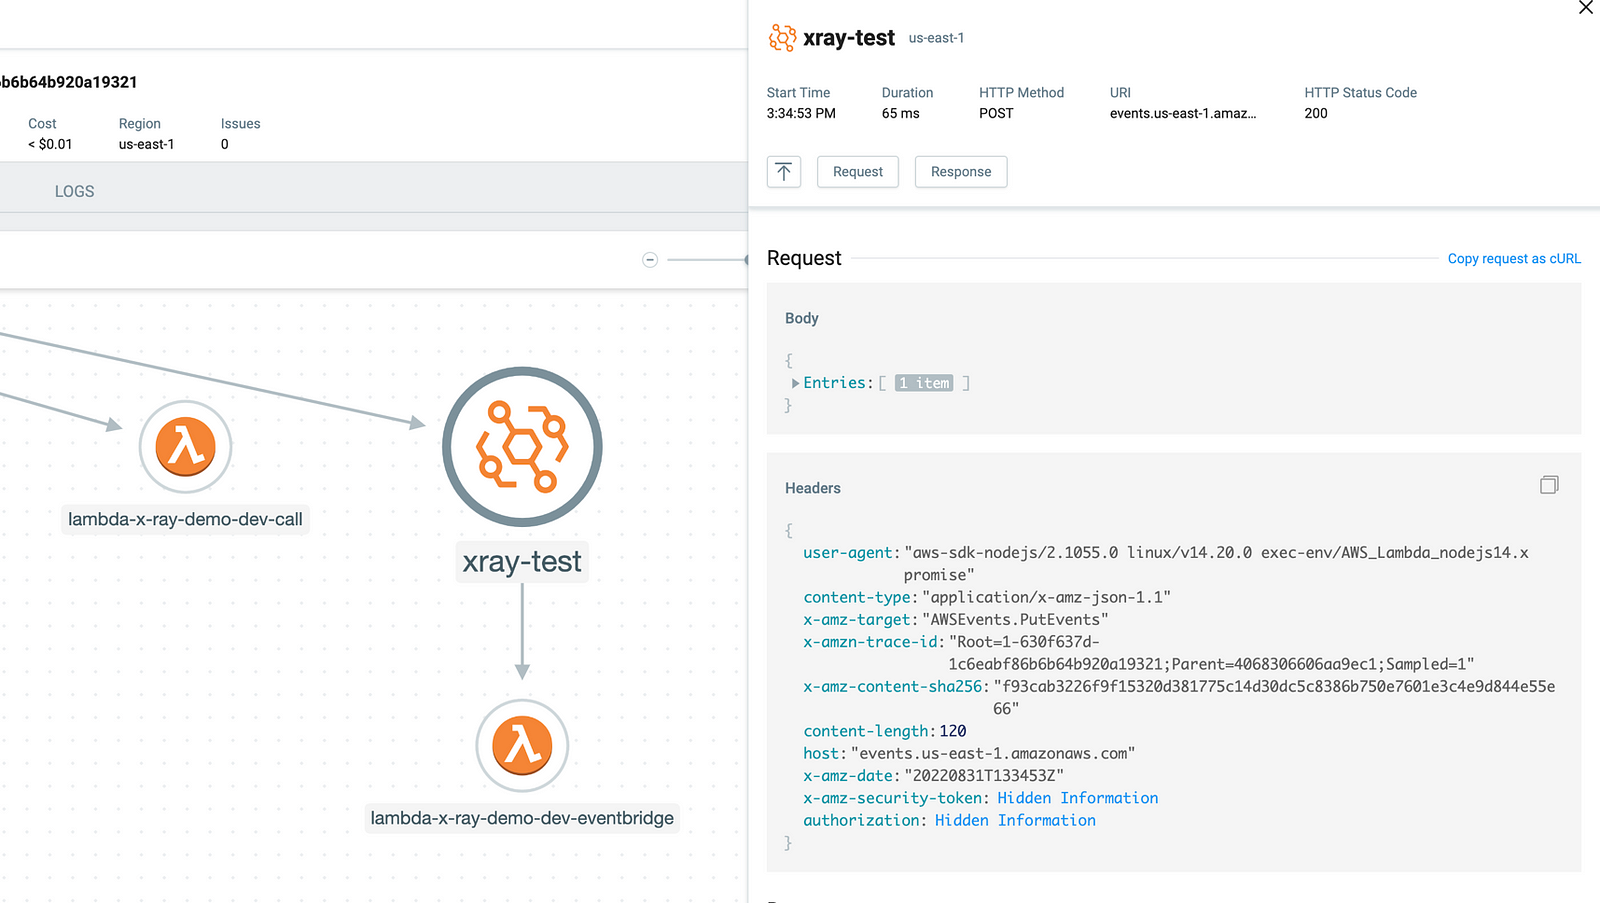
Every HTTP request (to other AWS services, or 3rd party APIs, or your own microservices) from these Lambda functions is automatically captured along with the request and response body. These give you regular checkpoints and let you infer the state of your application before and after that HTTP request was made.
And when problems inevitably occur, Lumigo would automatically capture them and group the errors by Lambda function and error type. You can see all the errors in the relevant time window at a glance and see their frequency and trend over time.
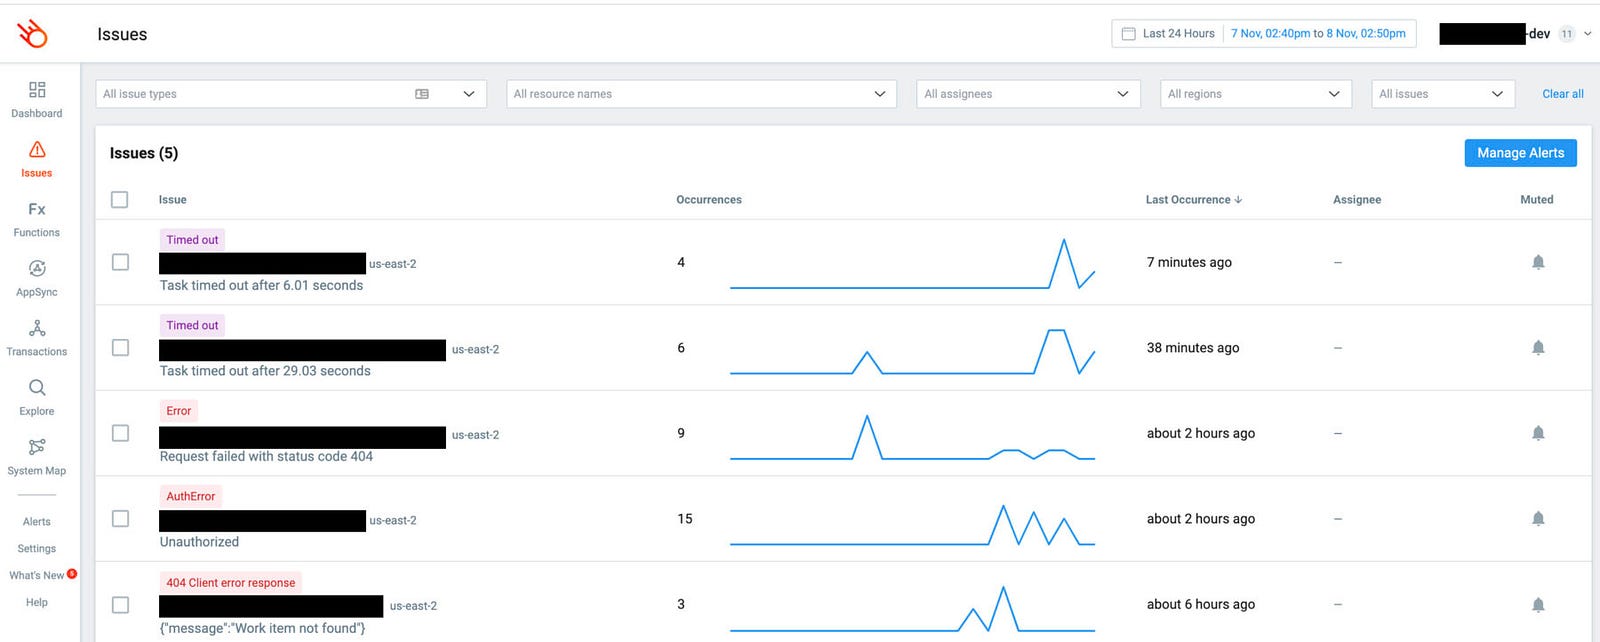
If you had configured a notification channel then you would be notified of errors and timeouts straight away.
Pros
- No manual instrumentation is required. This can easily save weeks of engineering time in large projects.
- High-level performance summaries for all your Lambda functions.
- Cost tracking for entire transactions as well as individual Lambda functions.
- Great support for event-driven applications — S3, SQS, SNS, Kinesis Streams and DynamoDB Streams.
- Works across multiple regions and AWS accounts. Although the multi-account support needs improving.
- Captures Lambda invocation event, return value, environment variables and stack trace. No more console.log(JSON.stringify(event)) as the 1st line of your Lambda functions!
- Captures request and response body in HTTP requests.
- Free-text search on any data that Lumigo collects. This makes it easy to find specific traces.
- Can search up to 30 days’ worth of data.
- Easy to find slow dependencies through the “Cloud Services Latency” widget in the dashboard. This quickly highlights poor performing dependencies (e.g. 3rd party services) your application has.
- Built-in Issues page, where issues are grouped by function and type.
- Built-in alerting and notification through Email, Slack, Microsoft Teams, PagerDuty, VictorOps and OpsGenie.
- Support and professional services are included in the price with a dedicated customer success manager. You can also get support through a dedicated Slack channel/phone/zoom.
Cons
- The Lumigo tracer adds ~10–20ms to every Lambda invocation. But the Lumigo team is working on a next-generation tracer that uses Lambda extension to eliminate this latency overhead.
- Can’t trace direction integrations between AppSync/Step Functions and other AWS services.
As far as serverless goes, Lumigo is the best observability tool in the market and a big part of my observability strategy as I explained in this post. It stands head and shoulder above X-Ray in terms of the value it provides.
The fact that it gives you so much observability into what’s going on in your application makes it just as valuable during development as it does in production. I can run an end-to-end test, find an error, and then quickly jump into Lumigo and look at the transaction to figure out what went wrong.
Since I started using Lumigo, I have been able to delete most of the debug log statements that I used to litter throughout my codebase. The fact that the Lambda invocation event is captured along with every HTTP request I make means I no longer have to do it myself.
Parting thoughts
Although X-Ray is very cost-effective and has some advantages as a first-party service. I have seldom found it useful outside of the context of AppSync and Step Functions because of its ability to trace through direct integrations to other AWS services. However, even in those cases, I had to rely on random encounters to stumble upon interesting traces that represent clear outliers. For example, traces that have a very long duration.
Finding traces for specific transactions or GraphQL operations is nigh on impossible in X-Ray. And in most cases, it doesn’t capture enough information about the transaction. The duration of the captured HTTP requests can help identify performance problems. But the fact that request and response bodies are not captured means you can’t infer the state of the application at the time when the HTTP request was made.
In comparison, Lumigo provides a clear value proposition and is in my opinion the best observability tool for serverless applications. It has been a game changer for my developer experience working on serverless applications and one of the most important tools in my toolbox. You can sign up for Lumigo for free here.