


As a developer, when I first stepped into the wonderful world Kubernetes, I was amazed at the endless configuration possibilities it offered for containerized apps. It felt like I was handed the most multifaceted tool for all my deployment needs. But as the saying goes, “With great power comes great responsibility” And in the context of Kubernetes, that responsibility means keeping an eye on a slew of metrics that are crucial for the performance, health, and security of your applications and clusters. Ignoring these metrics or not giving them the attention they deserve is like flying blind in a territory filled with potential obstacles.
Whether you’re a Kubernetes newbie or a seasoned veteran, understanding the metrics that Illustrate what’s happening behind the scenes is vital for a smooth-sailing cluster. In this post, we’ll dissect some of the key metrics you should be monitoring when it comes to your Kubernetes nodes.
Backoff Errors and Their Relation to Pod Crash Loops
When dealing with Kubernetes, you might come across backoff errors, which are often related to pod crash loops, but can be slightly different. Backoff errors occur when Kubernetes tries to restart a failing pod but increasingly delays each restart attempt, indicating that something is wrong with the pod. It’s a mechanism designed to give problematic pods some “cooling off” time, but it’s also a signal that demands immediate attention.
Pod crash loops are among the most worrisome issues that can plague your Kubernetes environment. These scenarios could point to a multitude of underlying issues, such as flawed application logic, incorrect configuration, or even an incompatibility with the environment in which the pod runs. By using Lumigo, you can receive real-time alerts for crash loops, allowing you to respond to issues as soon as they arise. The platform can help you pinpoint the root cause by providing detailed event data, so you’re not left guessing what went wrong.
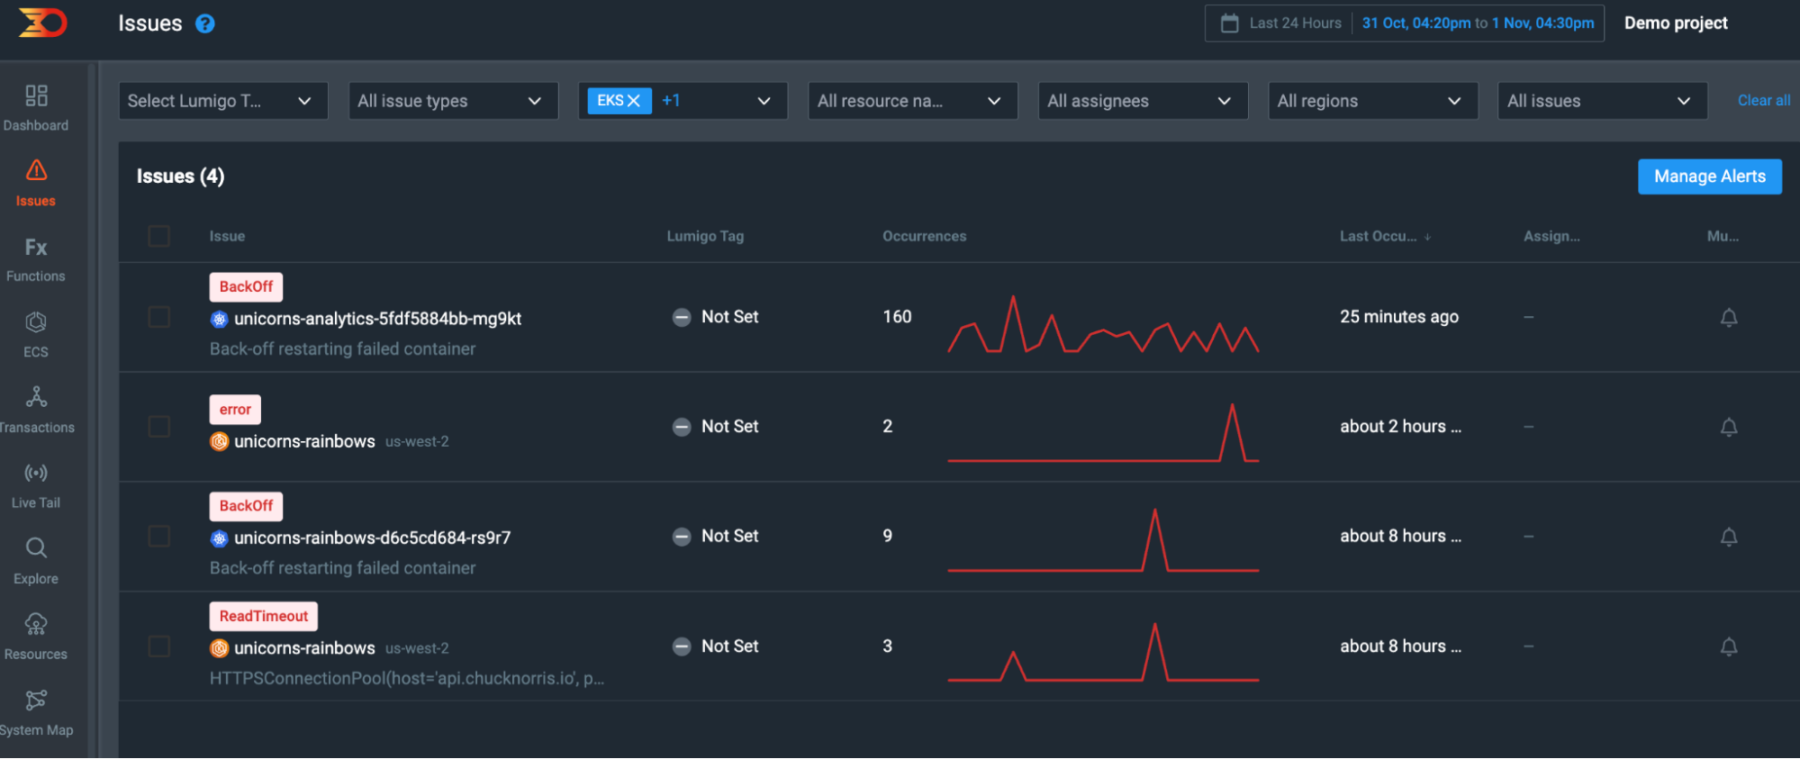
Example: You’ve recently deployed your unicorns-analytics script in a pod, and Lumigo sends you an alert about backoff errors for that specific pod. When you dig deeper, you realize that the script is trying to connect to a database that hasn’t been properly configured, causing the pod to crash and enter a loop. Because of the backoff mechanism, Kubernetes is increasingly delaying the restart of your pod. Lumigo’s alert allows you to quickly identify the issue and correct the database configuration, saving you from prolonged downtime and potential data loss.
Container Errors
When we talk about container errors, we’re essentially discussing the well-being of the very building blocks of your Kubernetes cluster. These errors can range from transient issues related to networking to more serious, persistent problems tied to your application’s code. Unlike more generic server or system errors, container errors often offer a very direct line of sight into the health of your specific services. Lumigo can help you aggregate and visualize these errors, offering a quick way to sift through the noise and focus on the most pressing issues affecting your containers.
Example: You’ve launched a new microservice and, according to Lumigo, your container is throwing a series of “File Not Found” errors. You check the application’s code and realize that it’s trying to read a configuration file that hasn’t been mounted into the container. Thanks to the error monitoring provided by Lumigo, you can correct the mount path and eliminate the errors.
Node Resource Utilization
While this isn’t an “error” in the traditional sense, overlooking high resource utilization can be a costly mistake. If your CPU, memory, or disk usage starts reaching the upper limits of what your nodes can handle, it could potentially lead to a series of cascading failures. Lumigo provides detailed metrics on node resource utilization, allowing you to set thresholds that trigger alerts when crossed. By doing this, you can proactively manage your resources, either by reallocating them, scaling your nodes, or optimizing the performance of your application to be less resource-intensive.
Example: Let’s say Lumigo alerts you that one of your nodes is exhibiting a disturbing trend: numerous operations are experiencing durations exceeding 10,000 ms. The high duration suggests that tasks are getting delayed significantly, which could be due to resource constraints or inefficient code paths. You take a closer look at the metrics Lumigo provides and see that this high duration is associated primarily with high CPU and memory utilization on the same node.

This is a crucial moment for diagnostics. Is it an application that has gone rogue and is monopolizing resources? Or perhaps it’s a data-intensive operation that needs to be optimized? By correlating this unusually high duration with other resource metrics in Lumigo, you can zero in on the culprit. For instance, if you find that a specific containerized service is the main contributor to this issue, you might consider optimizing its performance or moving it to a less burdened node.
High durations like this are not just statistical outliers; they are warning signs of potential bottlenecks or performance issues that can severely affect user experience and overall system reliability. Lumigo’s detailed metrics can assist you in identifying whether these high durations are isolated incidents or part of a larger, more concerning trend. By taking immediate corrective actions based on these insights, you help ensure that your applications remain responsive and that your nodes are efficiently utilized.
API Server Errors
The Kubernetes API server is essentially the central nervous system of your cluster, responsible for handling and routing virtually all the operational requests and responses. Errors at this level can reverberate throughout your entire environment, affecting deployments, pod scaling, and inter-node communication, among other things. Tracking API server errors through Lumigo allows you to identify bottlenecks or disruptions in your control plane. This data is invaluable for understanding how these errors can impact your applications and for taking the necessary steps to mitigate these issues before they escalate.
Example: Through Lumigo, you notice a recurring pattern of 520 HTTP status errors associated with your unicorns-rainbows service. These are unusual errors, as 520 typically indicates an unknown issue between the originating server and a proxy.

Intrigued, you decide to dig deeper. Upon further examination, you find that these 520 errors are occurring when your service attempts to communicate with an external API. This leads you to consider potential issues either in your network configuration or in the API gateway settings for the unicorns-rainbows service.
DaemonSet Misscheduling
In Kubernetes, DaemonSets ensure that instances of a specific pod run on all nodes, or on specific nodes meeting certain criteria. When a DaemonSet fails to schedule a pod as expected, it often indicates a deeper issue, such as resource constraints or configuration problems related to taints and tolerations. This is especially critical for DaemonSets that manage key infrastructure components like logging or monitoring agents. Using Lumigo, you can monitor for such misschedules and obtain detailed insights into why a DaemonSet might be failing to place a pod on certain nodes. Understanding this can help you make more informed decisions, whether it’s modifying the node’s resource allocation or updating the DaemonSet’s configuration to handle the specific conditions of your cluster.
Example: Your logging DaemonSet, designed to run on each node, is not deploying on new nodes. Lumigo notifies you about this scheduling miss, You find out that the new nodes have taints that are preventing the DaemonSet from being scheduled. With this insight, you can either modify the taints on the new nodes or update the DaemonSet tolerations to ensure your logging agents are deployed universally.
Focus on Metrics that Matter
Navigating the complexities of a Kubernetes stack can often feel like wandering through a labyrinth, fraught with hidden corners and unexpected twists. However, by focusing on key metrics like Pod Crash Loops, Container Errors, Node Resource Utilization, API Server Errors, and DaemonSet Misschedules, we can shine a light through the maze.
OpenTelemetry serves a pivotal role as part of any Microservice deployment by offering more than just isolated metrics when troubleshooting kubernetes errors. It gives you a holistic view that paints a full, easy-to-understand contextual narrative. This comprehensive view enables you to not just spot issues but also grasp their implications, origins, and how they relate to one another—all presented in a straightforward, intuitive interface with full body payloads. Sign up today and give it a try for yourself,
If you’ve gained valuable insights from this article and find it to be a helpful resource, we encourage you to share it with others who might benefit. Your feedback is invaluable to us, so if you have any comments or suggestions, don’t hesitate to reach out and let us know.