


As a developer, I love the versatility of Python. Over the years I have used Python for so many different use cases: game development, APIs, IoT, machine learning, and web development. It can scale tall applications in a single bound and take on any challenge faster than you can pip install flask.
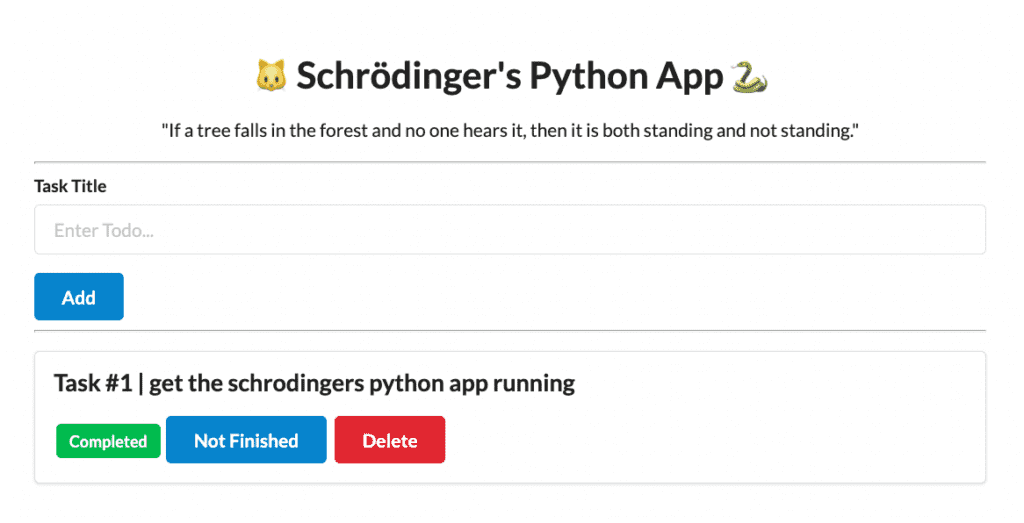
Something you learn very quickly in the world of app development is to build everything for scale. That one bug or issue you encounter during development, no matter how trivial, will only be amplified by 10000 or 1000000 users when deployed. This blog is the first in a series to help demonstrate how observability can aid in debugging applications in different programming languages. Schrodinger’s Python App simulates errors, so you can then get hands on and see how tracing helps you not only see when errors occur, but track down the source(s).
Additionally, there are times when the classic phrase “worked fine in dev” can cause potential pitfalls, particularly when dealing with multiple services and facets associated with modern cloud development.
Observing the cat in the App
Schrodinger’s famous cat is a thought experiment geared towards highlighting the question around observability. Essentially a condition which is unobserved can be both true and false at the same time.
The same concept is true in application development. If you are not observing your deployed applications then they are both throwing errors and running perfectly at the same time. Additionally, an unobserved application could be using more resources than is required and causing any number of problems for its end users.
As developers, devops and people supporting tech, it’s important to understand how the fundamentals apply to the things we deploy and support. So, we have created a demo application to help highlight tracing and monitoring with real life code.
Pre-requisites
The most important prerequisite is an AWS account, set up and connected to Lumigo. It’s quick and easy to get started with Lumigo and connect your AWS account. Check out the Quickstart Guide for more details, There’s also a Quickbytes video to help too.
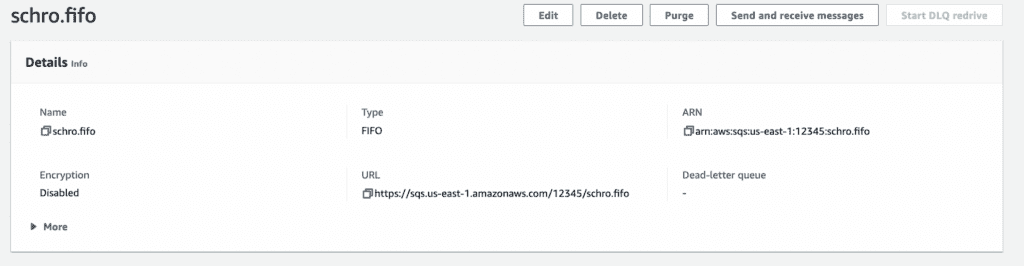
We also need an Amazon SQS queue and an authorized IAM configured, These credentials need to be stored in environmental variables. This is used by the meow command within the app to demonstrate tracing and observability using a FIFO SQS.
Once all that is all in place, Navigate to your local code playground in a CLI and `git clone` the repository from https://github.com/developersteve/Schrodingers-Python-App.
Setting the environment variables
The app will need some environmental variables to be set up to get running. The first 2 are created via your AWS SQS in your region of choice, Make sure you set this up as a first in first out (FIFO) queue.
Copy the SQS URL and set it as an environmental variable along with the region that you created it in.
sendQueueUrl
region_name
Then the next 2 env vars are populated from your AWS by creating an IAM with permission to access the above SQS.
aws_access_key_id
aws_secret_access_key
The final 2 environmental variables set the configuration keys for the Lumigo tracer, This helps bring the observability magic into your Lumigo Dashboard from your Application. We are going to need the Lumigo Tracer Token. Which can be found in the settings on your Lumigo dashboard. And the final env var, the service name, is an alphanumeric name that will help you recognize the app within Lumigo.
LUMIGO_TRACER_TOKEN
OTEL_SERVICE_NAME
Deploying to ECS
Build the docker image by heading to the application root from a cli and run `docker build -t shcro:latest .` If you are building on Apple silicon make sure you build for amd64 by running `docker buildx build –platform=linux/amd64 -t schro:latest.`
Then run through the steps needed to push the newly created image to an Amazon ECR repository from your docker environment, see the AWS docs on pushing a docker image for more info.
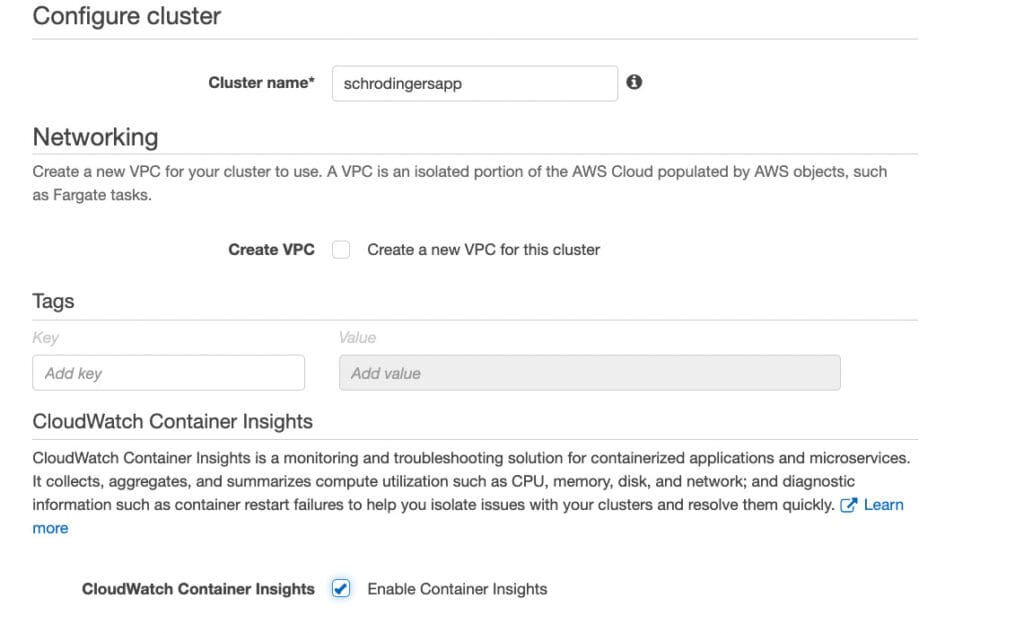
Next create a basic networking only cluster in AWS ECS and make sure you tick “Enable Container Insights” as part of the configuration. This enables additional metrics to be available within your Lumigo ECS dashboard.
 Once the cluster is set up, Create a Fargate task definition from ECS > Task Definitions. The container won’t need a whole lot of resources, but the best part here is we can start small and use Lumigo to see the amount it uses.
Remember to set those environmental variables from above when configuring the container, Also the port for the demo application is mapped to 8080. Create the service and deploy to that newly created cluster with a public available IP, Making sure to add port 8080 to the security group.
Observing the Cat in the App
It might take a minute or two for the container to spin up and get itself set up. When complete grab the IP address from your running cluster and drop it into your browser along with port 8080.
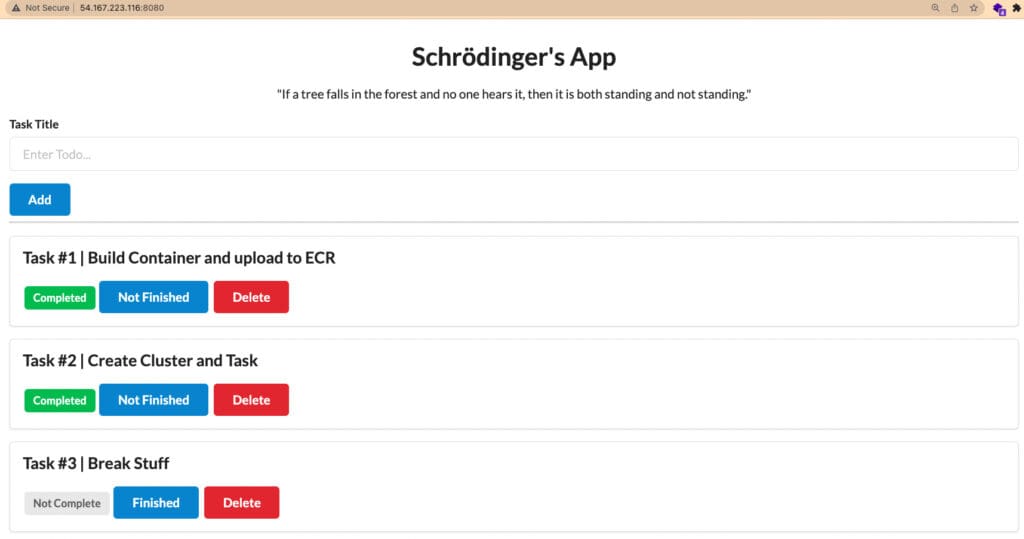
Add some todo items and then head to your Lumigo Dashboard which should start to show some metrics from the recent deployment. Click on the ECS tab which will show a list of traced clusters from your AWS as part of the ECS overview.
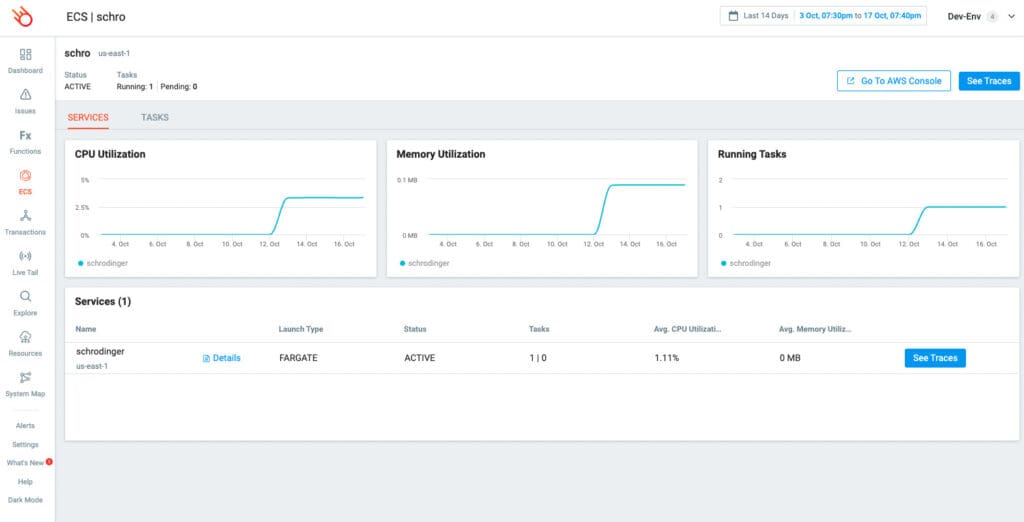
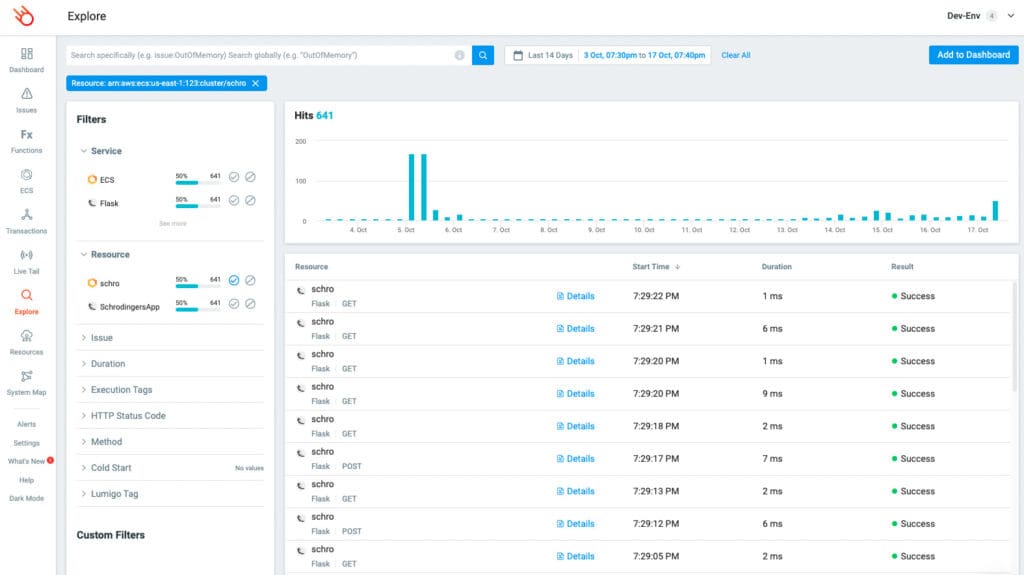
Clicking into our running service application will then also show some of the recent activity from the application. The details option on each entry will let you drill down into even more detail, and will even take you down to the invocation level.
Now let’s break stuff
As a dev/ops this is the part I love especially in a simulated environment like this. Switch back to that deployed Schrodinger’s app and we can now run through some of the special commands.
cat command

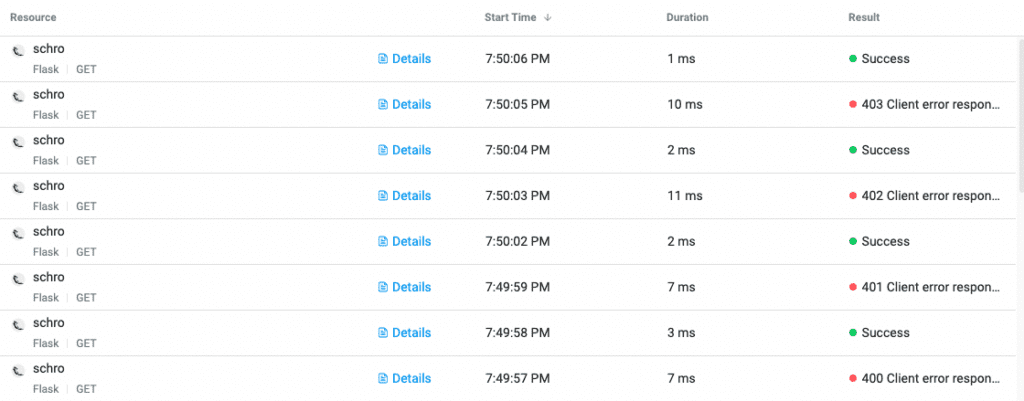
Creating a todo item with the word cat will create a listing with a ‘cat’ button. As you click the cat button it will iterate through a counter of http statuses starting at 400. Each time you click it, it will add 1 to the counter and cycle up the list of 400s (401, 402, 403, etc). These will be visible within that cluster service trace view which will show additional information about the occurrence.
httpstat command
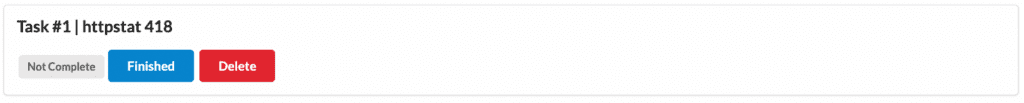
Similar to above this will create http status responses but in a more controlled way by entering `httstat` followed by the http status you might be looking for. This allows for specify http status responses you might want to test for and see how they appear in the Lumigo Dashboard.
meow Command
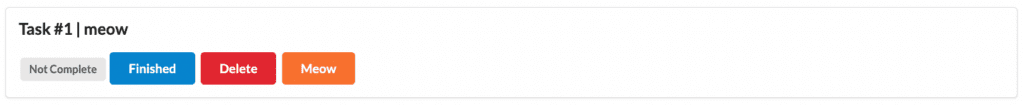
If the environment variables for the SQS are defined then entering `meow` as a todo will similarly create a ‘meow’ button with an iterative counter. Instead of sending http statuses however, It will demonstrate Lumigos power of end to end tracing and show the trace though additional services.
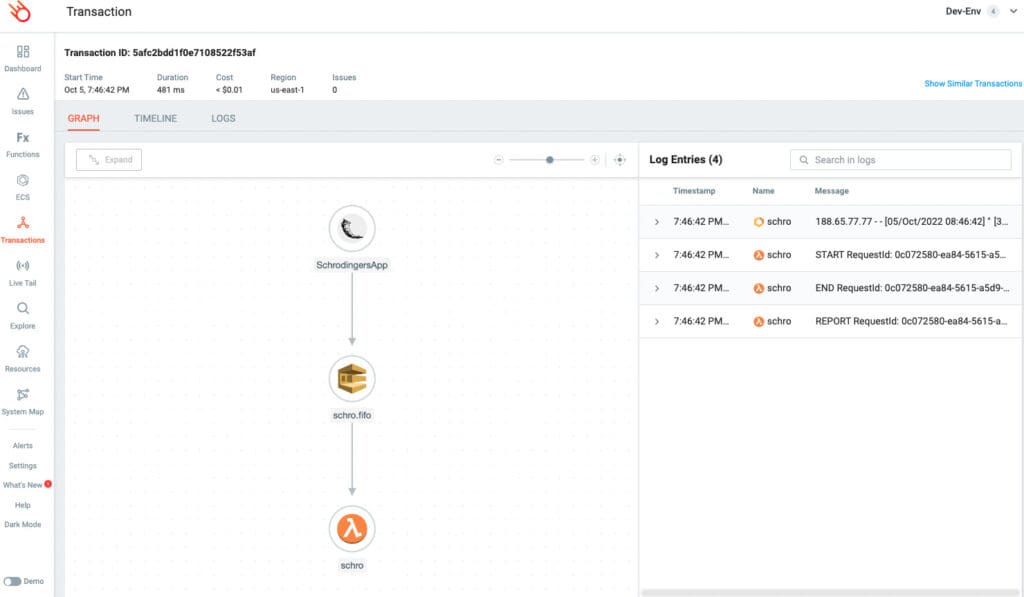
What I love here is the end to end trace, showing each service that has been called into action to handle the applications request. Here I’ve also added an additional Lambda function to trigger when the SQS is called into action.
Grab the code and test it for yourself
The app code is available at the Schrodinger’s Python App repo and we are always looking for contribs, comments and of course stars. Reach out and let us know if there’s something you want to see in there, or if you have any questions.
Set up a lumigo account and take it for a spin