


- Guide Content
What Is Distributed Tracing? Benefits, Challenges, and Tools
Distributed tracing, or distributed request tracing, is a method used in microservices architecture to monitor and troubleshoot applications. It helps developers to understand how requests flow across various microservices and infrastructure components. This technique provides invaluable insights into the performance and health of an application, enabling quick identification and resolution of issues.
In systems designed using microservices architecture, an operation often involves multiple services. Each service may call another to perform its function, creating a chain of requests. Identifying the cause of a delay or failure can be challenging in such a scenario. That’s where distributed tracing steps in. It gives developers a bird’s eye view of all requests, paths, and their latency, making troubleshooting much more straightforward.
However, distributed tracing is not just about identifying problems. It also plays a vital role in optimizing application performance. By analyzing traces, developers can identify bottlenecks and areas of improvement. They can understand how services interact with each other, how data flows, and how resources are used. This knowledge helps in making informed decisions on performance improvements and resource allocations.
This is part of an extensive series of guides about observability.
In this article
The History and Evolution of Distributed Tracing
The concept of distributed tracing was born out of the necessity to manage and monitor complex distributed systems. In the early days of computing, applications were monolithic, and all components of the application ran in a single process. Troubleshooting was straightforward because everything happened in one place. But as systems grew more complex and started to span multiple services, processes, and servers, a more sophisticated performance monitoring method was needed.
Google’s Dapper, a large-scale distributed systems tracing infrastructure, was one of the earliest implementations of distributed tracing. The Dapper paper (Sigelman et al., 2010) introduced the concept of tracing requests as they traverse through various services in a system. This was a breakthrough in the field of system monitoring and performance optimization.
Since then, distributed tracing has come a long way. Modern distributed tracing tools trace requests and provide advanced features like performance analytics, anomaly detection, and visualizations. They are designed to handle the challenges of modern distributed systems, like high concurrency, asynchronous communications, and multi-tenancy. Today, distributed tracing is essential to the observability toolkit for microservices and cloud-native applications.
How Distributed Tracing Works
Span
In distributed tracing, a span represents a single operation or task within a trace—the basic unit of work in a trace. A span could represent a service call, a database query, or any other operation you want to monitor. Each span has a start and end time, which gives us the duration of the operation.
A span also contains additional information, like operation name, service name, and other metadata. This information is helpful in understanding what the operation does and where it fits in the overall trace. A span may also reference other spans, which represent causal relationships between operations.
Trace
A trace is a collection of spans representing a single operation from start to end. In a microservices architecture, a trace follows a request as it flows through various services and operations. Each trace has a unique trace ID, which correlates spans that belong to the same request.
A trace provides a complete picture of a request—where it started, which services it interacted with, how long each interaction took, and where it ended. By analyzing traces, you can understand the behavior of a request, identify bottlenecks, and troubleshoot issues.
Tags
Tags are key-value pairs that add context to spans and traces. They provide additional information about the span, such as the service name, operation name, error details, etc. Tags can be used to filter and search traces, making it easier to find relevant information.
For example, a tag could indicate the HTTP method (GET, POST, etc.) used in a request, the status code returned by a service, or any other relevant information. By using tags, you can drill down to specific trace detail s, allowing for more precise and efficient troubleshooting.
Distributed Tracing vs. Logging
While both distributed tracing and logging can be used to monitor and troubleshoot applications, they are not the same. Logging is the process of recording system events or user actions. These logs can then be used to identify errors or issues. However, logs are often isolated and might not provide a comprehensive view of a request’s journey across multiple services.
Distributed tracing provides a detailed view of a request’s path through various services. It allows you to see the interaction between components and identify where issues may occur . Distributed tracing collects data about the execution of a request, including where it originated, where it traveled, and where it encountered problems. This data is invaluable in diagnosing issues and optimizing performance.
Distributed tracing and logging complement each other in a microservices environment. While distributed tracing gives you a high-level view of the request flow across services, logging provides granular details about individual events within each service. Therefore, both are crucial for effective monitoring and troubleshooting.
Benefits of Distributed Tracing
Here are the key benefits of distributed tracing for microservices applications:
- Troubleshoot problems faster: When a failure or slowdown occurs in a distributed system, it can be challenging to determine where the issue originated. With distributed tracing, you can trace the path of a request to pinpoint where it encountered problems. Distributed tracing lets you view the entire request journey at a glance.
- improve collaboration and accountability: Different teams often manage different services in a microservices architecture. When an issue arises, it can be challenging to determine which team is responsible for resolving it. Distributed tracing provides a clear picture of how services interact, making identifying the team responsible for a specific bug or performance issue easier.
- Flexible integration and implementation: Distributed tracing can be integrated with various development tools and platforms, making it a versatile solution for monitoring and troubleshooting. You can use distributed tracing to monitor real-time performance, or you can use it to analyze historical data for long-term performance optimization. You can also customize the level of detail collected by distributed tracing.
Challenges of Distributed Tracing
Despite its many benefits, implementing distributed tracing is not without challenges. Let’s discuss some of these challenges in more detail.
Manual Instrumentation
One of the primary challenges of implementing distributed tracing is manual instrumentation. This involves modifying the code of each service to emit trace data. While this provides the highest level of control and customization, it can be time-consuming and error-prone, especially in large systems with numerous services.
Furthermore, manual instrumentation can lead to inconsistencies if not done correctly. For instance, if different teams are responsible for different services and instrument their services differently, it can lead to inconsistent trace data.
To overcome this challenge, many organizations opt for automatic instrumentation provided by distributed tracing tools. These tools automatically inject the necessary code to capture trace data, reducing the burden on developers and ensuring consistency.
Lack of Front-End Analysis
While distributed tracing provides a detailed view of the backend processing of requests, it often lacks visibility into the front-end user experience.
This can be an issue as front-end performance can significantly impact the user experience. For instance, even if the backend processing is efficient, slow rendering on the client-side can lead to a poor user experience.
To address this issue, some distributed tracing tools are starting to incorporate Real User Monitoring (RUM) capabilities. This provides visibility into the user’s experience, including page load times, user interactions, and JavaScript errors.
Sampling
Sampling is another significant challenge in distributed tracing. Sampling involves selecting a subset of requests to trace to reduce the trace data collected and stored.
While sampling can help manage the volume of trace data, it can also lead to missing important information. For instance, if a problem occurs in a request that was not sampled, it would not be captured in the trace data.
There are different strategies for sampling, such as random sampling, rate limiting, and adaptive sampling. Each has its pros and cons, and choosing the right strategy can be a complex task.
4 Popular Distributed Tracing Tools
Lumigo

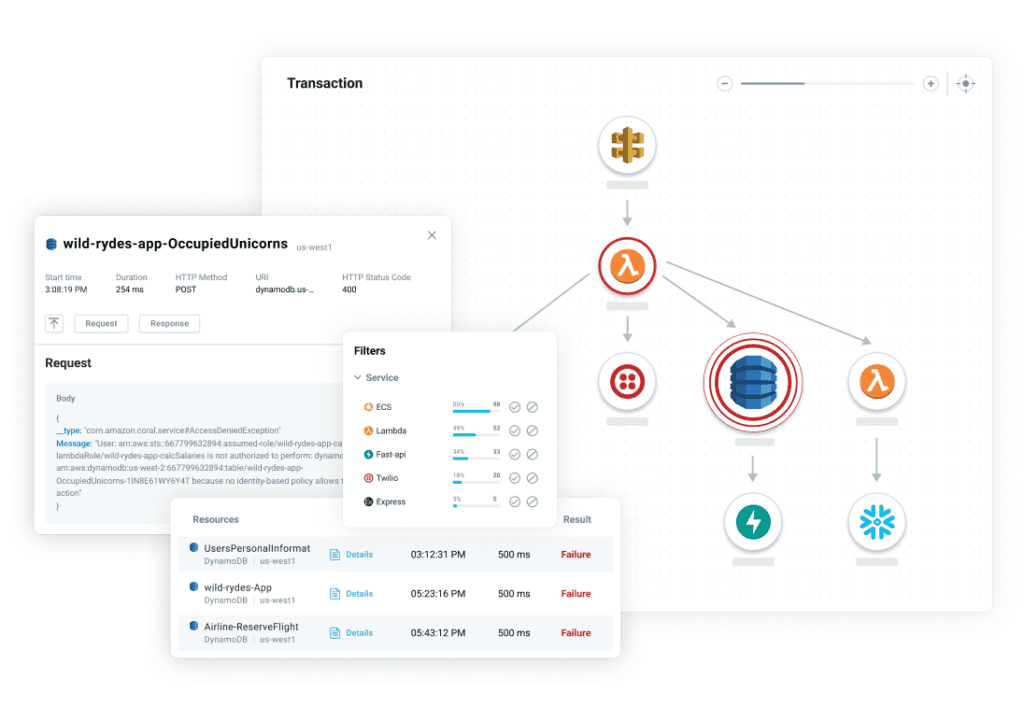
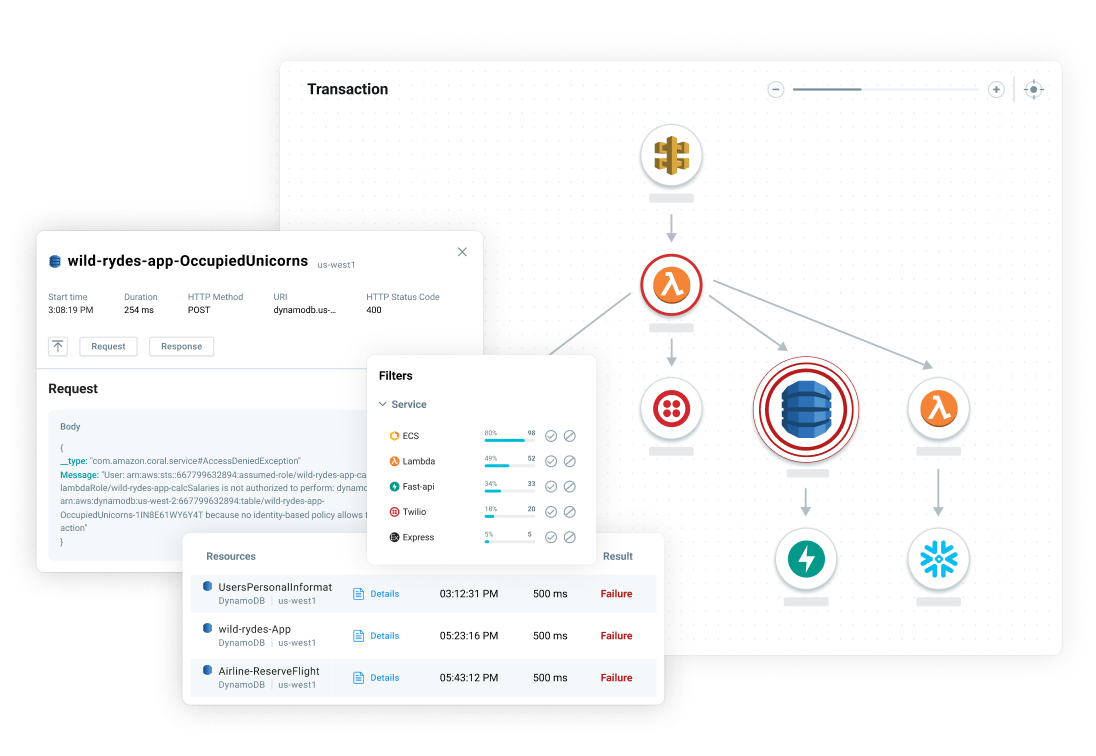
Lumigo is a serverless monitoring and debugging platform specializing in distributed tracing. It is designed specifically for serverless and container architectures on AWS, making it suitable for AWS Lambda functions, Amazon ECS, Amazon EKS, and related services.
Source: Lumigo
Lumigo automates the process of tracking and visualizing serverless application flows, providing insights into the performance and cost of serverless applications. It identifies bottlenecks and issues in real-time, enabling quick troubleshooting.
One of Lumigo’s standout features is its ability to generate a visual map of transactions across a serverless application’s components, giving developers a comprehensive view of their system’s architecture and performance.
OpenTelemetry
![]()
OpenTelemetry is an open-source project that provides a set of APIs, libraries, agents, and instrumentation for collecting and exporting telemetry data (metrics, logs, and traces). It is a merger of two projects, OpenCensus and OpenTracing, and aims to provide a unified standard for service instrumentation.
Source: OpenTelemetry
OpenTelemetry is designed to be language-agnostic and supports a wide range of programming languages, making it a versatile choice for diverse application ecosystems. It enables developers to capture insights into their software’s performance and behavior, which is essential for optimizing and debugging complex distributed systems. OpenTelemetry’s flexibility and broad community support make it a popular choice for implementing observability in modern software applications.
Zipkin
![]()
Zipkin is an open-source distributed tracing system that helps gather timing data needed to troubleshoot latency problems in microservice architectures. It manages both the collection and lookup of this data and provides a user-friendly interface for monitoring and analyzing distributed transactions.
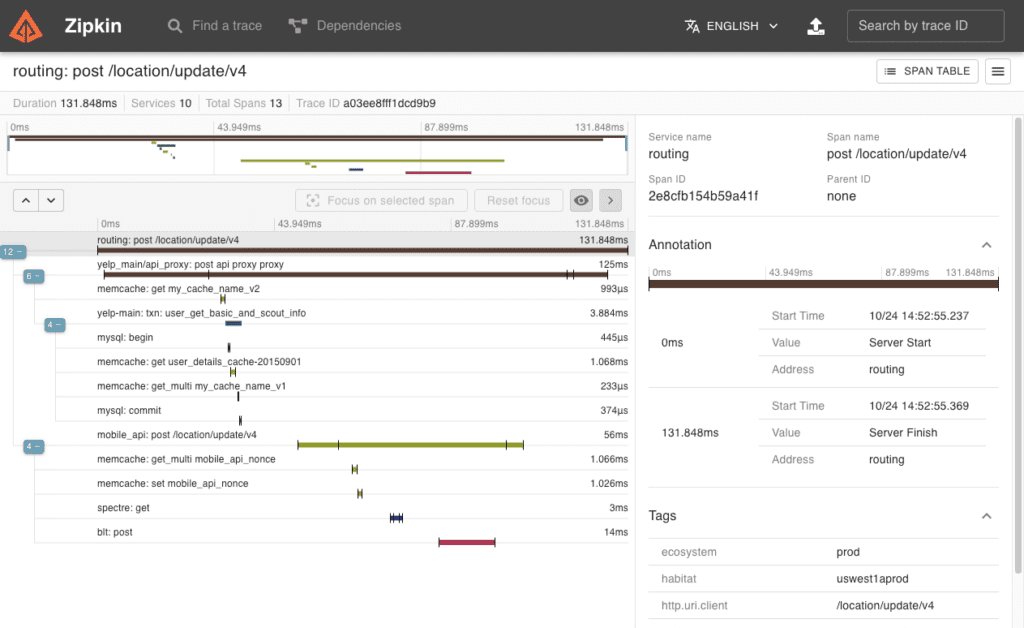
Source: Zipkin
Zipkin’s design is based on the Dapper paper by Google, focusing on low-overhead operation essential for high-volume applications. It provides detailed tracing information and visualization of service dependencies, which assists in understanding the behavior of complex distributed systems. Zipkin supports various programming languages and frameworks, making it adaptable to many different technology stacks.
Jaeger
![]()
Jaeger is an open-source, end-to-end distributed tracing system, developed by Uber Technologies. It is used for monitoring and troubleshooting microservices-based distributed systems, including distributed context propagation, distributed transaction monitoring, root cause analysis, service dependency analysis, and performance/latency optimization.
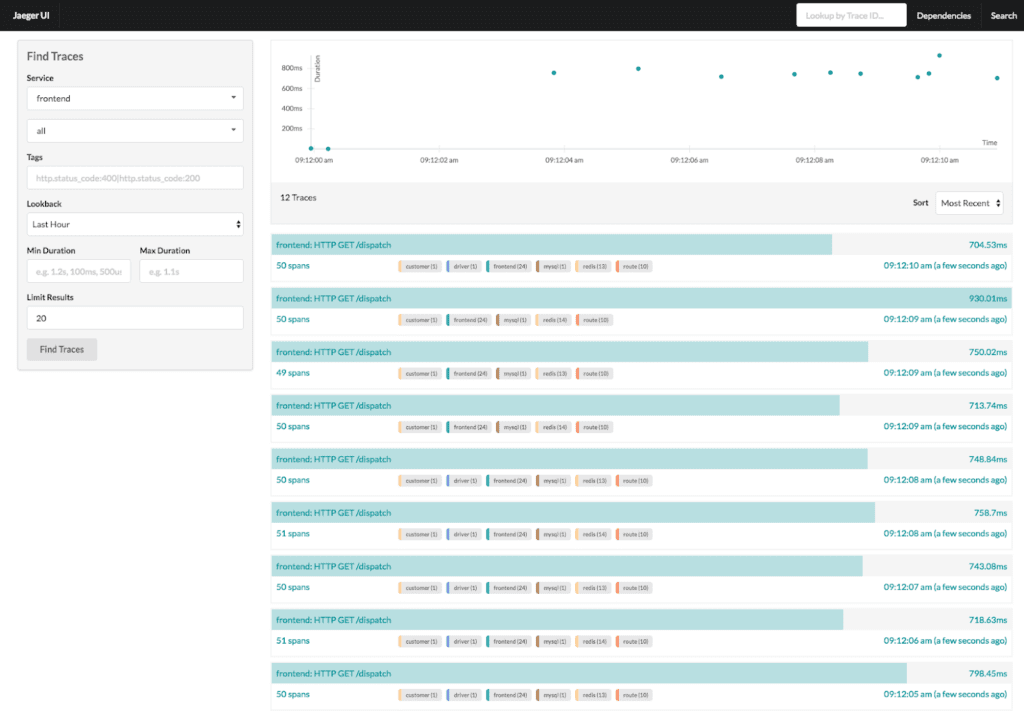
Source: Jaeger
Jaeger allows users to track the progress of requests as they travel through a network of microservices. It offers features like real-time transaction and performance monitoring, root cause analysis, and service dependency visualization. Jaeger’s integration with Kubernetes and its support for multiple storage backends, like Elasticsearch and Cassandra, make it a robust solution for large-scale and dynamic environments.
See Additional Guides on Key Observability Topics
Together with our content partners, we have authored in-depth guides on several other topics that can also be useful as you explore the world of observability.
serverless monitoring
Authored by Lumigo
- Serverless Monitoring Guide
- Serverless Deployments: 5 Deployment Strategies & Best Practices
- Serverless vs. Microservices: 4 Differences & Potential Synergies
5xx Server Errors
Authored by Komodor
- 5xx Server Errors – The Complete Guide
- How to Fix Kubernetes ‘502 Bad Gateway’ Error
- How to Fix Kubernetes ‘Service 503’ (Service Unavailable) Error
Exit Codes
Authored by Komodor