Dec 04 2020
This blog post was written jointly by the teams at Lumigo and Cloudway. It’s a step-by-step guide to AWS Step Functions workflows with full monitoring and troubleshooting capabilities. We will use the “right to be forgotten” GDPR workflow as an example application.
Intro
As an enterprise grows, it tends to acquire or develop a few (IT) subsystems containing various forms of personal data about customers. This is perfectly natural and is necessary for the normal operations of a business. But what if you want to delete the data of one or more of these users? How would you coordinate this deletion across the various systems? What happens if one of these systems fails to delete the data of a user, or better yet, how would you know that a system was unable to delete the data of one or more users?
In this blog, we will talk you through a possible way to handle the GDPR regulations of the European Union in your organization by using a serverless application running on AWS.
We will also talk more in-depth about the difficulties a similar application encounters concerning monitoring, logging, and alerting and how to tackle them.
Want to learn more? Join our webinar
Lumigo and Cloudway will be hosting a live webinar on this topic on Thursday, December 10.
During the webinar, we will demo the entire workflow and show you in detail how Lumgio works and how it can make your monitoring a lot easier. Our experts will also be available to answer your questions live. So please join us. Register here.
Now let’s dive in…
What is GDPR?
Before we start architecting a solution, we need to understand GDPR. For this, it’s best to have a look at the GDPR guidelines, or more specifically in our case the “Right to be forgotten”. Making a long (legal) story short, it boils down to: “Enterprises have about a month to delete user data once requested”.
How do we tackle this?
What you need is an overall controlling workflow to manage and monitor the deletion of user data across multiple systems in parallel. You don’t want to wait for one system to have deleted the user data before moving on to the next. You’ve got a deadline to maintain after all. You need to start a workflow once a user has requested his data be deleted, and you need a workflow for each subsystem to request the deletion of that user’s data and monitor the result. This overall workflow could look something like this:
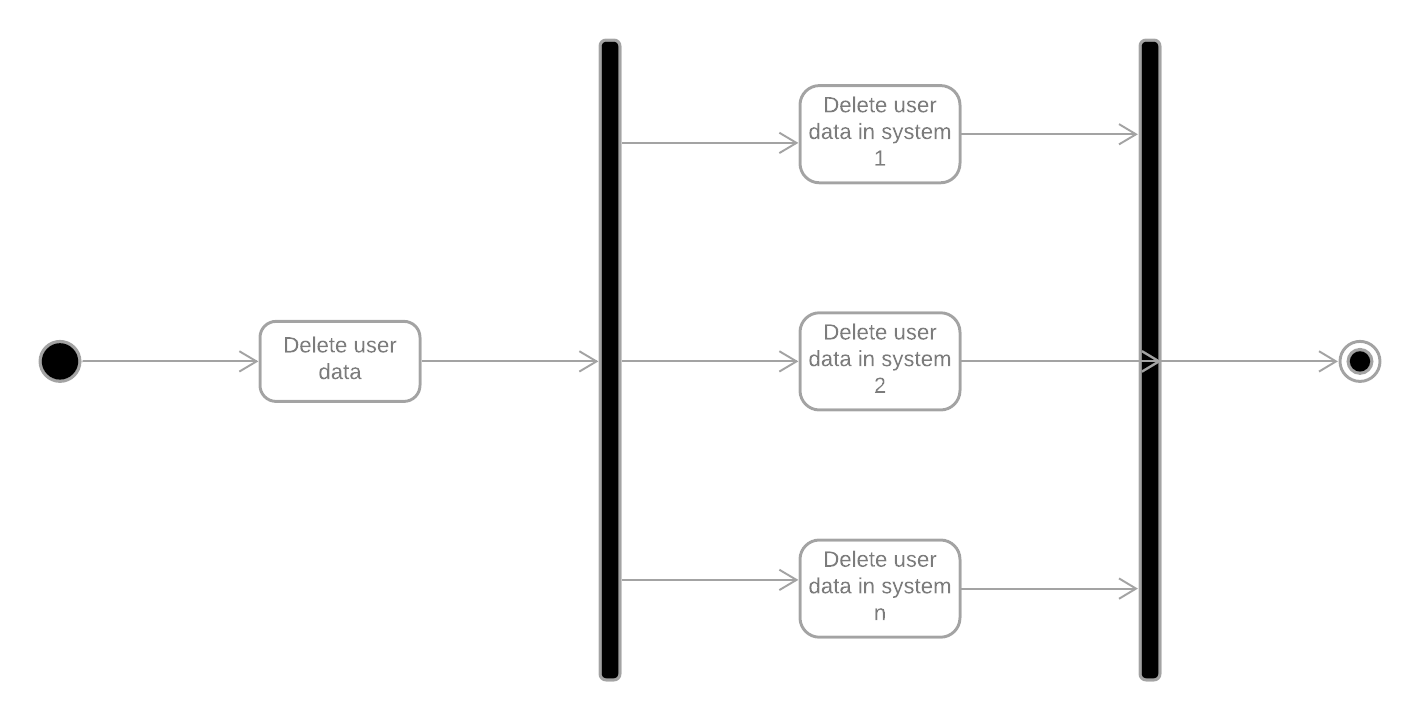
This workflow could delete data in an arbitrary number of subsystems, which would each need a controlling workflow for the deletion in that specific subsystem. These underlying workflows could look like this:

We end up with an overall controlling workflow, managing the underlying workflows, which in turn manage the deletion of a user in a specific subsystem.
Now that we got our high-level overview out of the way let’s deep dive into the implementation.
Technical architecture
Now that we have a general overview of what we need and how it needs to interact, we need to decide which technologies to use:
- A way to control the different states/steps in the workflow and manage the transitions
- To send requests to a subsystem to delete data of a specific user
- Notify any interested party when something has gone wrong in this process.
We’ve chosen to go for a completely serverless approach by using the following services of the AWS cloud:
- AWS Step Functions to manage the workflow
- AWS Lambda to send the requests
- AWS SNS to send notifications regarding the failure of a user’s deletion
You might be asking yourself why we’ve chosen these services, and not just created a server specifically for these user deletions, which would then manage the workflow and the deletion in the specific subsystems. Architecturally speaking this would be easier right? Well, yes. Purely architecturally speaking it would be easier, but the combination of the services above has many benefits:
- AWS Step Functions will give you a visual representation of where exactly a specific request is at a given time. Along with some information about the various transitions, it went through. We’ll show you what it looks like later!
- It also gives you a visual representation of which requests are still in progress, which have completed, and which failed.
- A specific workflow can run up to a year (at least at the point of writing this). Since our workflow has about a month to complete, this is more than enough.
- We don’t need to maintain any state about where a request is at a given time since it’s managed for us, which greatly simplifies what we need to do once the server crashes and the processes need to be resumed from where they left since…. well, there is no server that we manage so… nothing to do here! At least not for resuming the workflow, we still need to handle normal error cases, which can be done by using the retry mechanism built into Step Functions.
- Since we have a completely serverless approach, we only pay for the moments it’s actually being used. Suppose only one user has requested for his data to be deleted this year, then we only pay for a few transitions, a couple of milliseconds of processing we needed to send the request, and a couple of seconds to check whether the user has been deleted. On the other hand, the server would need to run continuously and would continue to increase our billing, why pay for something you don’t use… right?
- Let’s look at the other side, imagine a million people requesting that their data should be deleted on the same day. While the server would be struggling a lot to comply with this demand and would quite possibly go down a few times, the serverless approach is built for scale and would easily manage this load. You could even add some queuing in between to prevent the subsystems from being overloaded.
- Because our workflow has been split into various Lambdas, they could be written in different languages or even be maintained by different people. Another one of the benefits of a microservice-like approach.
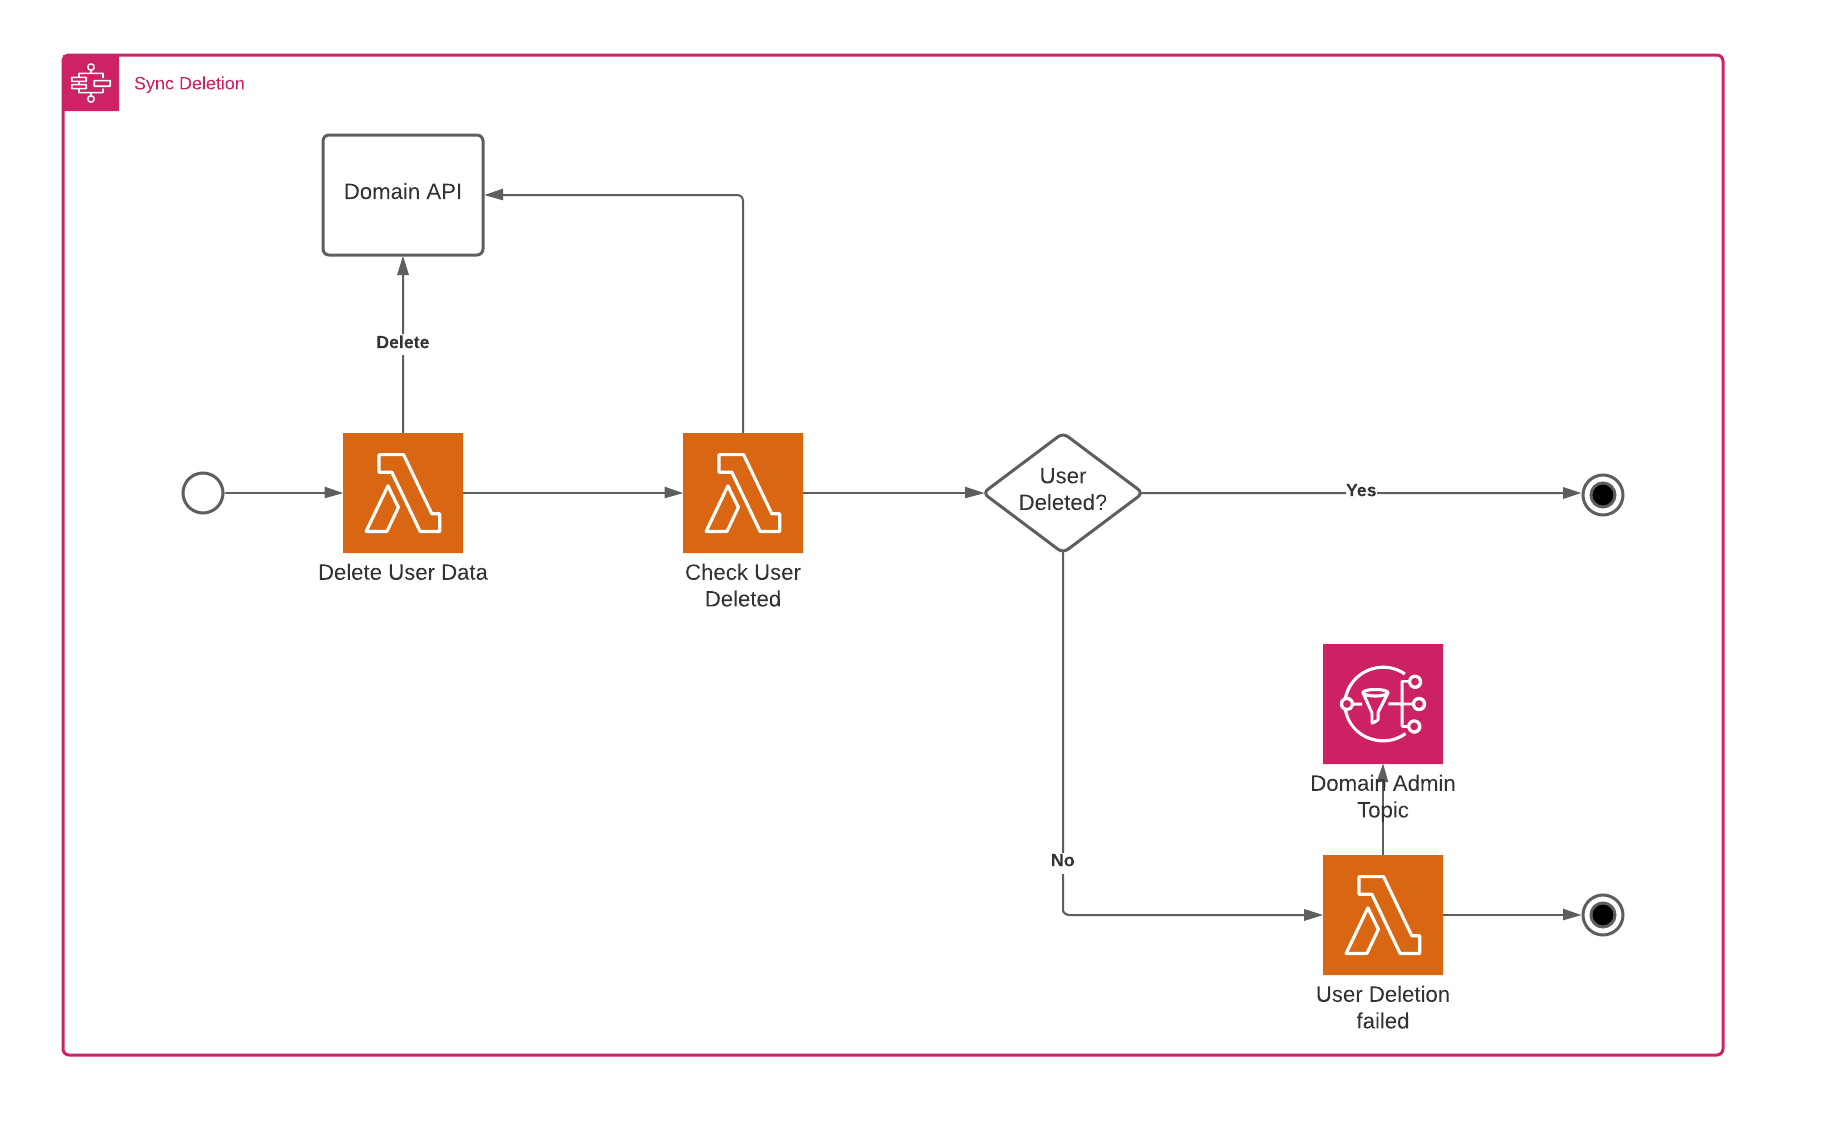
Now that we’ve chosen our technology stack let’s go a bit deeper into some technical details. For the subsystem, we’ve made a distinction between a synchronous and asynchronous subsystem. The synchronous system would delete the data immediately. In contrast, the asynchronous system simply registers the user deletion and would delete the user over time (possibly with some form of batch processing). Both methods require a slightly different approach regarding the monitoring of a user’s deletion. The synchronous flow is the easiest and is shown below.
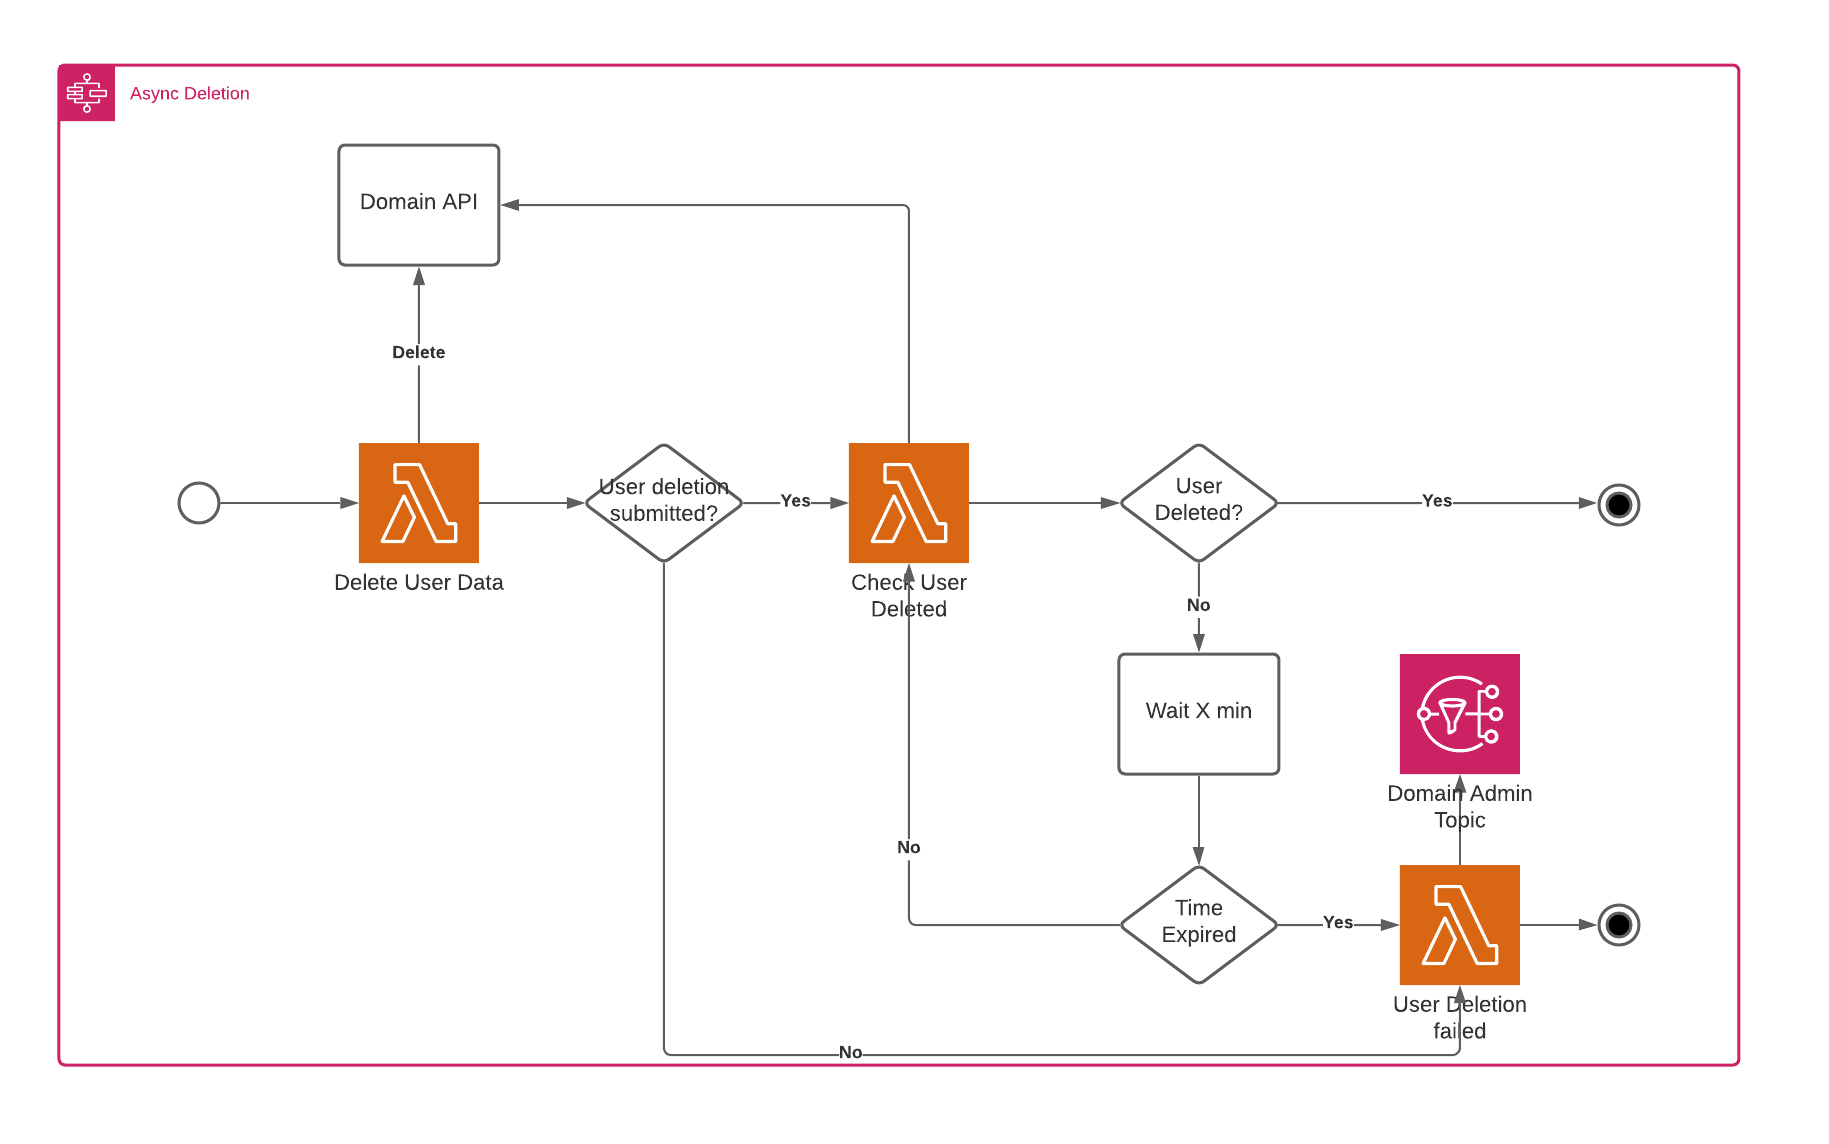
The asynchronous flow is slightly more complex and requires a polling process after the delete has been sent, which takes the deadline into account. The flow is shown below.
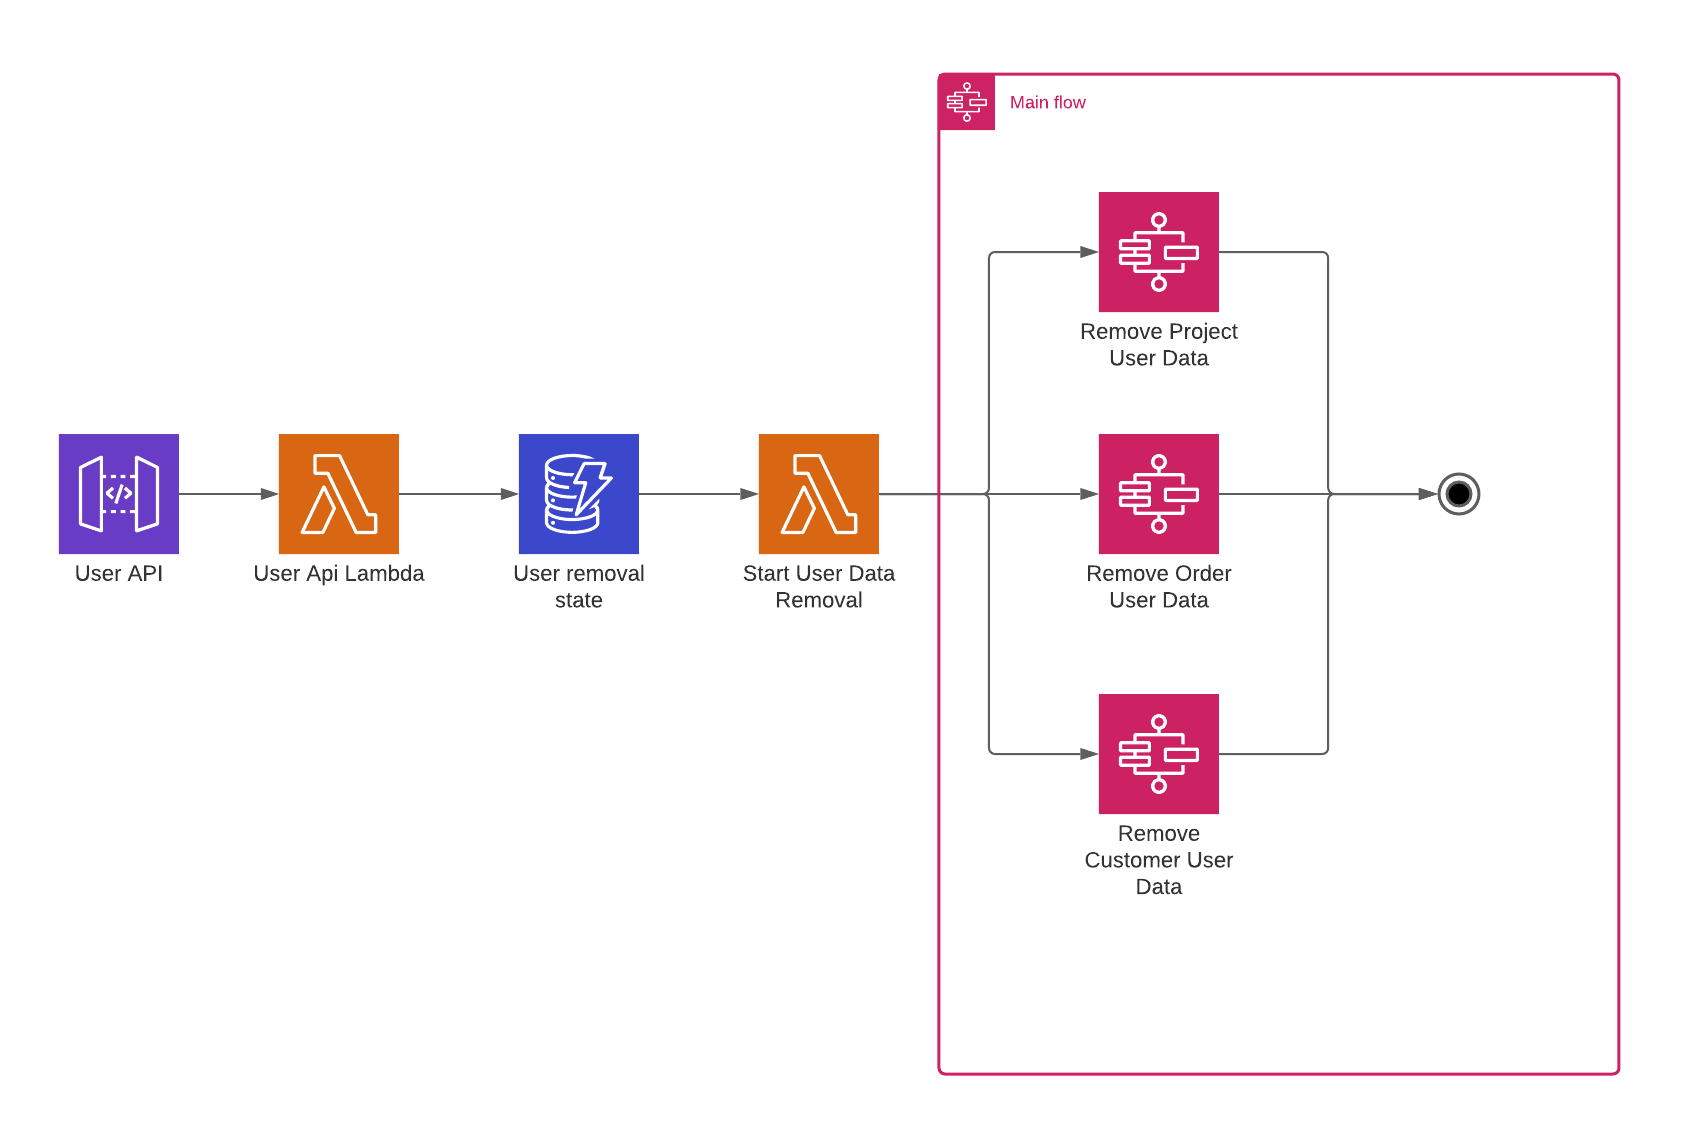
The last addition is the overall workflow management. In this case, we’ve chosen to start everything on an API request. When someone sends a delete request with his id, we store the id, along with the timestamp of the deletion request. The flow then needs to be completed within 30 days after the original request was made.
Problems
Now we have a fully serverless architecture managing our GDPR deletion process. Great! Now we’re done, aren’t we? Well, not exactly, while the flow seems to be okay, and most cases seem to be covered, this is only enough in our happy cases. What do we do once we receive an input we didn’t expect? When we misconfigured something? How do we know these things? On top of this, we might want to have an overview of how much activity is going through the system, the number of errors occurring at a given time frame, and if any errors occurred at any given point in time, we’d like to know wouldn’t we? These can be divided into three parts: Logging, Monitoring, and Alerting.
Logging
While it’s easy to set up logging using your favorite framework in any of the various programming models of AWS Lambda, consolidating this into one whole is a different story and is not an easy task. In addition, separating the logs into logical parts, including the whole transaction flow, is crucial when debugging a microservice environment like ours.
When working with external systems it can also be very useful to see exactly what we’ve received as input at a given time from the system.
Monitoring
The most important thing we’d like to know in this architecture would be:
- The number of times that our functions are invoked
- The number of errors that we’ve encountered
- How much of the given memory we consumed
- What is our function’s execution time? Did we get any time-outs?
Most of these things are visible in the lambda dashboard in the AWS console, but we’d also like to have a complete overview of all the functions that we manage and the system as a whole. To accommodate this we’d need to have a dashboard, which has to be updated every time we create a new function.
Alerting
If something unexpected happens in one of our functions, we’d like to know, or even better, we’d like to be notified as soon as possible. Using the services of AWS itself, we’d need a combination of different alarms and this for every function we’d like to run. While this is all possible, it’s a little cumbersome to do so every time we add a function. Moreover, when an error occurred, we would like to get immediate and actionable information to troubleshoot it.
Solution
To provide a solution for the problems above, which arise in most projects when the architecture becomes complex, a framework/tool for monitoring serverless applications becomes more and more a necessity. In this case, the tool we’ve looked at is Lumigo, a monitoring platform specifically designed for serverless applications running on the AWS cloud. We’ll be showing you how to integrate it into your application, how to find what you’re looking for, and how it solves the above problems.
Application
We have created an application, which is used to follow the rules imposed on us by the GDPR guidelines. This application will be deployed on AWS and will consist of multiple resources, like API Gateways, Lambdas, DynamoDB, Step Functions, and so on.
Organization
Let’s start by looking at our organization. We have three departments containing data that should be removed when our deletion process starts. These domains are project, order, and customer.

To comply with the guidelines, data needs to be removed from all these domains. Let’s take a look at how our application will be set up.
Main Workflow
The main workflow coordinates the process of removing all the user data available throughout the different domains of our organization.
When we send a rest request to an API Gateway to remove the user data of a specific user, we invoke a Lambda, which stores the provided user id in a DynamoDB table. This DynamoDB table will produce a DynamoDB stream, which invokes another lambda. This lambda will kick off the workflow.
As has been mentioned before, our organization has three domains, which all store user data, the project domain, the order domain, and the customer domain. This workflow will send a request to each domain in parallel asking them to kindly remove the data of this user.
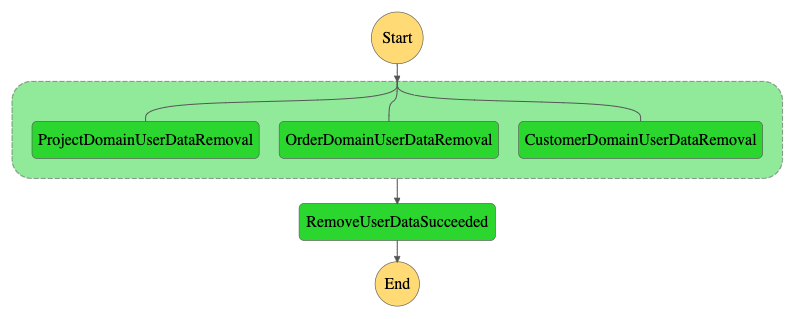
In the above image, we see a successful run, the domains successfully removed all user data they had, and all finished executing successfully. However, in practice, things won’t always go so smoothly. What happens if one of the domains is not able to delete the data in time? This flow is illustrated in the flow below.
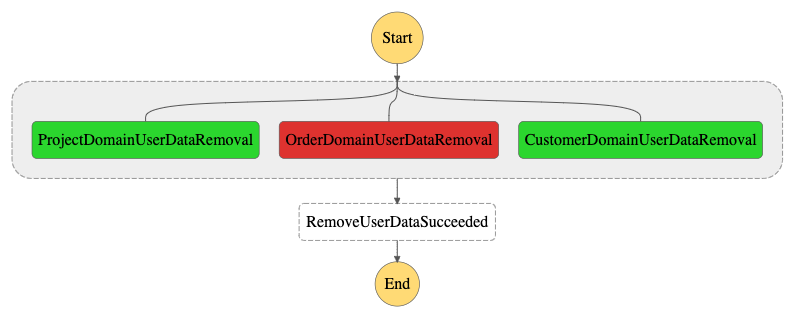
In this case, the order domain had some problems deleting the user’s data in their systems and failed its flow. This made our main workflow fail as well. Because Step Functions considers the entire parallel step to be failed if the error isn’t properly handled, if you want to know more about Step Functions parallel steps, check the docs here.
Synchronous Workflow
The main workflow invokes three other workflows. The project domain contains very little user data and has a very easy and straightforward way to remove everything they have in a timely manner. Because of this, they can provide a synchronous API to send a removal request.
This allows us to implement a very straightforward synchronous workflow, as shown below.
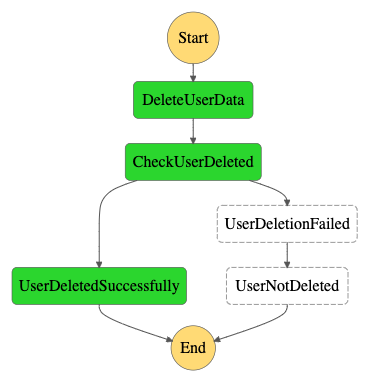
In the DeleteUserData step we invoke the synchronous API of the project domain, the API returns an error response when it fails to delete the data, which the function, in turn, translates to a boolean, specifying whether the deletion was successful or not. In this case, the API returned an “OK” response, and the function translated this to true, so the CheckUserDeleted step goes to the UserDeletedSuccessfully end-stage.
However, this isn’t always the case, as can be seen in the next workflow.
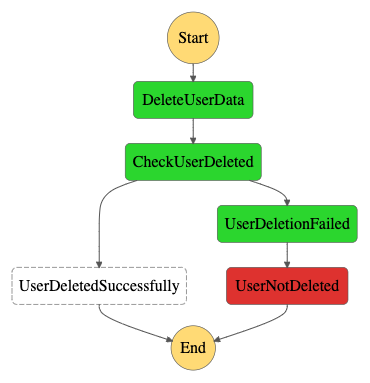
In this example, the project domain couldn’t complete the deletion. The CheckUserDelete step will then delegate to the UserDeletionFailed step, sending an email to the admin of the project domain, telling him some manual action is required to get the user data removed.
Asynchronous Workflow
The order and customer domain contain more user data and have it scattered in many places inside their systems. For their domains, queues are being used and you have people doing manual removals of data. Because of this, a simple synchronous call to their API won’t work to request the removal.
An asynchronous workflow has been implemented to alleviate this problem.
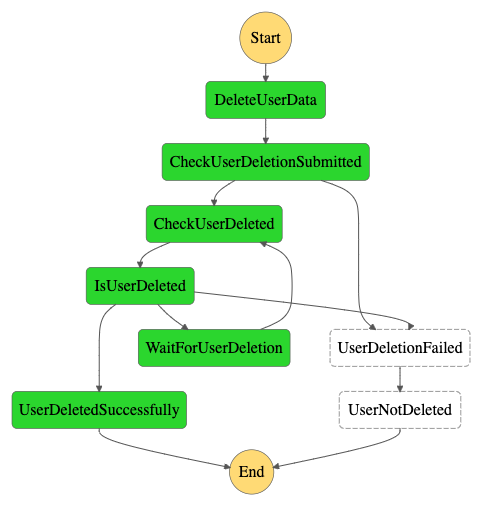
The DeleteUserData step will send an asynchronous request to the customer and order domain APIs, which will immediately return an answer marking the request as being submitted.
If the request was submitted successfully the workflow will start polling their API to check if the user data has been removed. If something went wrong during the submission itself, which could be because of network problems, for example, the workflow will immediately go to the UserDeletionFailed step.
Then the CheckUserDeleted step says the user hasn’t been deleted yet it will provide this information to the IsUserDeleted step. This step will then invoke the WaitForUserDeletion step if our deadline hasn’t expired yet. This step waits for a set amount of time before going back to the CheckUserDeleted step.
In the above case, the user was deleted within the allowed amount of time, and the IsUserDeleted step calls the UserDeletedSuccessfully step, ending the workflow successfully.
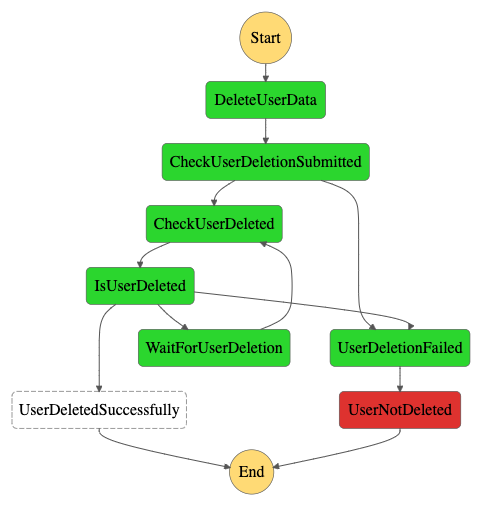
In the image above, the user couldn’t be deleted in the maximum defined amount of time. The workflow will fail and an email will be sent to the admin of the required domains, urging him to get a move on with deleting the data. In other words, manual intervention is required.
Integrating Lumigo
To monitor the application, finding out where bottlenecks are, where errors happen and so on we’re going to use Lumigo. Lumigo traces the requests your application receives from source to finish.
Integrating Lumigo into your application is very straightforward, and you have a few possibilities here. We’ve chosen the lambda layer approach, but you can also auto-instrument your function on the Lumigo site or manually wrap your function using the Lumigo tracer as well. If you want to know more about the different possibilities you can read more here. Because we’ve chosen the lambda layer approach, we need to include the layer in each of our Lambdas, because it contains all the monitoring code and is fully abstracted away from your application code.
Layers:

- arn:aws:lambda:eu-west-1:114300393969:layer:lumigo-node-tracer:108
If you’d like more information about what the lumigo-node-tracer can do for you, have a look at Lumigo’s Github page, which contains the source code and extra documentation.
Secondly, you’re going to need to provide some environment variables, which are used to instrument the layer.
The LUMIGO_TRACER_TOKEN variable contains the API key we receive from Lumigo, in this case, it’s stored on the AWS SSM Parameter Store, at deploy time it will be injected from there as an environment variable.
The LUMIGO_ORIGINAL_HANDLER variable contains the handler of our lambda, which is used by the Lumigo layer to trace the function execution.
Environment:

Variables:

LUMIGO_TRACER_TOKEN:!Sub '{{resolve:ssm:/${Application}/lumigo/token:${LumigoTokenVersion}}}'

LUMIGO_ORIGINAL_HANDLER: user-api-lambda.handler
Now that we’ve added Lumigo to our application, we can set up some alerts. We’ll do so by going to the Alerts configuration section in the Lumigo platform. The reason you can do this now is that alerts work out of the box for most use-cases, as mentioned above.
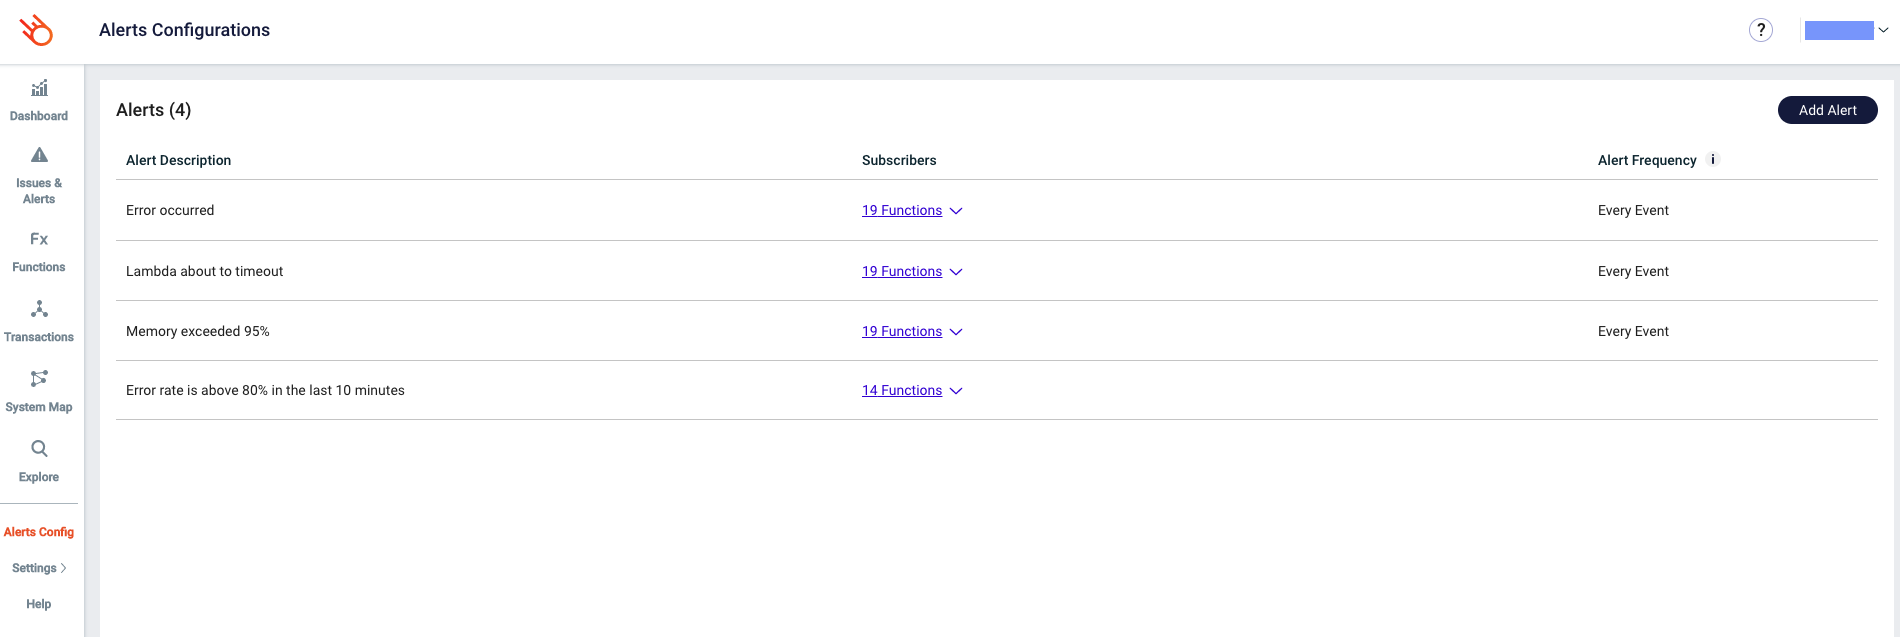
From here we can add alerts or edit existing alerts, the view should be pretty similar in both cases. Let’s open or create an alert.
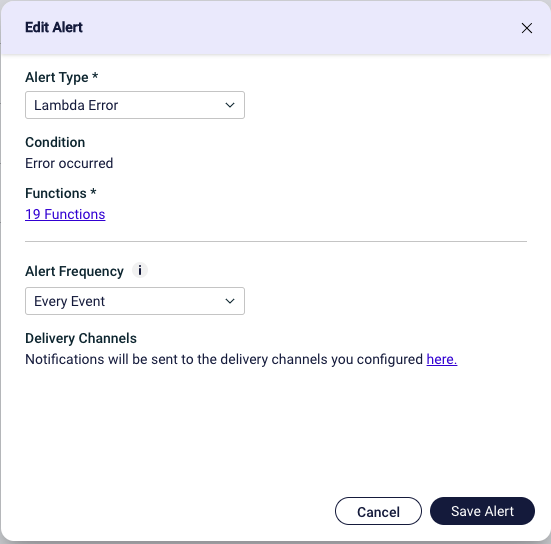
Here we can choose which Alert Type we want and for which function the alert should be configured. We can even choose only to get one alert each hour or day in case we’d like to limit the notifications we’ll be getting. When that’s done we still need to set up where our alarms need to go, we can simply click on the link in the Delivery Channels field.
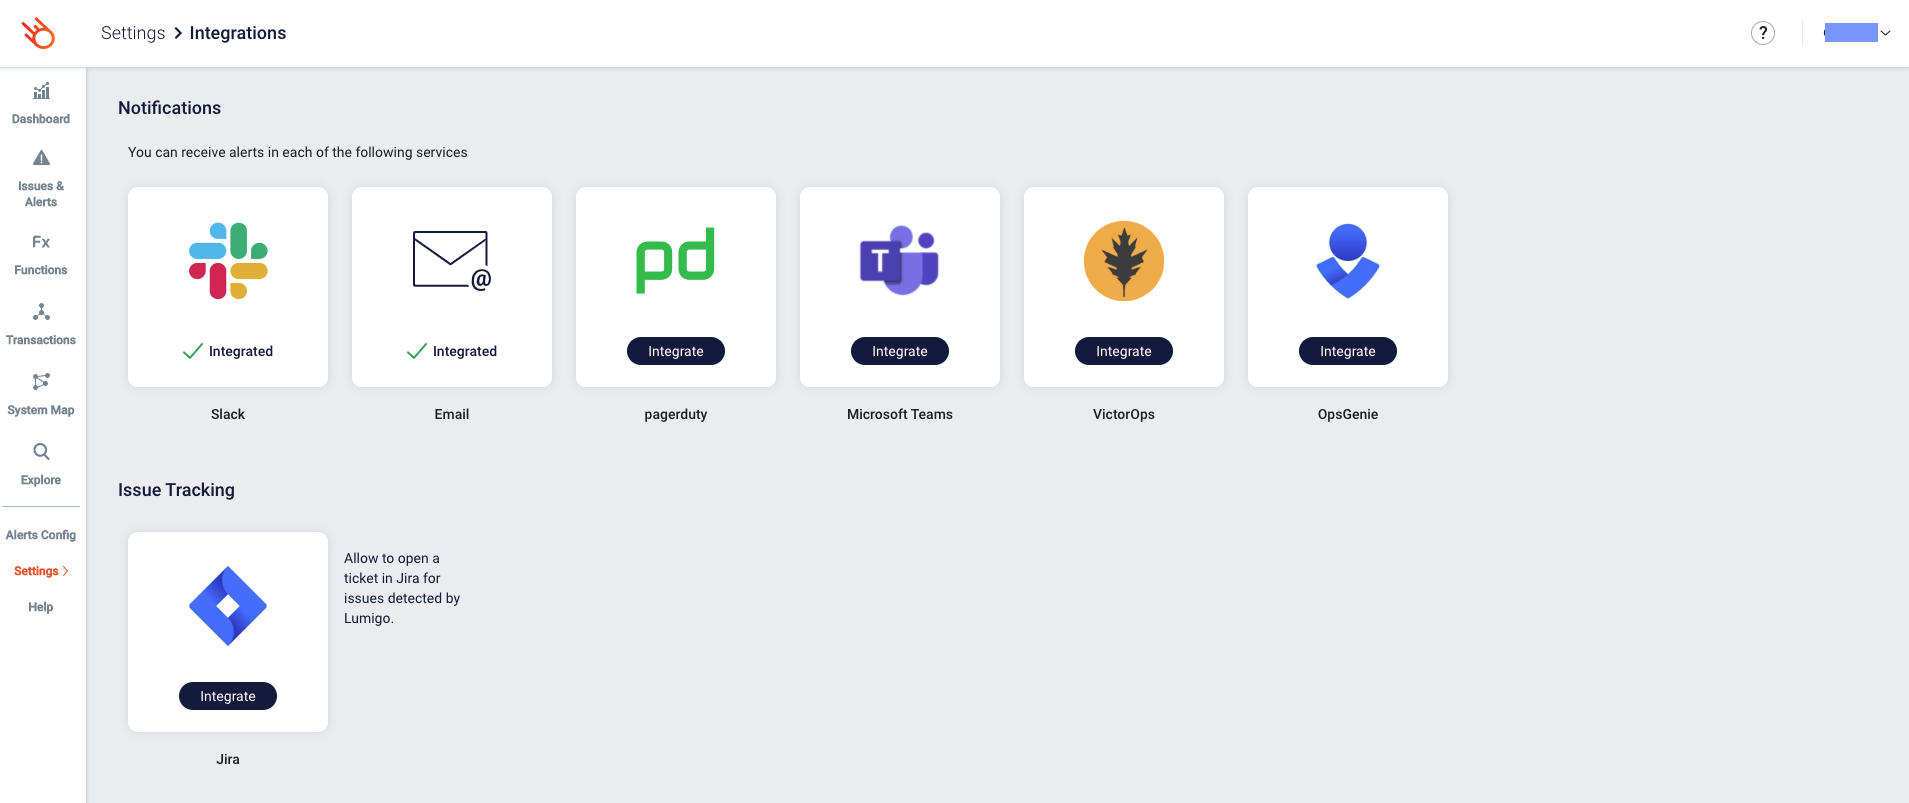
Here you can choose which integrations you want to enable and configure them. And with that done, your next error will be delivered to you using your preferred channels. For more info on alerts, check the documentation.
Using Lumigo
We got the set-up out of the way, awesome! Now we can open the Lumigo console and see what we can do with it as a monitoring platform. The best way to see what we can do would be to use our application and see what’s happening. Let’s say we want to delete a user with the id “delete-me-now”, we simply send a delete request with the id in the path.
DELETE https://{{host}}/api/user/delete-me-now
The request has been sent! Time to open Lumigo, let’s start with the dashboard.
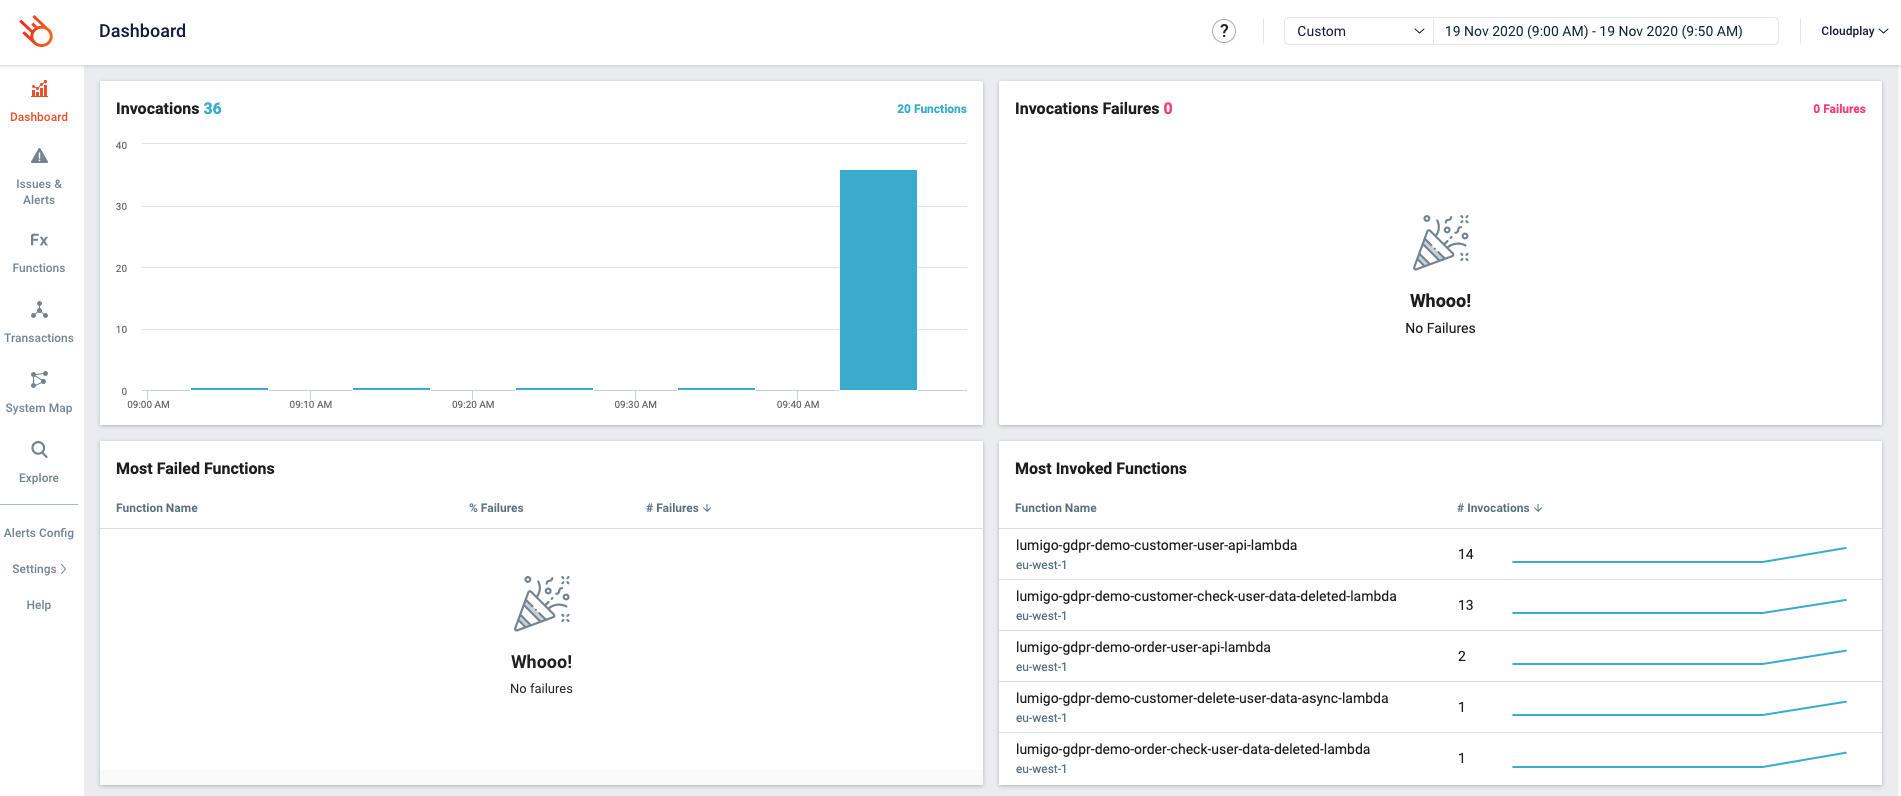
The dashboard gives us an overview of the number of invocations that we have across our landscape in a specific timeframe. We can also see which functions are most invoked, which functions had a cold start, an estimation of the cost, etc. Out of the box, this is already some powerful functionality. Especially if you know that all we did so far was adding a layer and some configuration.
But we want to know more! We need more specific information about how the request we just sent went. We’ll go to the transactions view for that.

Here we can see what transactions just occurred in our system. This already gives us an idea about how long some transactions ran and whether they succeeded or not. We’ll click on the first one because we’d like to know more about it.
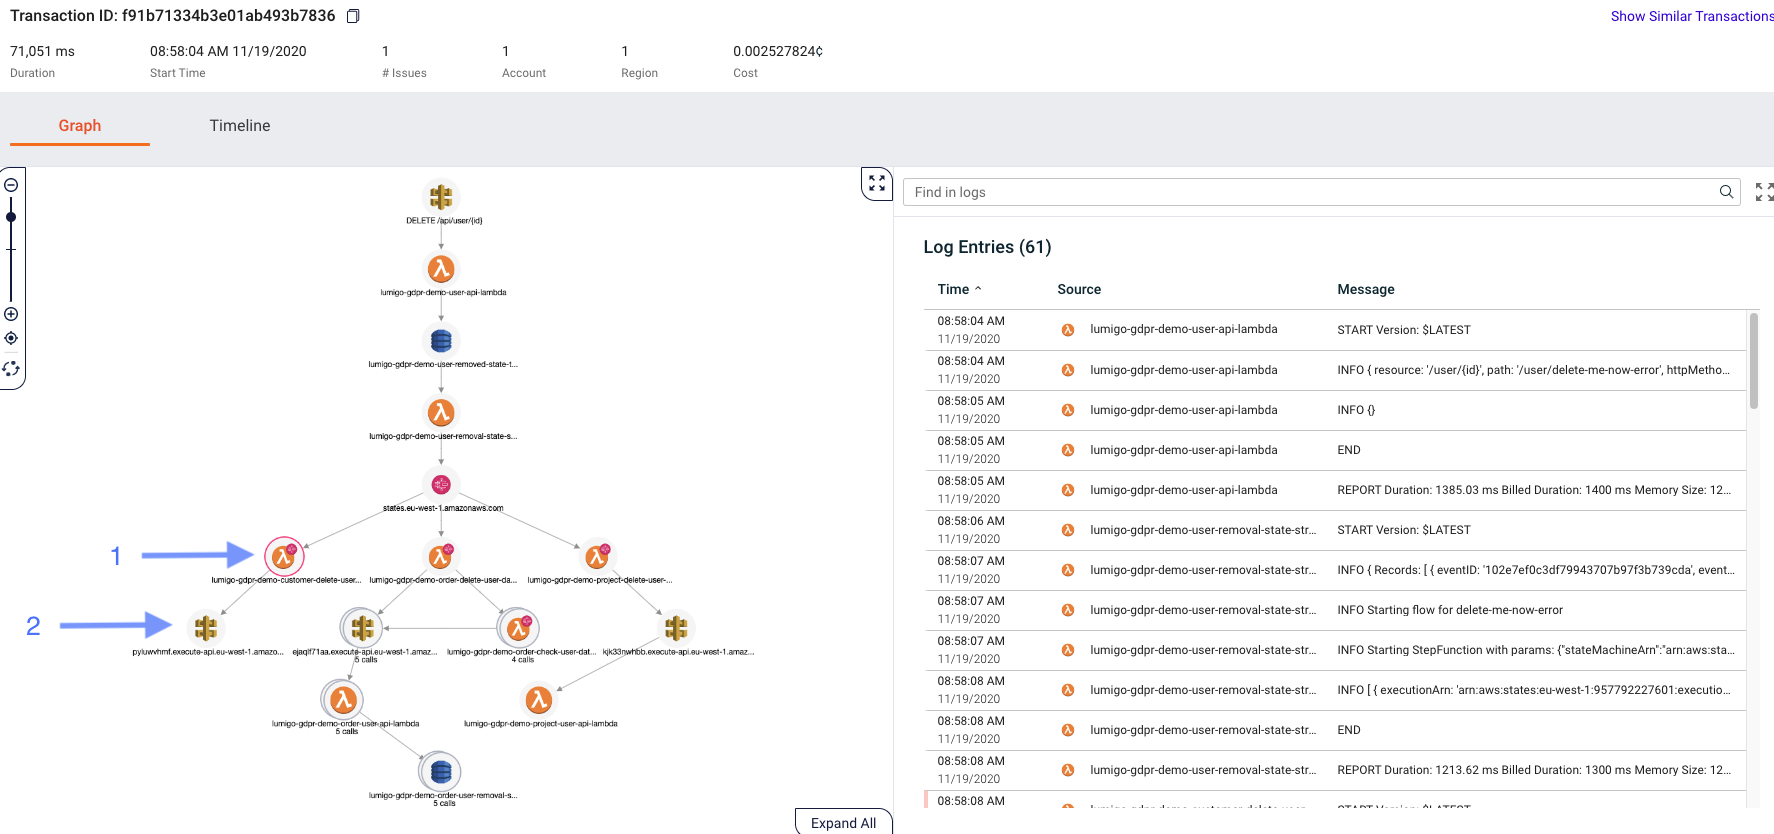
We can see now that our API request saved an item in DynamoDB triggering a Lambda, which started a Step function, and we can even see the number of times a given function was invoked. On the right, we can finally see what we wanted: all the logs across all the Lambda functions that ran inside this specific transaction, ordered by time, and easily filtered.
This is a good start, but we need to know even more- we want to know which response the delete request for the order data received. Let’s click on the API icon.
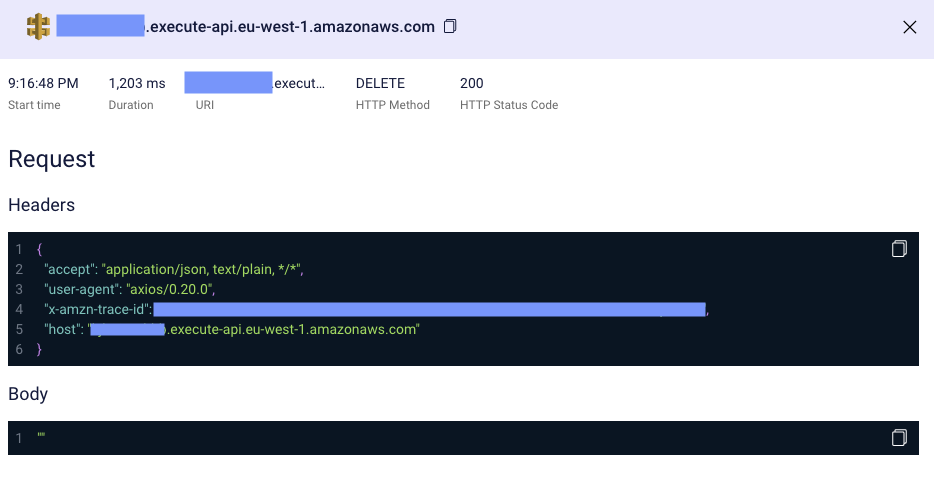
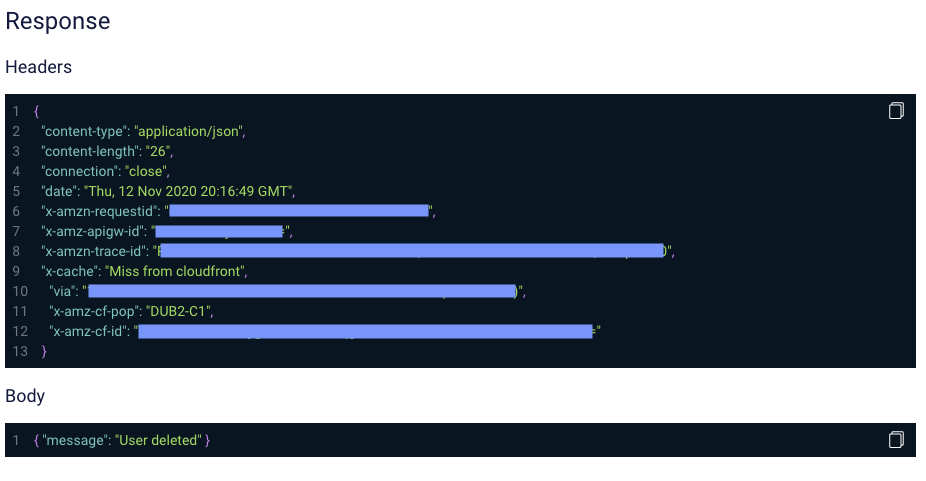
Here we can see the request duration, response code, request and response headers, request-response body, and more. This should be all the information we need to find out why something went south in the system.
Speaking of going south, remember those alerts we talked about earlier. I just got an email and a slack notification.
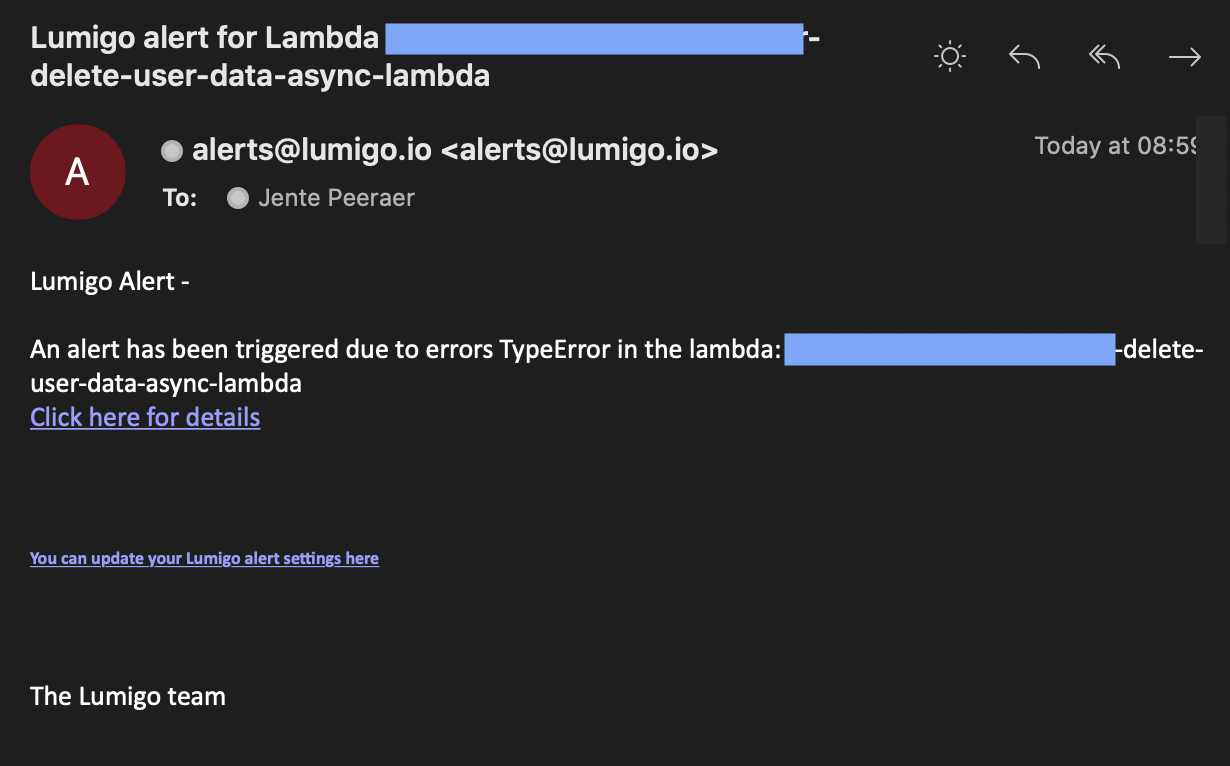
It seems like there’s an issue in our system. Let’s click on the link and find out what went wrong here.

The link takes us to the transaction overview of the erroneous flow. Here we can easily identify the failing function (with the red circle) (1) and we can see the logs on the right side to see what went wrong. Clicking on (1) also gives us information about the issue in this case as shown below.
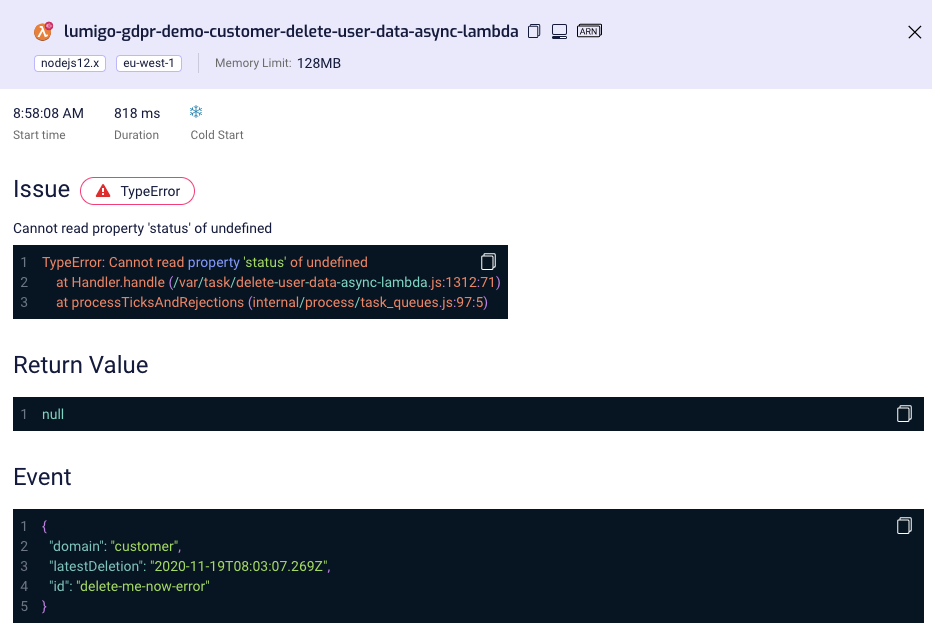
Now we already got deep into troubleshooting: this error indicates that the response from the request was undefined. Weird! Without a strong troubleshooting tool, like Lumigo, finding the root cause might have been a huge time-consumer. Fortunately, we can easily check the call and all its parameters by clicking the AWS API Gateway icon.
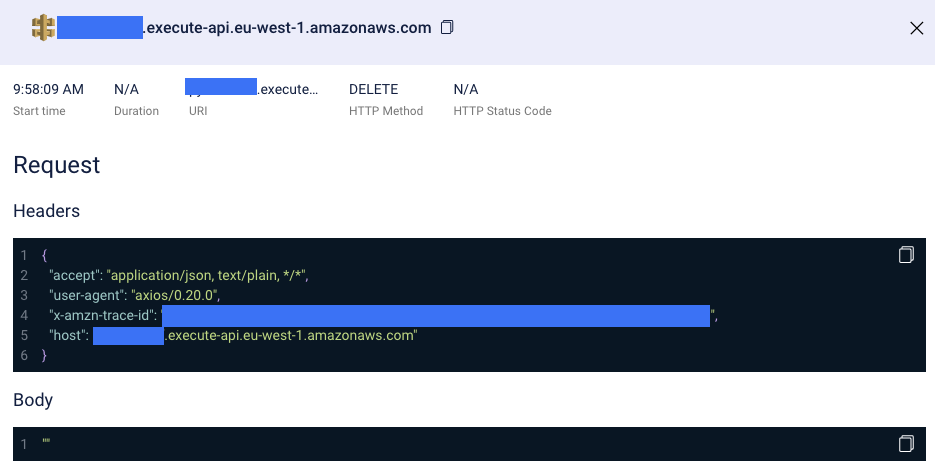
Immediately we find the problem: There is no response to this call because this is the wrong API URL! It looks like someone updated the domain name of the external system without checking it properly. Correcting the domain name resolves the issue, and we’re done! Debugging as fast as 3 clicks! Issue solved!
Conclusion
The GDPR guidelines and in our case the “right to be forgotten”, can have a tremendous impact on businesses and the data they have about their users. Failing to meet the deletion policy can amount to enormous fines from the European Union.
By leveraging the power of the cloud and serverless event-driven architectures, you can quickly and cost-effectively deploy a solution that can coordinate the removal of the required data throughout your domains.
To make sure the application is working as intended, we integrated Lumigo as a monitoring and troubleshooting tool. Lumigo works for us in the background, and abstracts all the monitoring, logging, and alerting code/configuration away. Moreover, we get a strong troubleshooting suite to quickly overcome any emerging issue. This allows us to focus on what’s important, getting that user data out of our systems before the European Union starts to knock down our doors.
Want to learn more? Watch our recorded webinar
Lumigo and Cloudway presented a joint webinar on this topic on Thursday, December 10, 2020. You can now watch the recording:

