


What is Lumigo’s Transaction Timeline?
Lumigo’s Transaction Timeline lets you see in a glance the flow of a transaction across its components and the latency caused by each, allowing you to easily identify bottlenecks and issues.
What problem does it solve?
Distributed tracing is a popular method for monitoring and profiling transactions in a microservices architecture. It’s what developers use to pinpoint failures, performance drops and other problems.
The issue with microservices is that they are usually going to increase the complexity of your system because you are going to use a large array of independent, self-contained modules that do not have a single error log or come with an easy debugging solution.
On top of all that, AWS Lambda adds another level of complexity as the containers are stateless, ephemeral, and highly dynamic. It’s difficult to gain insight into what’s going on.
This is where Lumigo comes into play. With Lumigo you can track down your transactions as requests swing from one Lambda to another, as well as other AWS services such as DynamoDB, API Gateway and SNS, as well as third-party APIs, such as Stripe or Twilio. Normally such transactions would leave little to no traces behind them, as every function will disappear after executing its bit of code.
Lumigo’s Transaction View
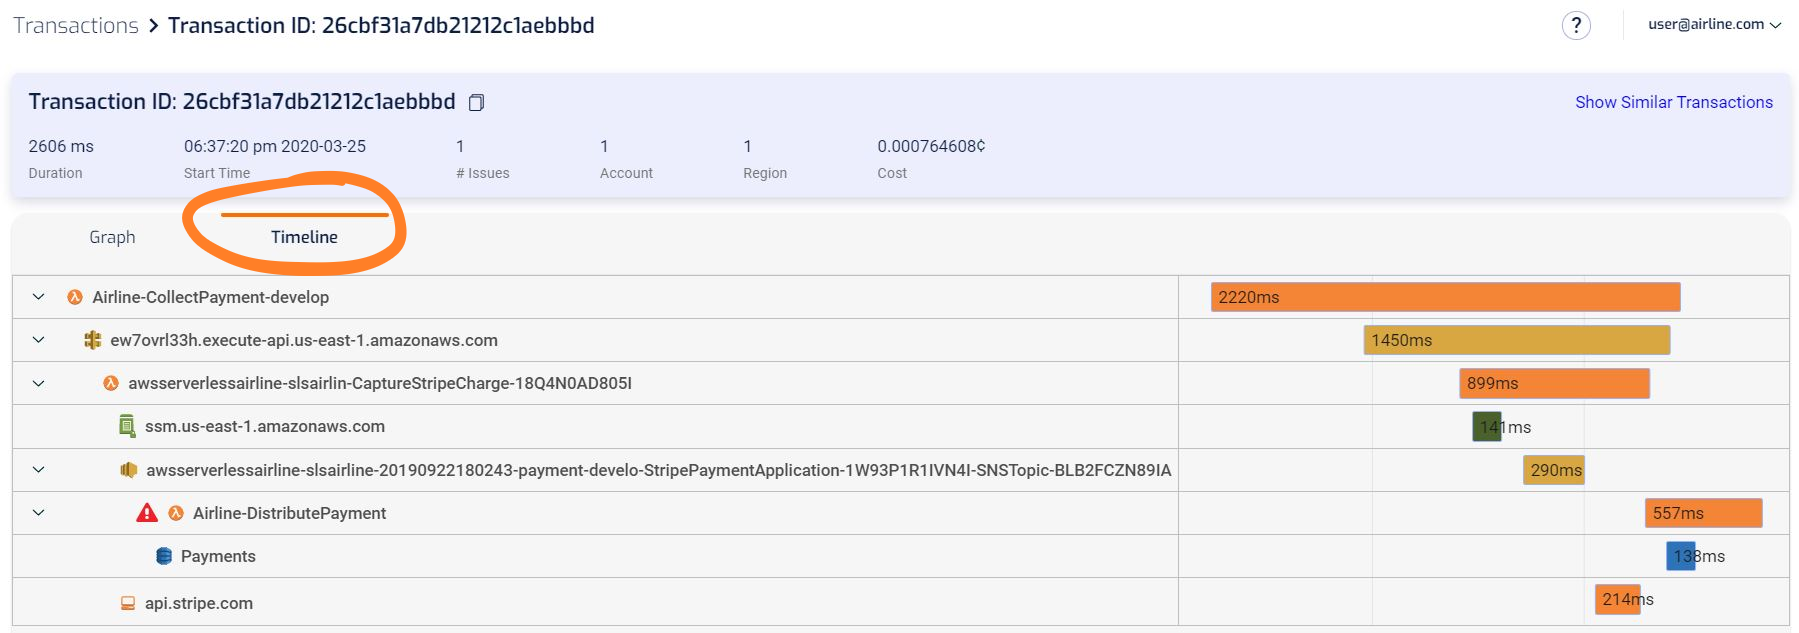
With Lumigo’s transaction view you can map out a transaction timeline that will describe the relationship between your services and display the details of their interactions. It’s very similar to water charts but the main difference is that the list you see on the right represents actual resources that your request used to get from point A to B.
Imagine a simple add-to-cart action triggered by a user. On the timeline, you’ll see the Lambda it first triggered and all the other resources the add-to-cart microservice has, the API Gateway calls that will exchange information to a DynamoDB (If the cart has a server sync feature), and maybe a call to S3 to get an asset, such as an icon. This goes on until you have a complete representation of the transaction on screen.
Using this view you’ll also get all the particular details of the entire process, including the time each request takes and the execution time of each resource in the chain. You’ll then have an easy way to identify bottlenecks and know what you need to do to improve.
The total cost of your transactions will also be displayed on top of your screen, giving you a better overall cost breakdown of all your services.
What next?
The Lumigo Transaction Timeline, and all the other great features we have to offer, are available right now and you can start using them for free. The setup process is a breeze thanks to our onboarding wizard, you’ll be on your way to an observable serverless stack in less than 5 minutes.