


Back in 2020, we covered the launch of Lambda Extensions and the subsequent release of the Lambda Logs API. These features aren’t designed for the average Lambda user. But they allow vendors to build better tools by giving them much-needed access to the Lambda execution environment.
Lumigo, for instance, released and open-sourced the lambda-telemetry-shipper extension. It lets you ship your Lambda logs to an S3 bucket without writing any custom code. If you’re using 3rd party log aggregation tools then this can simplify the process of forwarding all of your Lambda logs. If you prefer to only use a third-party log aggregation tool to collect Lambda logs, you can disable sending logs to AWS CloudWatch by disabling your Lambda functions’ IAM write permissions to CloudWatch Logs.
However, even if you’re using a third-party tool, you do not have a way to directly collect traces and metrics related to Lambda platform events and lifecycle. You may need to find workarounds to forward the data to the third-party tool, including using custom libraries.
That changes today with the new Lambda Telemetry API.
What is the Telemetry API?
The Telemetry API works exactly like the Logs API. In fact, it supersedes and replaces the Logs API even though the Logs API would continue to exist to maintain backward compatibility.
Essentially, it’s a local API endpoint that Lambda extensions can subscribe to receive telemetry data. Once subscribed, the extension would receive:
- function logs
- extension logs
- events (e.g.
INIT,INVOKEandSHUTDOWN) - metrics
- traces*
(* The traces are emitted by the Lambda service and does not follow the X-Ray trace segment structure.)
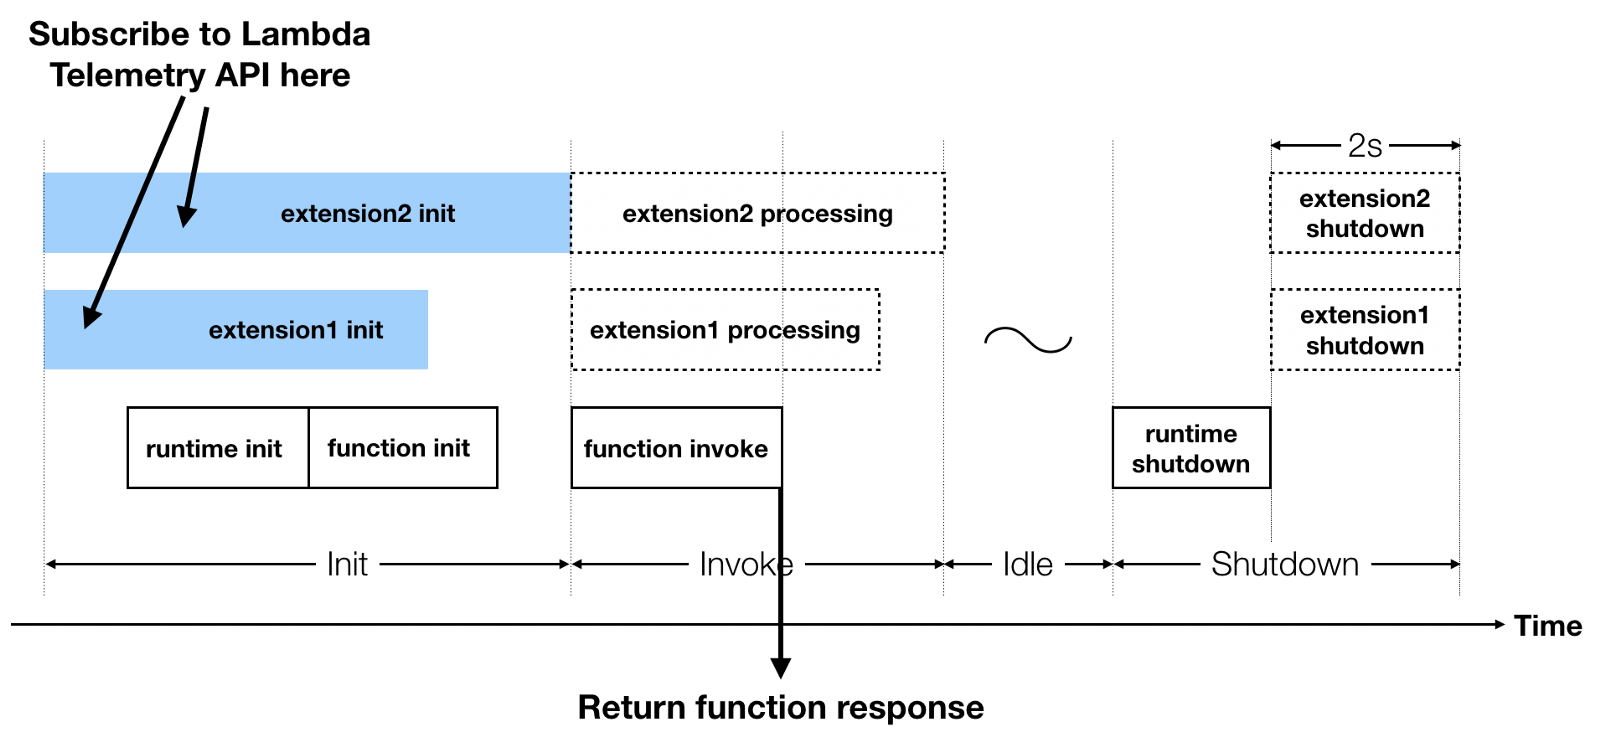
At the end of each invocation, Lambda extensions are able to run (until the configured timeout value) after your function code finishes. Keeping in mind that during the Shutdown phase of the function lifecycle, extensions can run for up to 2 seconds.
Thanks to the “early return” feature introduced in 2021 (which you can read about here), this extra latency is not user-facing. Because when your function code finishes, its response is returned to the caller right away. So if this is a Lambda function behind API Gateway, the API caller would receive its HTTP response early even if an extension is executing.
This background processing time is still billable, but thankfully it doesn’t negatively impact user experience.
What can you do with the Telemetry API?
As mentioned earlier, the Logs API lets you collect logs directly from Lambda and send them to the solution of your choice. With the Telemetry API, you can also collect platform traces and new performance metrics directly from Lambda.
For example, if you’re working with a vendor that supports Open Telemetry then you can use Lambda Extensions and the Telemetry API to convert Lambda metrics and traces to Open Telemetry format and send them to the vendor directly.
In addition, the Telemetry API provides a number of additional events that provide insight into the state of the Lambda execution lifecycle.
For instance, the platform.runtimeDone event tells you when the Lambda invocation is completed. You can see an example of this below.
{
  'time': '2022-10-20T11:46:47.161Z',
  'type': 'platform.runtimeDone',
  'record': {
    'requestId': '9901f754-7cf6-4c9e-a0b6-a6a5a7ed7e84',
    'status': 'timeout',
    'metrics': {
      'durationMs': 3003.0,
      'producedBytes': 0
    }
  }
}
From the status attribute we can find out the invocation has timed out after 3 seconds. This is a much better way to detect Lambda timeouts than looking for the Task timed out after X seconds log message.
Auto-capture Lambda timeouts as a CloudWatch metric
As a launch partner for Telemetry API, we’ve updated the aforementioned lambda-telemetry-shipper extension to make it easy for you to detect Lambda timeouts.
As I’ve written previously, Lambda timeouts can be tricky to detect because:
- There are no metrics for Timeout errors; they are rolled into the generic Error metric.
- There are no application errors in the logs. So if you’re looking for corresponding error log messages to explain a sudden spike in errors, you won’t find them.
With this update, the lambda-telemetry-shipper extension would be able to detect when a function times out and can emit a custom CloudWatch Metric when it does. This is an opt-in feature, to enable it, you simply set an environment variable LUMIGO_EXTENSION_TIMEOUT_TARGET_METRIC to tell the extension what you want the metric to be called.
This extension is available in all AWS regions, and can be installed via our Lambda layer. The ARN of the layer is arn:aws:lambda:<region>:723663554526:layer:lumigo-telemetry-shipper:1.
Call to action
But did you know Lumigo has built-in support for detecting and alerting you when Lambda invocations time out? And it does so much more than that and is in my opinion the best way to gain observability into complex serverless applications and troubleshoot them.
To give it a try, you can sign up for free at lumigo.io.