


Observability is a measure of how well the internal state of a system can be inferred from its external outputs. It helps us understand what is happening in our application and troubleshoot problems when they arise. It’s an essential part of running production workloads and providing a reliable service that attracts and retains satisfied customers. It is even more important when it comes to serverless because we rely on managed services that we can’t simply “run on your machine”.
In my work as a consultant, many clients ask me about how to build observability into their serverless applications. If it’s better to build a custom solution using the native AWS services or to pay for a 3rd-party service such as Lumigo.
AWS offers a range of services that helps you build observability into your serverless application, such as CloudWatch, CloudWatch Logs and X-Ray. These services cater for your basic needs cheaply, but they lack the premium developer experience that specialized vendors such as Lumigo can offer.
For example, when compared with X-Ray, Lumigo offers a significantly better developer experience, including:
- Lumigo has 1 click auth-tracing with no manual code change. X-Ray requires code change to instrument the AWS SDK and HTTP clients in order to trace outbound requests from Lambda to other HTTP services.
- Lumigo captures a lot more contextual information, including the request and response body for every outbound HTTP request. X-Ray captures only a limited amount of metadata about the requests (latency, status code, etc.) but not the request and response bodies. To capture these additional data points, you have to enrich the X-Ray trace segments yourself.
- Lumigo always shows the Lambda logs as part of the transaction. X-Ray does not.
- Lumigo’s issues page lets you quickly identify problems in your application. With X-Ray, you have to write custom queries for each type of issue in order to find problems.
- Lumigo supports a wide range of async event sources for Lambda, including S3, SNS, SQS, EventBridge, Kinesis Data Streams and DynamoDB Streams. X-Ray doesn’t trace Lambda invocations through Kinesis and DynamoDB streams.
- Lumigo lets you search data over a 14-day time window. X-Ray only lets you search data across a 6-hour window.
- Lumigo supports free-text search on any data that Lumigo collects. X-Ray does not.
- Lumigo has built-in alerting and integrates with popular tools such as Slack, PagerDuty and OpsGenie. X-Ray does not.
- Lumigo supports multiple regions and multiple accounts. X-Ray is limited to a single region in a single AWS account.
While the native AWS services have plenty of limitations and don’t offer the best developer experience out-of-the-box, you can work around these and still create a solution that gives you a lot of observability into your serverless application. For example:
- To lessen the burden of instrumentation for X-Ray, you can create reusable libraries/modules that wrap the AWS SDK and HTTP clients and instrument them for X-Ray.
- You can log the invocation event at the start of each Lambda function.
- To gain more insight into the communication between your Lambda functions and other services, you can write custom logs to capture the request and response bodies. Or you can enrich the X-Ray segments with custom metadata.
- You can extract and forward correlation IDs across SQS, Kinesis and DynamoDB streams so you can correlate log messages for all the Lambda functions that are part of a transaction.
- You can forward logs from CloudWatch Logs to an ELK (ElasticSearch, LogStash, Kibana) stack so you can search logs from different regions and AWS accounts.
All of these are doable but they take a significant amount of engineering time and often require coordination and agreement between different parts of the organization. Teams have to follow the same conventions such as log message format and the approach towards correlation IDs (their format, and how to propagate them) for the solution to work.
If the build vs buy decision is purely based on capabilities and what will make your developers more productive, then I think the most sensible approach is to use a 3rd party service that ticks most of your boxes and supplement them with the AWS services. This is the approach I have used in all of my recent projects and it has allowed me to focus on solving the client’s business challenges and deliver the desired outcomes on time and on budget.
In my projects, I use Lumigo as the main entry point when I try to understand what’s going on in my application and to troubleshoot issues. I seldom write custom log messages anymore because Lumigo captures most of the information I need to be able to infer the internal state of my applications.
Take the Lumigo dashboard, for instance. It gives me a lot of insights into the activities in my system. I can see at a glance if there is a high number of Lambda invocation errors and if so, which functions are failing. I can see hot spots and identify functions that are invoked frequently, these are good candidates for optimization (e.g. right-sizing the memory setting to reduce cost).

I can see Lambda functions where cold starts are an issue. Lambda functions that have a high frequency of cold starts are also good candidates for Provisioned Concurrency.

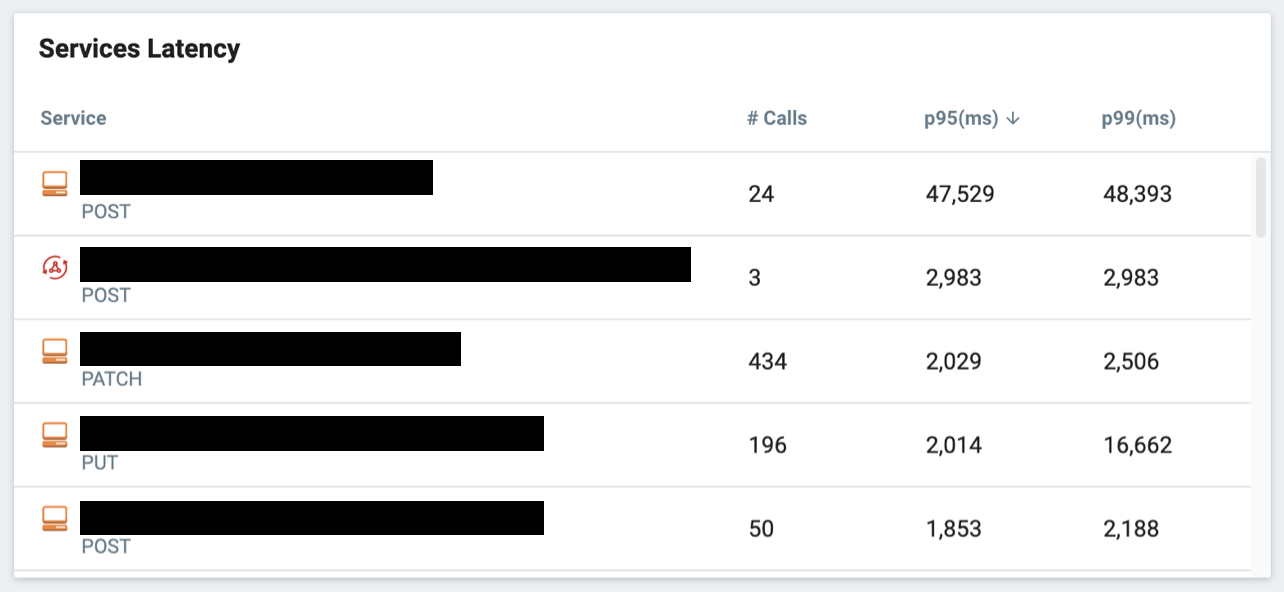
And I can also see which of the services (3rd party APIs, AWS services, or internal APIs) my application depends on are performing poorly.
The dashboard alone saves me hours of engineering time to collect, analyze and visualize this (very useful) information. The information it gives me helps me quickly find and investigate problems that arise in production. Problems that used to take me hours to find can now be identified in minutes!
In fact, when a problem does arise, I would usually receive an alert through Slack or PagerDuty and I will find the problem waiting for me in the Issues page in Lumigo.
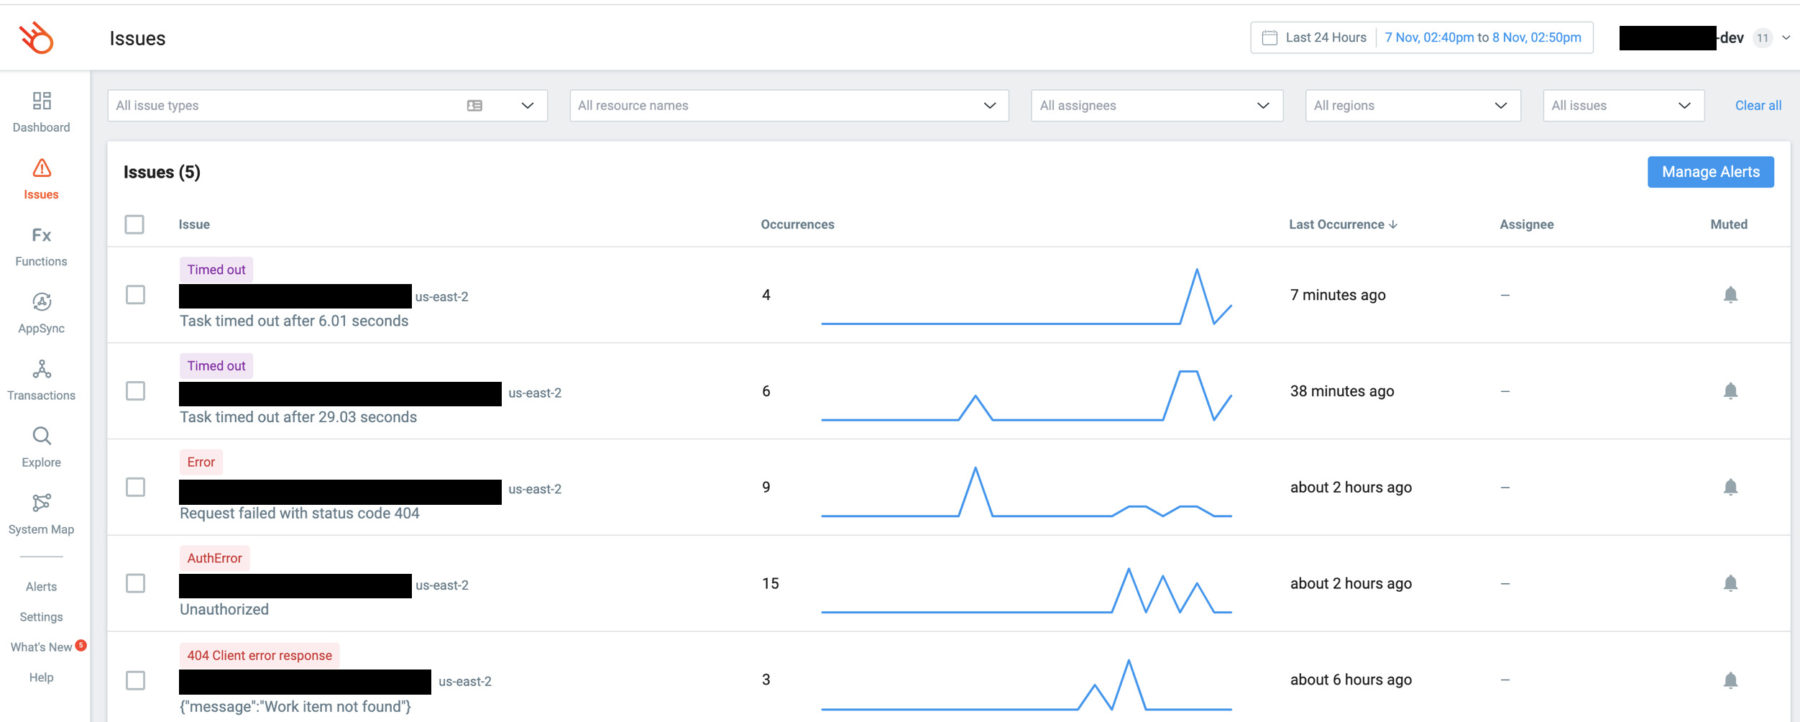
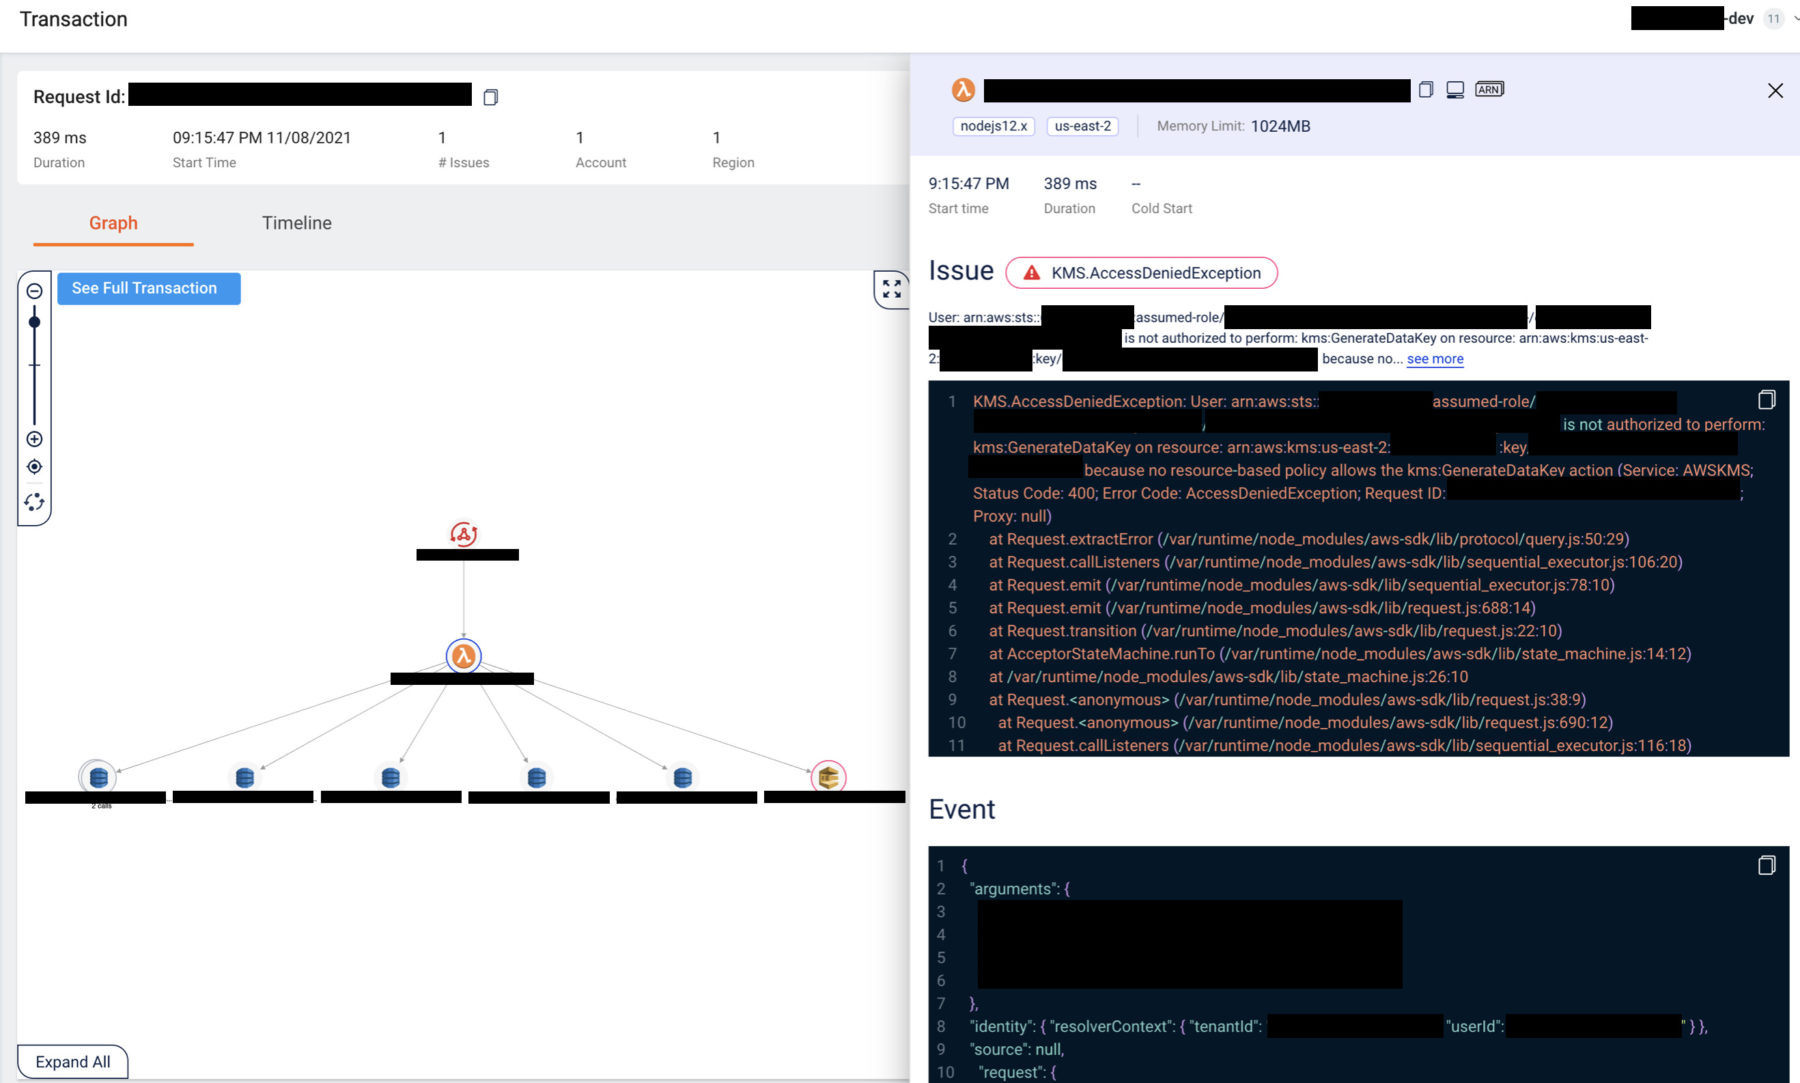
From here, I can navigate to the erroneous transactions and interrogate them. Because every outbound request from the Lambda function is recorded in Lumigo, I can see how long they took and what was said in those communications. Together with the invocation event and the environment variables that were used in the invocation, I can quickly infer the internal state of the function when it was invoked.
As you can see, that gives me a lot of observability and it takes only a few minutes to set up, and I didn’t have to make any changes to my code. Instead, all of my energy and time can be better spent on tackling the problems that actually matter to my clients and deliver value to their businesses. Which is very much aligned with the spirit of serverless – to move away from undifferentiated heavy-lifting and use the most precious resources we have (engineering time) to solve the most valuable problems.
Building custom solutions to solve the problem of serverless observability is fun and it can be challenging in the best possible way! But they are also not what differentiates your business from your competitors.
Observability is an essential part of running a production application, and the good news is that with platforms like Lumigo, observability for serverless applications is easier than you think.
To learn more about how to overcome common challenges with building production-grade serverless applications, join us on our next webinar on Friday, 19th November.
I will be speaking alongside Ryan Jones, the founder of ServerlessGuru, and share many of the lessons that we have learnt running serverless applications in production over the last few years.
Hope to see you there!
If you wanna try out Lumigo, it also has a generous free tier (no expiration) that lets you trace 150k Lambda invocations per month, for free. Sign up now.