Aug 12 2020

Some time ago, an ex-colleague of mine at DAZN received an alert through PagerDuty. There was a spike in error rate for one of the Lambda functions his team looks after. He jumped onto the AWS console right away and confirmed that there was indeed a problem. The next logical step was to check the logs to see what the problem was. But he found nothing.
And so began an hour-long ghost hunt to find clues as to what was failing and why there were no error messages. He was growingly ever more frustrated as he was getting nowhere. Was the log collection broken? Were the errors misreported? Is there a problem with CloudWatch or DataDog?
It was at that point, another teammate noticed the function’s Max Duration metric had flatlined at 6 secs around the same time as the spike in errors.
“Could the function have timed out?”
“Ahh, of course! That must be it!”
Once they realized the problem was timeouts, they were able to find those Tasks timed out after 6.00 seconds error messages in the logs.
If you have worked with Lambda for some time then this might be a familiar story. Unfortunately, when a Lambda function times out, it’s one of the trickier problems to debug because:
- Lambda does not report a separate error metric for timeouts, so timeout errors are bundled with other generic errors.
- Lambda functions often have to perform multiple IO operations during an invocation, so there is more than one potential culprit.
- You’re entirely relying on the absence of a signpost to tell you that the function timed out waiting for something to finish, which requires a lot of discipline to signpost the start and end of every operation consistently.
In this post, I’ll explore a few ways to debug Lambda timeouts. I hosted a live webinar about this topic on August 19, 2020. You can watch it here.
Detect timeouts
The story I shared with you earlier illustrates the 1st challenge with Lambda timeouts — that it can be tricky to identify. Here are a couple of ways that can help you spot Lambda timeouts quickly.
Look at Max Duration
As I mentioned before, the biggest telltale sign of timeout is by looking at a function’s Max Duration metric. If it flatlines like this and coincides with a rise in Error count then the invocations likely timed out.

Look out for “Task timed out after”
As the problem is that Lambda does not report a separate Timeout metric, you can make your own with metric filters. Use the pattern Task timed out after against a Lambda function’s log group and you can create a count metric for timeouts.
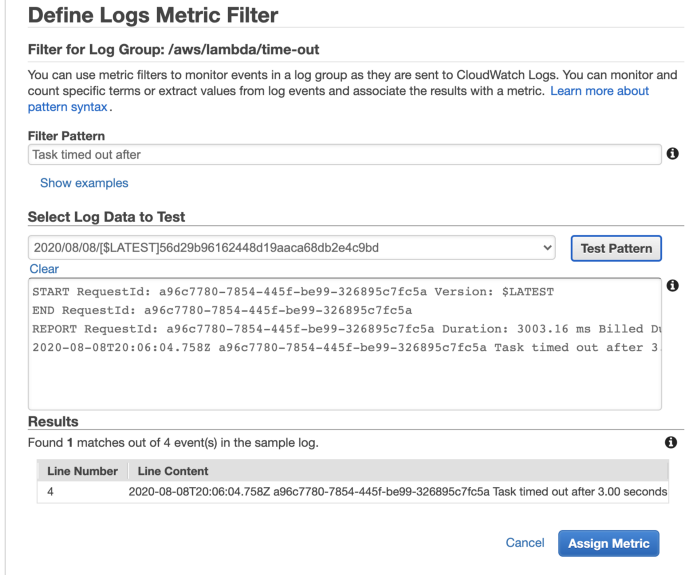
This approach is easy to implement but hard to scale with the number of functions. You will need to do this for every function you create.
You can automate this using an EventBridge rule that triggers a Lambda function every time a new CloudWatch log group is created.
source:
   - aws.logs
detail-type:
   - AWS API Call via CloudTrail
detail:
   eventSource:
      - logs.amazonaws.com
   eventName:
      - CreateLogGroup
The Lambda function can create the metric filter programmatically for any log group that starts with the prefix /aws/lambda/ (every Lambda function’s log group starts with this prefix).
Log an error message just before function times out
Many teams would write structured logs in their Lambda function, and set up centralized logging so they can search all their Lambda logs in one convenient place. The log aggregation platform is where they would most likely start their debugging efforts.
When an invocation times out, we don’t have a way to run custom code. We can’t log an error message that tells us that the function has timed out and leave ourselves some context around what it was doing when it timed out. This negates the effort we put into writing useful logs and to centralize them in one place. It’s the reason why my former colleague wasn’t able to identify those errors as timeouts.
So if you can’t run custom code when the function has timed out, then how about running some custom code JUST BEFORE the function times out?
This is how a 3rd-party service such as Lumigo is able to detect timeouts in real-time. You can apply the same technique using middleware engines such as Middy. In fact, the dazn-lambda-powertools has a built-in log-timeout middleware that does exactly this. When you use the dazn-lambda-powertools, you also benefit from other middlewares and utility libraries that make logging and forwarding correlation ID effortless.
Use 3rd-party tools such as Lumigo
Many 3rd-party tools can detect Lambda timeouts in realtime. Lumigo, for instance, would highlight them on the Issues page.

From here, you can drill into the function’s details and see its recent invocations, check its metrics and search its logs.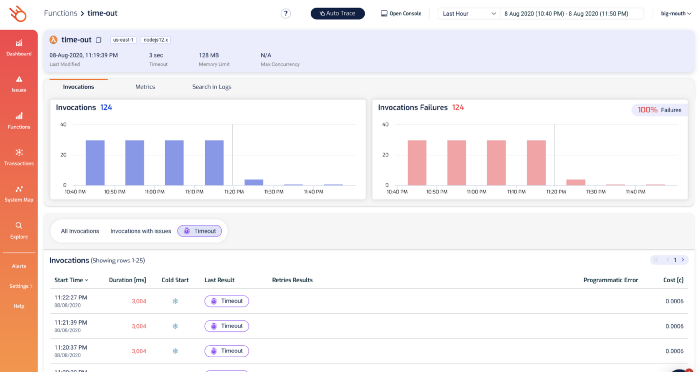
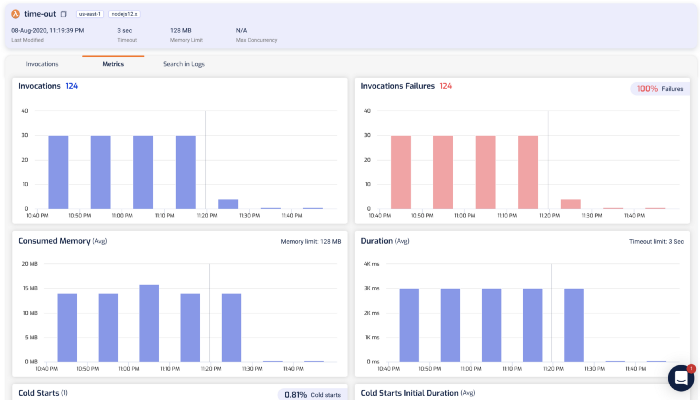
Of course, you can also drill into individual invocations to see what happened.
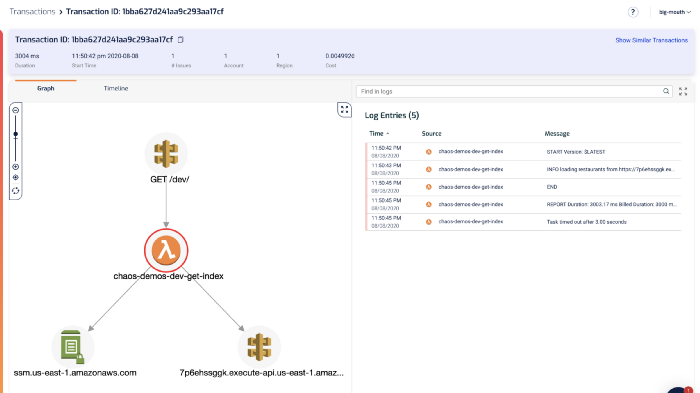
From the log messages on the right, we can see the dreaded Task timed out after 3.00 seconds error message.
The last log message we saw before that was loading restaurants from https://…. That’s a useful signpost that tells us what the function was doing while it timed out. Which brings us to the 2nd challenge with debugging Lambda timeouts.
Finding the root cause of the timeout
There are many reasons why a function might time out, but the most likely is that it was waiting on an IO operation to complete. Maybe it was waiting on another service (such as DynamoDB or Stripe) to respond.
Within a Lambda invocation, the function might perform multiple IO operations. To find the root cause of the timeout, we need to figure out which operation was the culprit.
Signposting with logs
The easiest thing you can do is to log a pair of START and END messages around every IO operation. For example:
const start = Date.now()
console.log('starting doSomething')
await doSomething()
const end = Date.now()
const latency = end - start
console.log(`doSomething took ${latency}ms`)
This way, when the function times out, we know what the last IO operation that it started but never finished.
While this approach is easy to implement for individual functions, it’s difficult to scale with the number of functions. It requires too much discipline and maintenance and would not scale as our application becomes more complex.
Also, we can only signpost IO operations that are initiated by our code using this approach. Many libraries and wrappers (such as Middy middlewares) can often initiate IO operations too. We don’t have visibility into how long those operations take.
Use X-Ray
If you use the X-Ray SDK to wrap the HTTP and AWS SDK clients, then X-Ray would effectively do the signposting for you.
Every operation you perform through the instrumented AWS SDK client or HTTP client will be traced. When a function times out before receiving a response to an IO operation, the operation will appear as Pending in an X-Ray trace (see below).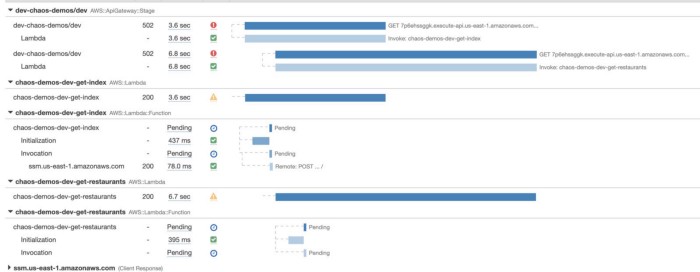
Instrumenting these clients with the X-Ray SDK is far less demanding compared to writing manual log messages.
However, this approach still has a problem with IO operations that are initiated by other libraries. For instance, the function above makes a call to SMS Parameter Store, but it has not been captured because the request was initiated by Middy’s SSM middleware.
Use 3rd party tools such as Lumigo
Lumigo also offers the same timeline view as X-Ray.
From the aforementioned transactions view:

Click on the Timeline tab, and you can see a similar bar graph of what happened during the invocation.

As with X-Ray, we can see that the HTTP request to 7p6ehssggk.execute-api.us-east-1.amazonaws.com never completed (and hence marked as N/A). And therefore it was the reason why this function timed out.
Compared to X-Ray, Lumigo requires no need for manual instrumentation. In fact, if you’re using the Serverless framework, then integrating with Lumigo is as easy as:
- install the
serverless-lumigoplugin - configure the Lumigo token in
serverless.yml
And you get so much more, such as better support for async event sources such as Kinesis and DynamoDB Streams, and the ability to see function logs with the trace segments in one screen. Read my previous post to learn more about how to use Lumigo to debug Lambda performance issues.
Mitigating timeouts
Being able to identify Lambda timeouts and quickly find out the root cause is a great first step to building a more resilient serverless application, but we can do better.
For example, we can use context.getRemainingTimeInMillis() to find out how much time is left in the current invocation and use it to timebox IO operations. This way, instead of letting the function time out, we can reserve some time to perform recovery steps.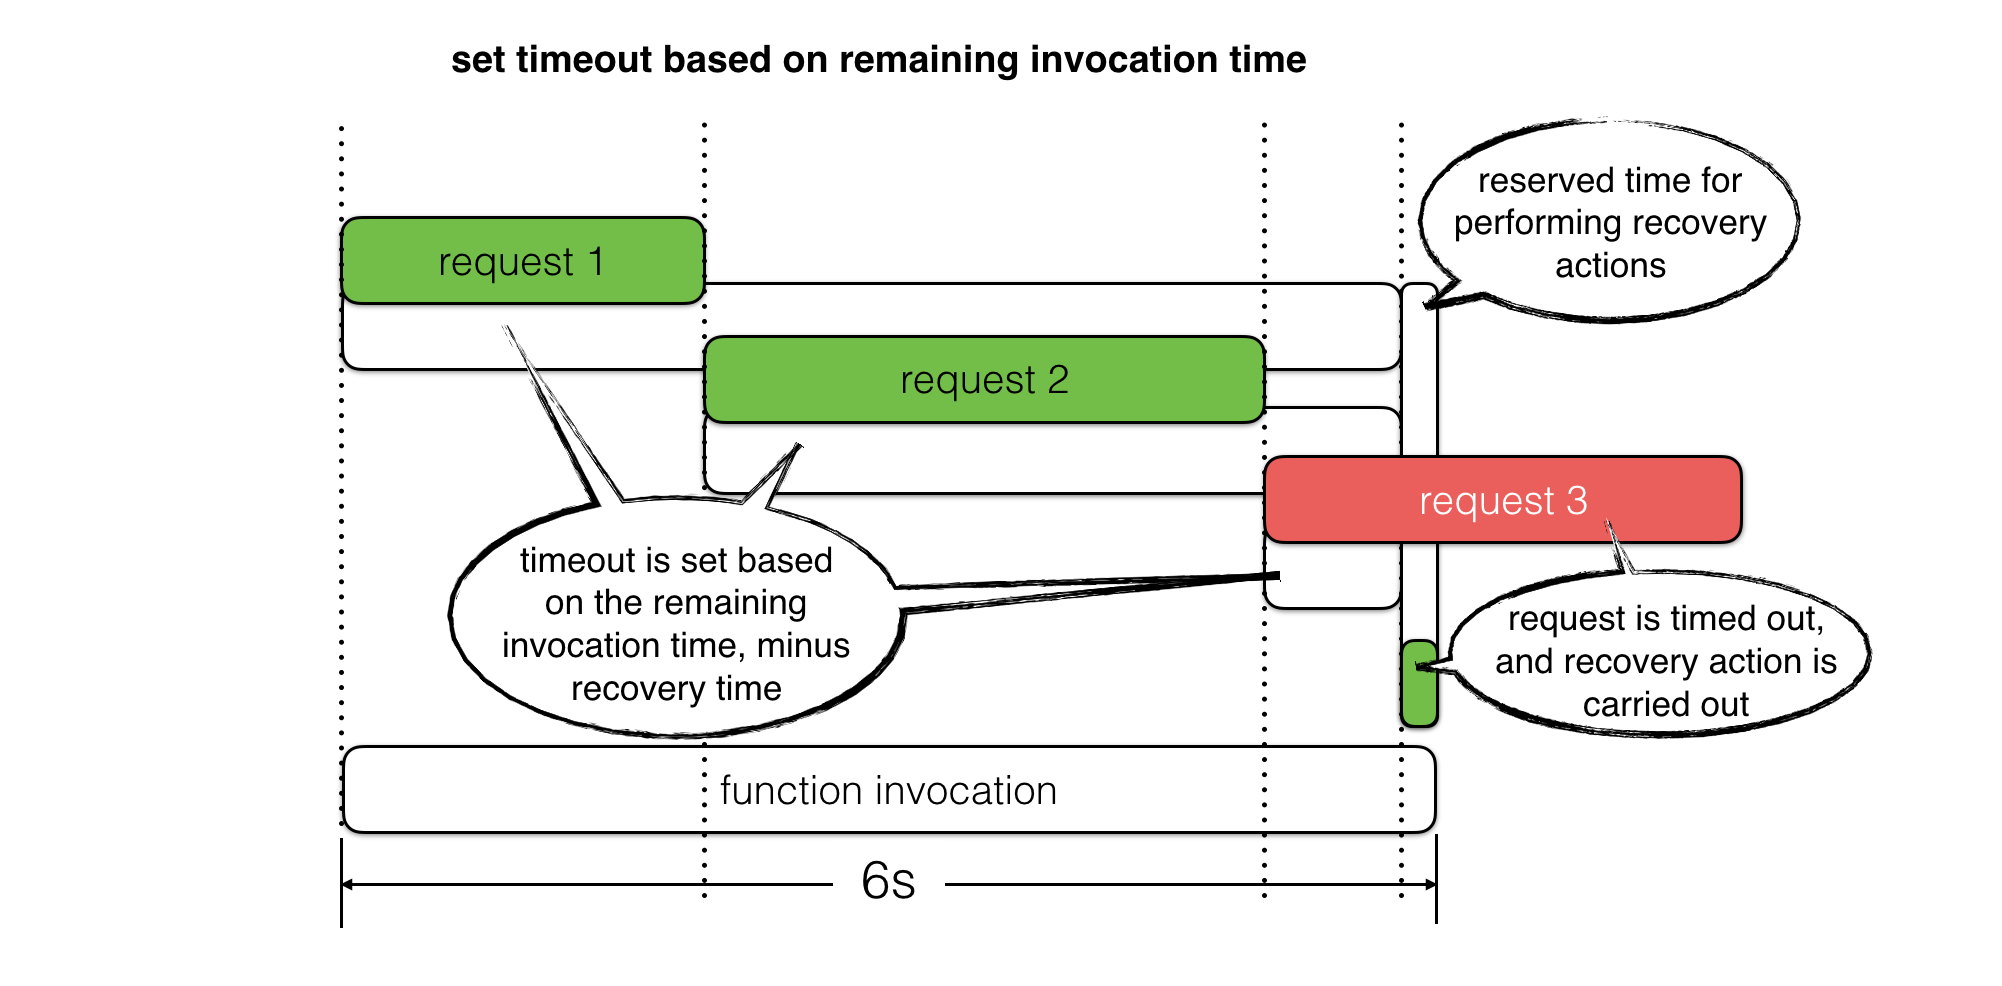
For read operations, we can use fallbacks to return previously cached responses or even a static value as default. For write operations, we can queue up retries where applicable. In both cases, we can use the reserved time to log an error message with as much context as possible and record custom metrics for these timed out operations.
See this post for more details.
To learn more watch the webinar
If you want to learn more about how to debug Lambda timeouts and see the mitigation strategy in action, then please watch my August 19th recorded webinar. In this webinar I demo:
- How to identify Lambda timeouts
- How to find root causes of timeouts
- How to mitigate Lambda timeouts when there are underlying issues
- How to debug timeouts with Lumigo


