Aug 08 2023

As developers, we understand the immense value of having real-time access to live traces. It significantly enhances our ability to identify, debug, and troubleshoot potential issues within applications, streamlining the development and deployment process. Today, we are excited to introduce the new and improved Live Tail feature at Lumigo, which enhances your observability experience to a whole other level.
Our commitment to simplifying developers’ lives drove us to rebuild the Live Tail feature from scratch. As developers ourselves, we not only empathize and understand the challenges you face when troubleshooting and debugging applications, we live it! Therefore, we have invested significant effort in crafting a seamless and robust Live Tail solution that equips you with the necessary tools to help you conquer complex application issues effortlessly.
What is Live Tail and why is it so useful?
The “tail” command has a significant historical background in software development, serving as a useful tool for real-time log file monitoring. In its early days, developers relied on this simple command to track changes in log files and troubleshoot issues effectively. However, with the evolution of technology and the complexity of modern applications, the concept of “Live Tail” has undergone a remarkable transformation as technology infrastructure and the wider industry have evolved.
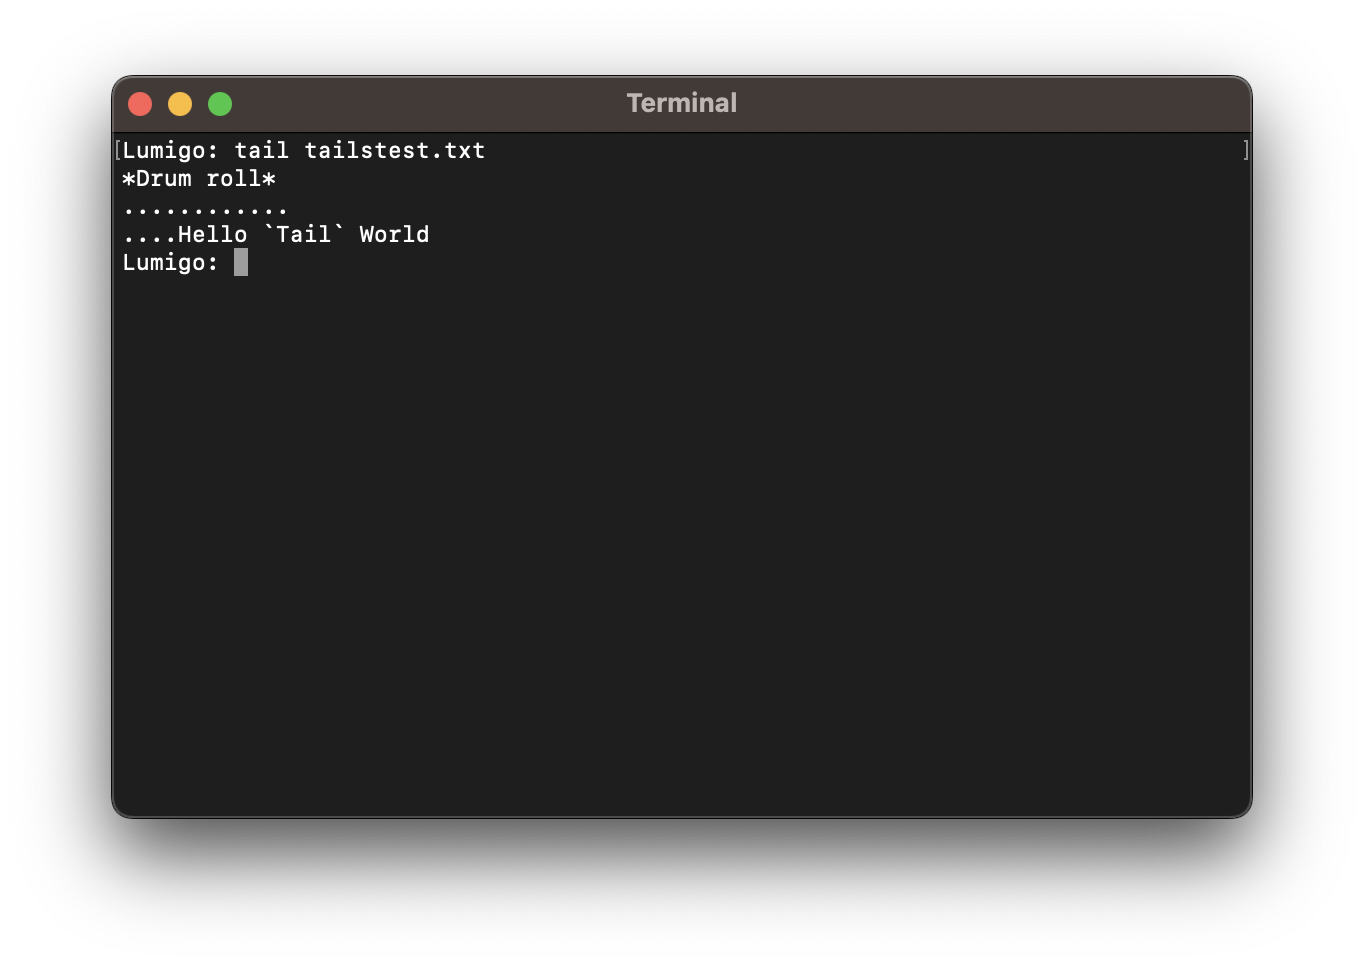
Today, our new Live Tail redesign represents a cutting-edge observability solution that goes beyond traditional log file tracking. It offers real-time streaming of requests and invocations, providing critical insights like exceptions and payload details. Notably, Live Tail at Lumigo spans distributed services for traced invocations, offering a more comprehensive view compared to its predecessor. This means that you can now observe multiple live tail traces simultaneously within a single view, gaining deeper insights into your application’s behavior and performance.
With Lumigo Live Tail, developers have a powerful tool at their disposal, empowering them to detect and resolve issues efficiently across their distributed services. You now gain faster near real-time access to critical information, such as exceptions and payload details. This level of visibility allows you to closely monitor requests and invocations as they happen, giving you unparalleled control over your applications’ performance and behavior. We’ve poured our dedication and expertise into developing and testing this revamped Live Tail, and we’re excited for you to experience its transformative power. Let’s get hands-on and take a look at what’s new and how it works.
Lumigo Live Tail 2.0
Inspired by user insights, our new and improved Live Tail functionality is now a mightier, more approachable ally in the debugging arena. With a user-friendly design that boasts an intuitive interface, a clever autocomplete filter, handy links that pop open in fresh tabs, immediate entry to the Issue Details vista, and a polished UI to boot, this refreshed Live Tail is your ticket to a sleeker, more enjoyable troubleshooting adventure.
Let’s take a closer look at what the new functionality brings.
Faster Navigation and better controls
Unraveling the root causes of your application issues just got a lot simpler with our detailed issue view. Before anything else, let’s highlight the shining star of this feature – the live scrolling view. Here, you’ll find the 50 freshest transactions in all their glory, continuously updating so you never miss a beat.
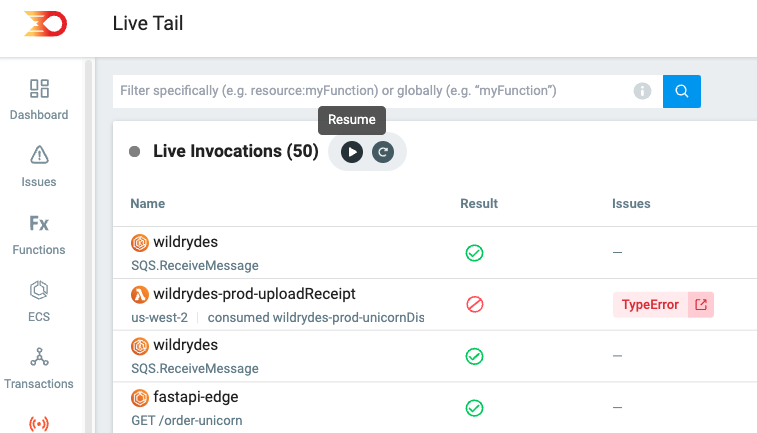
The interactive controls of the live scrolling view make for a remarkably intuitive experience. You’re in command here – pause, resume, clear, and start the feed as per your needs. Whether you’re troubleshooting a minor or major hiccup, we’ve made sure you’ve got everything you need at your fingertips.
Faster Issue Viewing
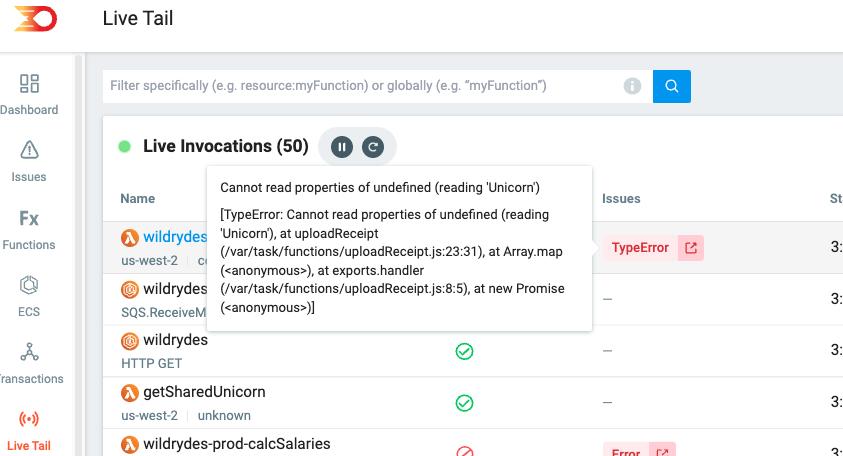
Jumping headfirst into issue resolution is as easy as 1-2-click, and it also comes with a handy preview feature. Each detected problem opens its own new tab just by clicking on the issue button, allowing you to deep dive into the heart of the matter. The beauty of this is, while you’re probing the depth of one problem, you’re never losing sight of your main monitoring dashboard. The ongoing content of your application’s performance stays right where it needs to be – under your vigilant watch.
Payload Details View
Our Payload Details view stands as an oasis of knowledge in your journey to understand your requests and invocations better. One click on an entry is all it takes to open a slide-out panel brimming with a wealth of contextual details about each request. Within this panel, you will find everything you need, from the request and response bodies to headers, triggered events, and even the nitty-gritty of environment variables.
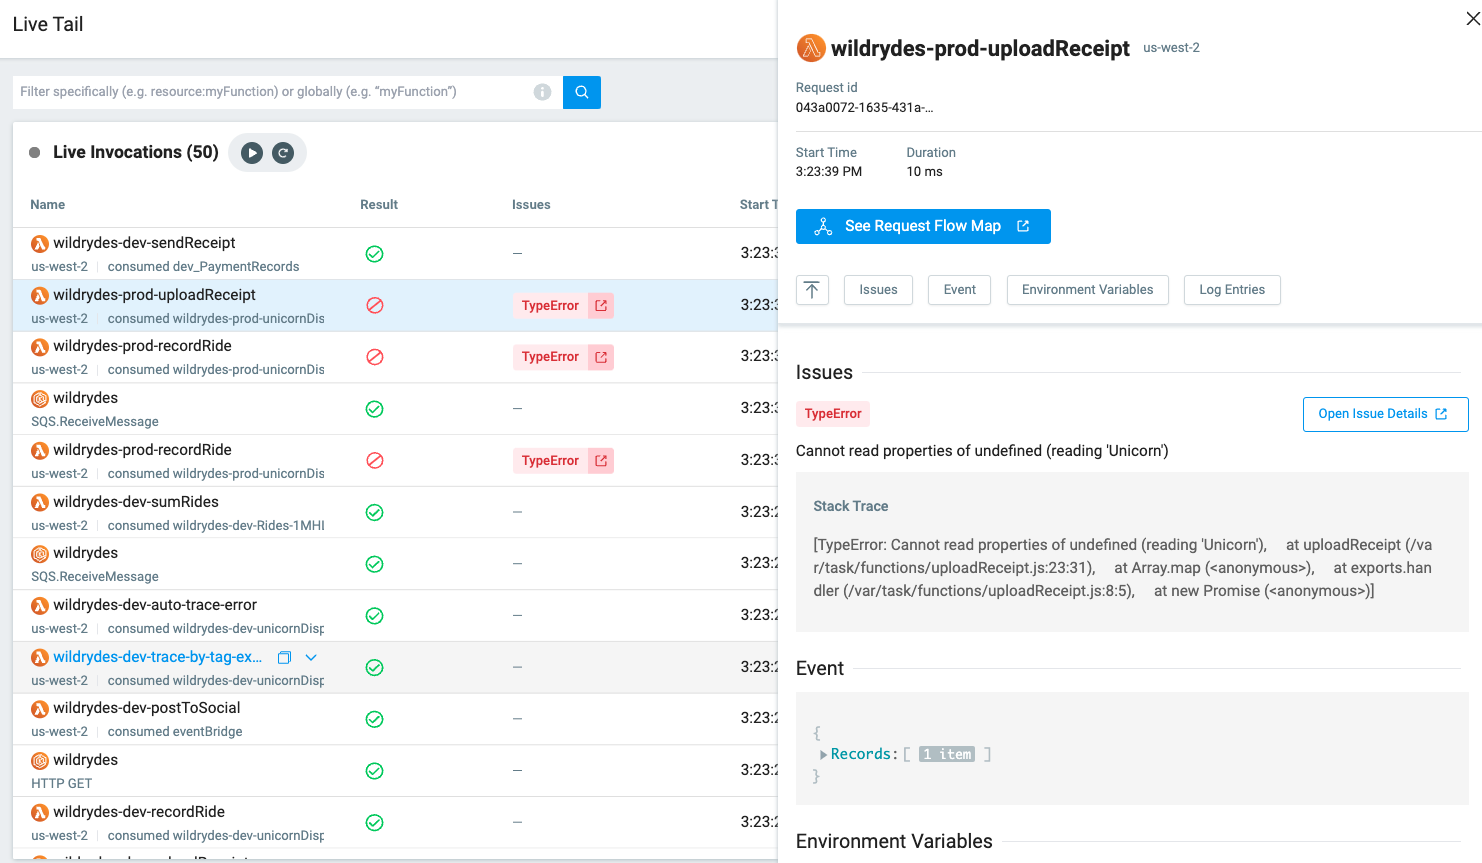
But the bounty doesn’t stop there. You can delve deeper into the aftermath of your request. Review the results at a granular level – inspect the log entries and delve into the configuration specifics of your resources. You have everything at your disposal, including runtime data and region specifics. It’s like having a magnifying glass to scrutinize the inner workings of your incoming requests.
Enhanced Filtering Capabilities
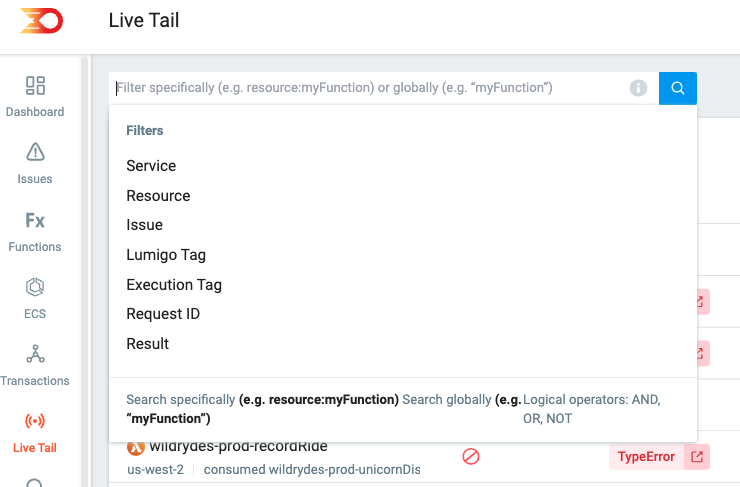
Navigate through your data with ease using the autocomplete filter options. Effortlessly find invocations by utilizing key-based or free search criteria. Take advantage of filters based on service type, resource name, issue type, and more. The “Issue only” filter allows you to narrow down the list to focus solely on invocations of interest.
Now with even more Container Support
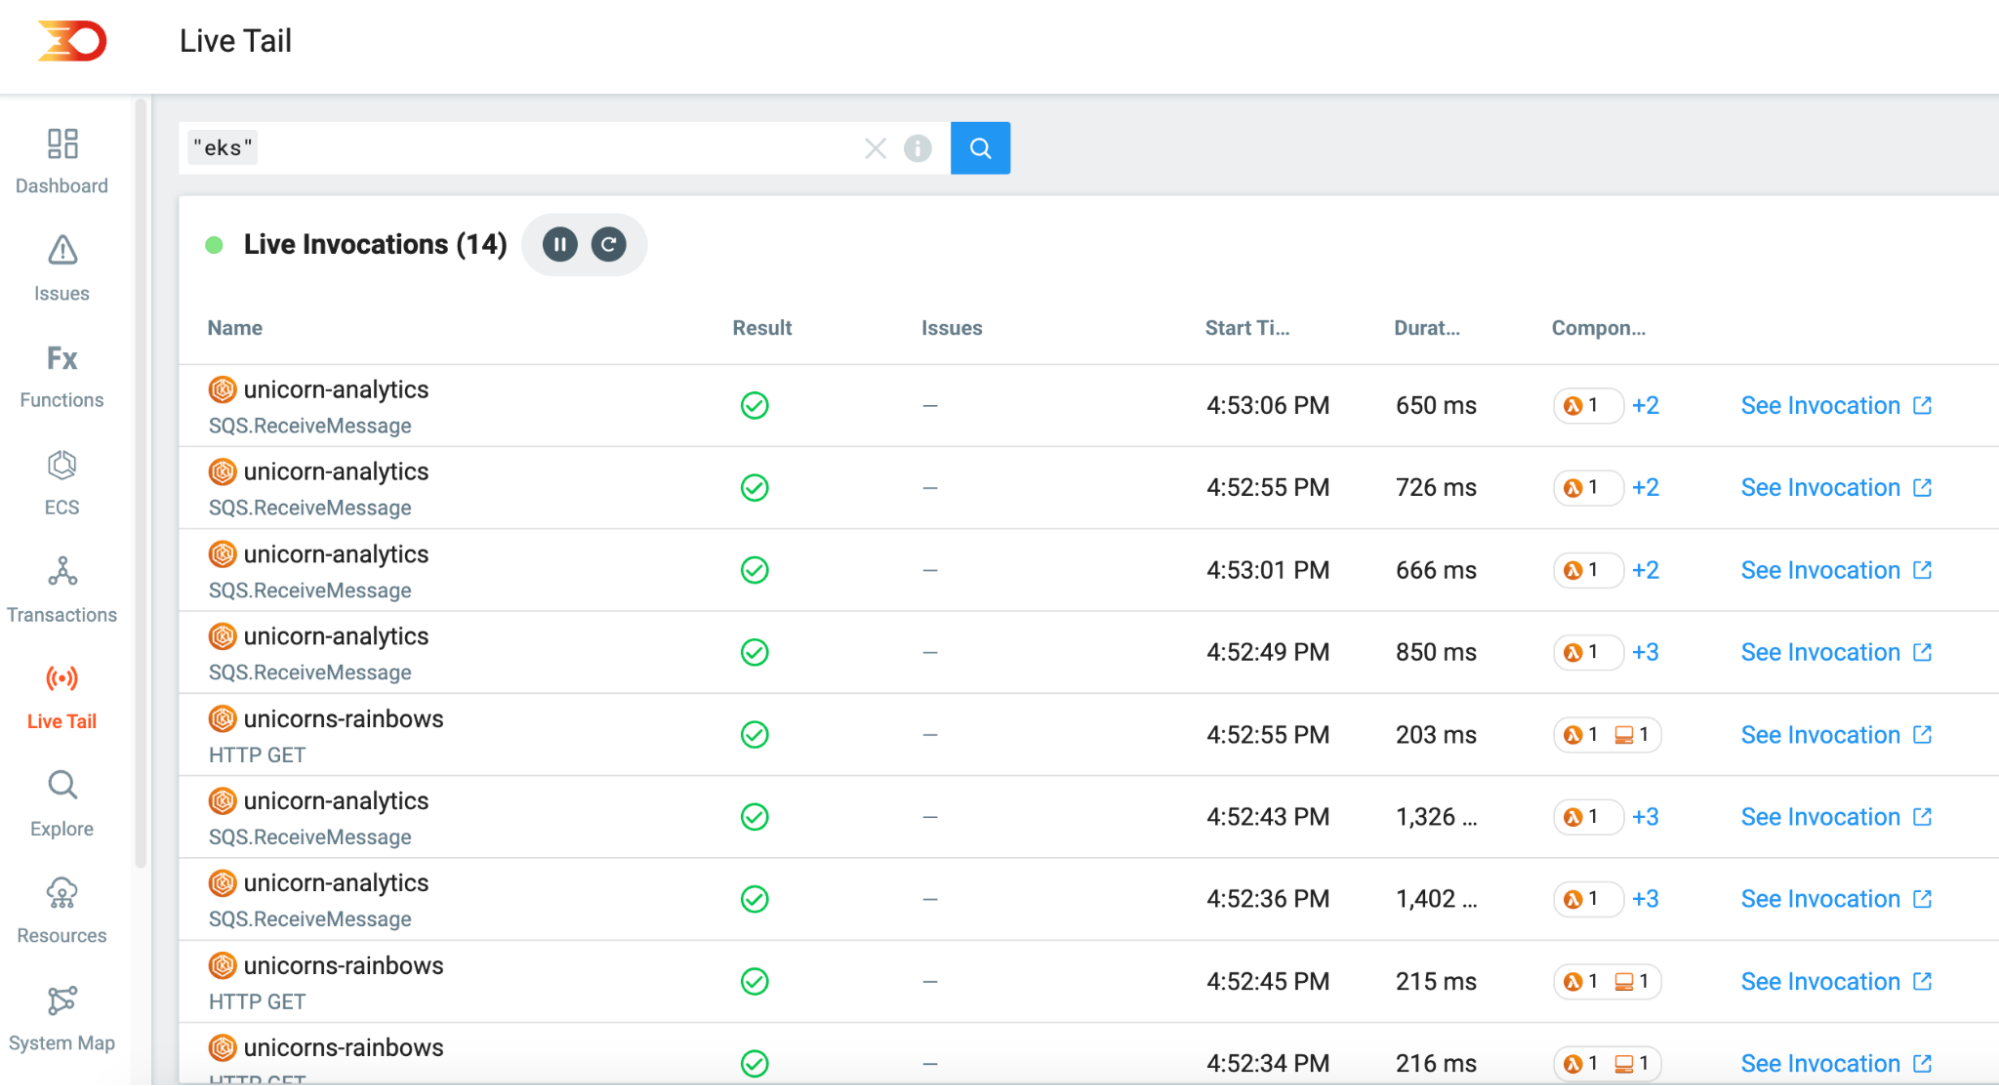
One of the latest enhancements to Live Tail is its expanded support for traced containers, including both containers and namespaces that are automatically traced using the Kubernetes operator. This new capability fits neatly into the evolving landscape of container management, making Live Tail even more versatile in handling modern development environments.
This feature isn’t merely an add-on; it’s a strategic integration aimed at simplifying the monitoring and troubleshooting process for Kubernetes deployments. By bringing Kubernetes and container deployments into the Live Tail view, developers are equipped with an efficient way to manage these complex systems. Whether you’re a seasoned Kubernetes veteran or just getting started, Live Tail’s support for traced containers makes the task of overseeing your deployments more straightforward and user-friendly. For more on getting started with the lumigo Kubernetes operator, see our blog post on Kubernetes Troubleshooting with Operators and Auto-Tracing.
Test it out and let us know what you think
As developers, our objective is to build functional, efficient applications, and with Live Tail, we’re equipped to identify and rectify issues faster. This is not just a step forward; it’s a giant leap into a future where developers are empowered and debugging is no longer an intimidating endeavor. The new Live Tail page is a beacon of transformation in the world of troubleshooting and debugging. It’s designed to alleviate the weight of laborious investigations that can often burden and hamper your application. The convenience and power of this tool are unmatched – simplifying the complex, making the invisible visible, and ultimately saving you valuable time.
Experience how we’ve redefined the art of troubleshooting with the new and improved Live Tail. it’s a sure fire way to gain a whole new set of super power visibility into your stack, and stay ahead in the fast-paced digital realm. So, what are you waiting for? Step into the world of Lumigo, sign up for a free account, and be ready to revolutionize your debugging. This isn’t just an invitation; it’s a call to action for a smoother, smarter, and more efficient developer life. Come, test it out, and let us know what you think!

