


Kubernetes has revolutionized the way we manage and deploy applications, but as with any system, troubleshooting can often be a daunting task. Even with the multitude of features and services provided by Kubernetes, when something goes awry, the complexity can feel like finding a needle in a haystack. This is where Kubernetes Operators and Auto-Tracing come into play, aiming to simplify the troubleshooting process.
Just recently, we had the privilege of hosting a webinar with Lukonde Mwila, a renowned Kubernetes and a AWS Senior Developer Evangelist, who illuminated this topic. Lukonde highlighted the role of Kubernetes Operators, invaluable tools designed to understand, manage, and automate the complexities of deploying applications, acting as proactive overseers within your tech stack. Coupled with auto-tracing, a technique akin to a super-sleuth, you gain deeper insights into system performance, identifying bottlenecks and anomalies within your applications.
In this blog post, we’ll delve deeper into the insights from the webinar and explore how Kubernetes Operators and auto-tracing can revolutionize your troubleshooting approach. Drawing from our own experiences, we’ll break down the functionalities and impacts these tools have on enhancing system resilience. Join us as we dive headfirst into the expansive world of Kubernetes troubleshooting.
Setting up the Lumigo Operator
Getting started with our Kubernetes Operator is a breeze, and it only takes a few steps. Built with a developer-first approach, our operator aims to make setup swift and trouble-free, clearing the way for more efficient troubleshooting and debugging.
This tutorial is designed to assist you in integrating the Lumigo Operator within your Kubernetes ecosystem, particularly in the ‘ecommerce‘ namespace where our demo app from the webinar will be deployed.
First, add the Lumigo Helm repository to your Helm configuration using the following command:
helm repo add lumigo https://lumigo-io.github.io/lumigo-kubernetes-operator
Now, install the Lumigo Operator using Helm and replace the `cluster_name` with the name of your cluster.
Tip: If you are using docker desktop then use docker-desktop as the cluster name.
helm install lumigo lumigo/lumigo-operator –namespace lumigo-system –create-namespace –set cluster.name=cluster_name
After the installation, you can verify that the Lumigo Operator is up and running with this command:
kubectl get pods -n lumigo-system
At this point, you’ll see the running Lumigo Operator in your output, indicating a successful installation.

Next let’s use the operator to automatically trace the `ecommerce` namespace, which is where our demo app for this blog will be deployed. The Lumigo Operator automatically adds distributed tracing to pods created via Deployments, Daemonsets, ReplicaSets, StatefulSets, CronJobs, and Jobs.
Create the ecommerce namespace with `kubectl create namespace ecommerce`. Then generate a Kubernetes secret and resource manifest, including your Lumigo token. To find out more on where to find your Lumigo token check out the Lumigo help docs.
The manifest should look something like this:
apiVersion: v1

kind: Secret

metadata:

  name: lumigo-credentials

stringData:

  token: *lumigo-token # Example: t_123456789012345678901

---

apiVersion: operator.lumigo.io/v1alpha1

kind: Lumigo

metadata:

  labels:

    app.kubernetes.io/name: lumigo

    app.kubernetes.io/instance: lumigo

    app.kubernetes.io/part-of: lumigo-operator

  name: lumigo

spec:

  lumigoToken:

    secretRef:

      name: lumigo-credentials

      key: token
Save that and apply this manifest into the `ecommerce` namespace by running `kubectly apply -f location/file.yaml -n ecommerce`, replacing location and file name respectively.
To check that everything is configured and deployed correctly, run the following:
kubectl describe lumigo -n ecommerce
Which should look something like this
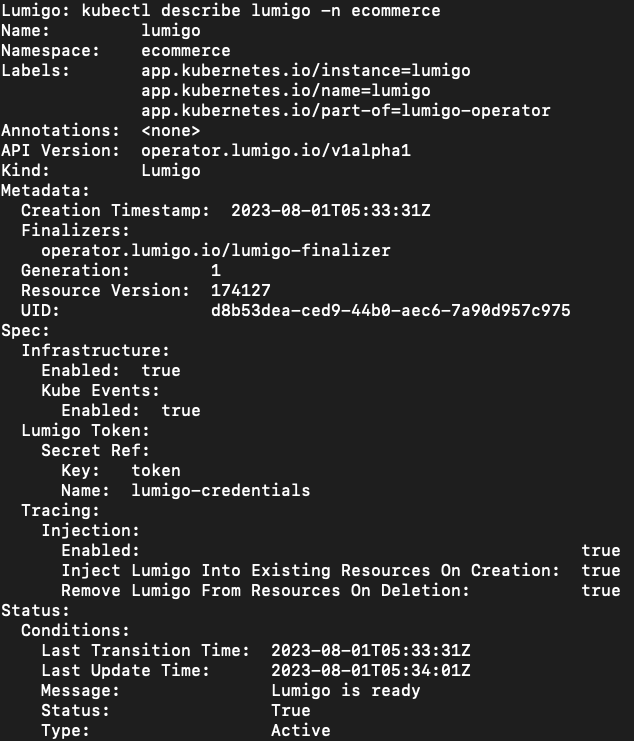
And there you have it! You have now successfully set up the Lumigo Kubernetes Operator in the ‘ecommerce‘ namespace, with automatic tracing enabled. This set-up will aid in monitoring and troubleshooting within your Kubernetes environment as we deploy the demo app services.
Setting Up The Demo Application
With the Lumigo Kubernetes operator now actively auto-tracing our ‘ecommerce’ namespace, we can proceed to deploy several services from our demo application to this namespace. The demo app services are hosted in these repos, which we’ll be using as the basis for this deployment.
Do note, we’ll need to make some slight modifications to each of the service app files. The key reason being that we are not employing a load balancer for this particular demonstration. Therefore, we will utilize the ‘hpropagate‘ library to ensure that our HTTP headers are effectively forwarded between services. This minor tweak ensures our tracing process works smoothly even without the typical load balancer configuration.
First `git clone` each of these repositories
https://github.com/LukeMwila/microservice-graphql-server
https://github.com/LukeMwila/microservice-orders
https://github.com/LukeMwila/microservice-products
Then `npm i hpropagate` in each of the newly cloned repos and make the following adjustments:
GraphQL (src/server.js)
const hpropagate = require("hpropagate");
hpropagate();
const http = require('http');
const app = require('./app');

const port = process.env.PORT || 3002;

const server = http.createServer(app);

server.listen(port, () => console.log(`Server running on ${port}`));
Orders (src/index.js)
const hpropagate = require("hpropagate");
hpropagate();
const http = require('http');
const app = require('./app');

const port = process.env.PORT || 3003;
const server = http.createServer(app);
server.listen(port, () => console.log(`Server running port ${port}`));
Products (src/index.js)
const hpropagate = require("hpropagate");
hpropagate();
const http = require('http');
const app = require('./app');

const port = process.env.PORT || 3004;
const server = http.createServer(app);
server.listen(port, () => console.log(`Server running port ${port}`));
With those repos cloned down and those changes made its now image build time followed by a little `kubectl apply -f`deploy on each of the services. These are each of the deployment manifests for the graphql, orders and product services.
Once each of those are deployed and stable, running `kubectl describe lumigo -n ecommerce` again will now show a healthy list of instrumented resources being monitored by the Lumigo Kubernetes Operator
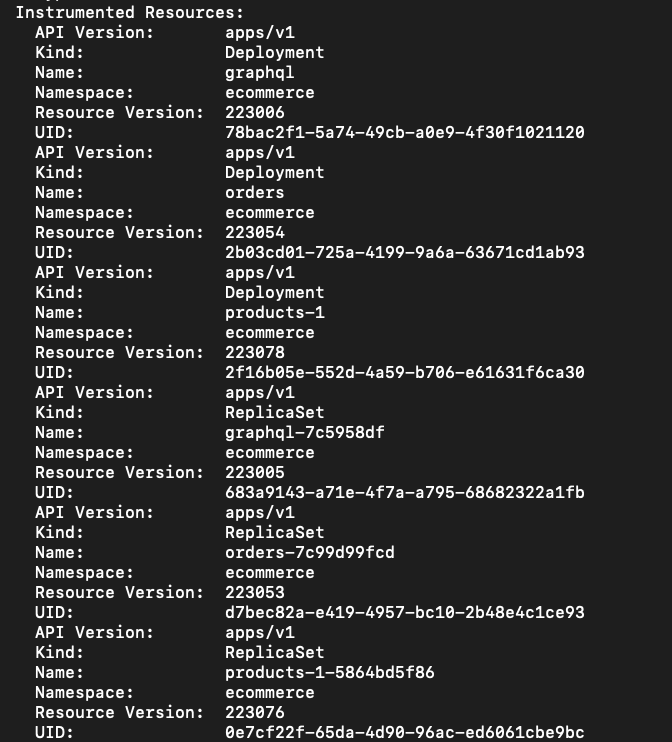
Let’s now put our setup to the test, prepare yourself as we run some exploratory queries but first we need to …
Get to the chopper Dashboard!

Brace yourself for the thrilling phase where we put our newly deployed application services under the test and delve into the traces from each service, all beautifully displayed within the Lumigo dashboard.
First step is to do a little port forwarding to make sure we can access those services, let’s start by running `kubectl get svc -n ecommerce` to get a list of service names then we can use that in our port forwards as follows:
`kubectl port-forward svc/graphql-service 3002:3002 -n ecommerce`
`kubectl port-forward svc/orders-service 3003:3003 -n ecommerce`
`kubectl port-forward svc/products-service 3004:3004 -n ecommerce`
Finally… let’s test it!
curl localhost:3002/v1/test
You should see a JSON response `{“message”:”GraphQL Server API works”}`. This is an exciting moment, not only does this mean that the service is working as expected but these interactions should now translate into visible traces within your system.
Heading to the Live Tail section will then start to surface each invocation as they are detected
Each service has a multiple of tests that can be run, providing you can access each service’s endpoint. The list of endpoints are as follows:
graphql:
curl localhost:3002/v1/test
curl localhost:3002/v1/
orders:
curl localhost:3003/metrics
curl localhost:3003/v1/orders
Products:
curl localhost:3004/v1/products
curl localhost:3004/v1/products/1a
The final curl command for products can be customized using any product IDs from the /products route’s output. Additionally, the GraphQL deployment includes a localhost:3002/playground route, utilizing the Express GraphQL playground. You should be able to access this through your web browser.
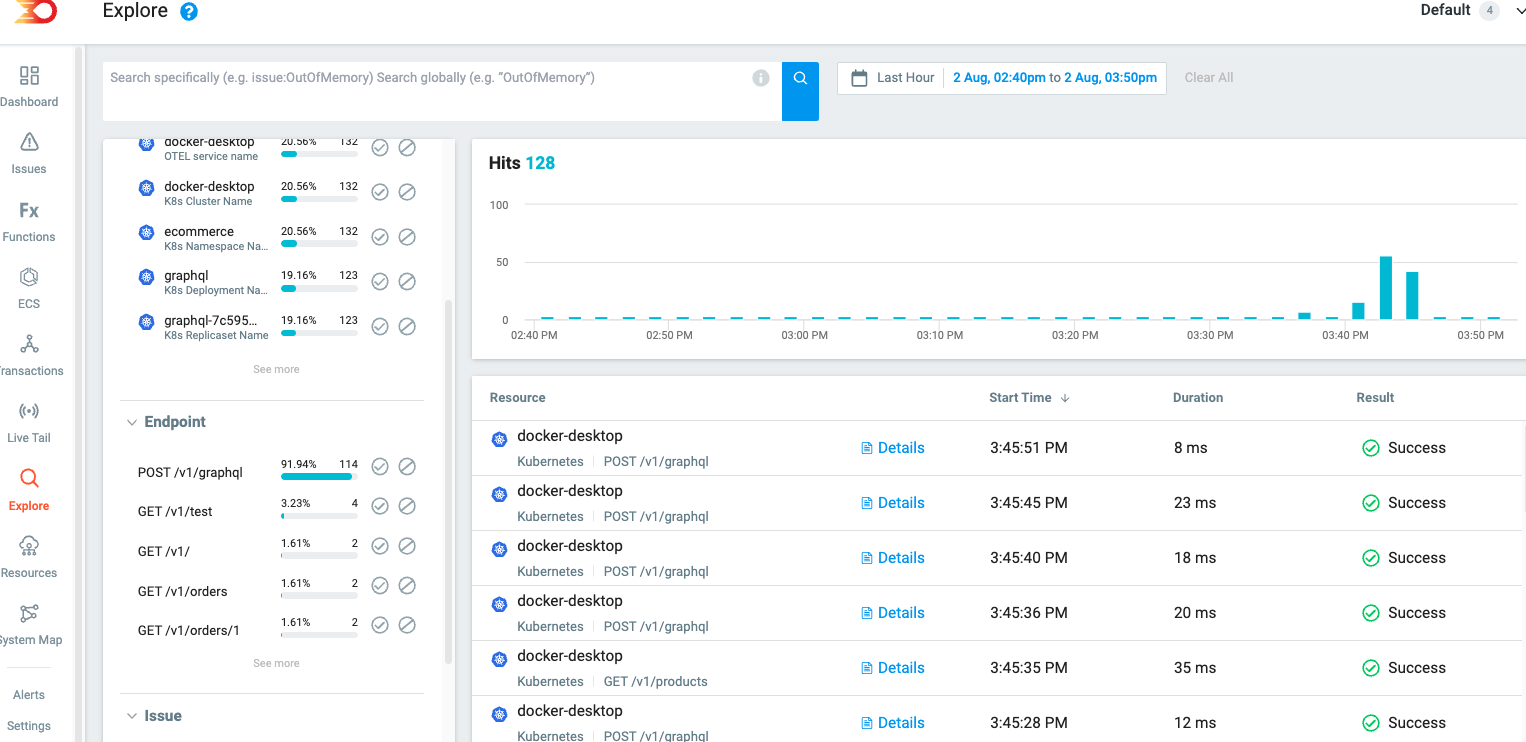
It’s worth noting that each invocation will present the traced data in different ways within the Lumigo dashboard. For example, Live Tail enables you to observe the last 50 events nearly in real-time, whereas the Transactions page allows you to browse through a complete log set based on your chosen date and time filter.
On the other hand, the Explore page offers the capability to apply specific query filters, such as “like” or “not like,” to the application’s detected spans. This provides a more detailed view of the traced data. One of my favorite features of the Lumigo Kubernetes Operator is its ability to identify the ExpressJS library within the traced application and utilize the express routes to automatically convert them into Lumigo execution tags.
Smoothing the Kubernetes Debugging Waters
As we wrap up this tutorial, it’s essential to reiterate the significance of our Kubernetes operator as a pivotal part within your Kubernetes environment. It has been designed to significantly simplify and streamline the debugging and troubleshooting process. It’s not just about finding issues faster; it’s about having the right tools to navigate the Kubernetes sea with confidence.
I encourage you to dive in and see how the Lumigo operator can revolutionize your Kubernetes workflow. Sign up for a free Lumigo account and take the helm yourself. Experience firsthand how the automatic tracing feature can enhance visibility and observability across your deployments.
Let’s not forget, while diving deep into hands-on learning within the mechanics of Kubernetes, it’s always essential to remember to clean up the resources we deploy. Especially in a real-world environment, efficient resource management can go a long way in maintaining a healthy and cost-effective system.