


At Lumigo, we see ourselves as your reliable ally in the noble mission of detecting and vanquishing troublesome issues that lurk within your serverless and container applications. Our secret sauce? Equipping you with a wealth of detailed trace data, ensuring you’re always well-lit and ready for battle when the nefarious ‘bugs’ make their unsolicited appearances.
Our new functionality has been built with the aim of expanding visibility into your application’s performance and is a product of countless hours of engineering and user feedback. We wanted to provide an additional layer of insight that could be instrumental in resolving issues more efficiently and effectively. We’re proud to introduce our new functionality that adds even more firepower to your bug-fighting toolkit: displaying the trace service endpoint.
Exploring Endpoints
Let’s envision service endpoints as digital signposts, strategically placed in the bustling cityscape of your application. These signposts offer fleeting, yet insightful glimpses into the vibrant lives of your services as trace data interacts with them. They reveal the covert operations these services orchestrate behind the closed doors of coded algorithms, much like a backstage tour of a live performance.
As you journey through the Lumigo UI, you’ll encounter these service endpoints surfacing in various sections, almost like stars peppering the night sky. While they dot the Lumigo dashboard panorama, they are at their most prominent in the Explore section, a dedicated area for in-depth insights and robust controls.
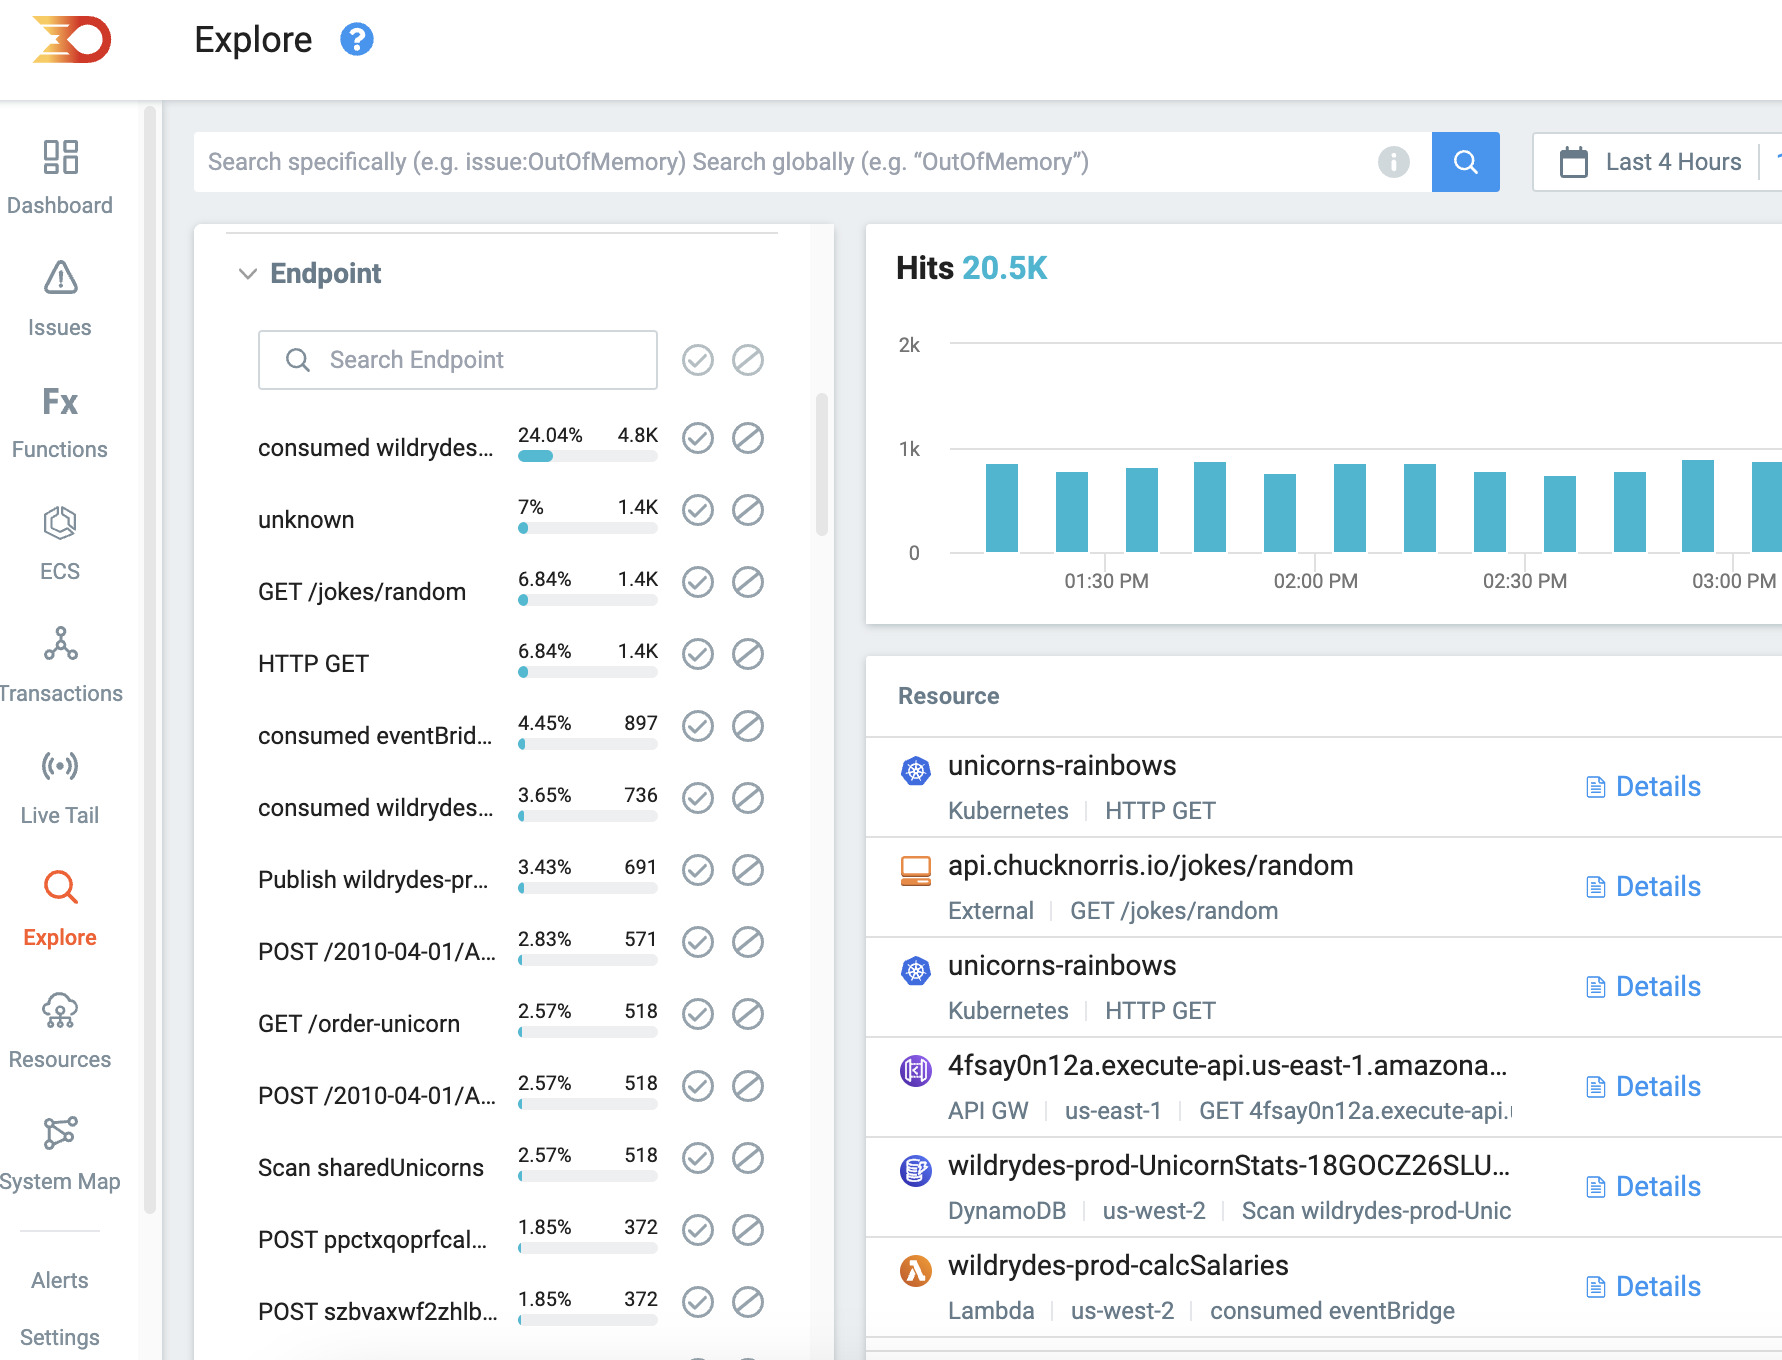
The Explore section of Lumigo acts as your personal command center. It is here that the endpoints reveal their full potential, offering you granular control and unparalleled insight into your application’s operations. Much like an astute detective with a keen eye for detail, the Explore section’s filter functionality allows you to sieve through the endpoints and filter for specific endpoint types and locations. You can deftly maneuver and manipulate these filters by clicking the cross to ignore or the tick to include, enabling you to focus on specific areas and isolate the finer nuances of your applications trace data.
Troubleshooting Traces with Endpoint Data
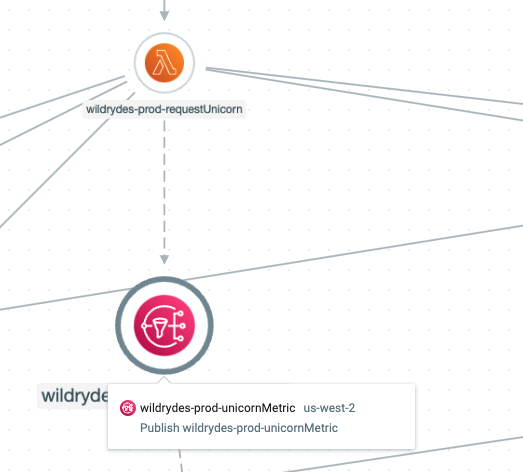
What I really love about this feature is that it helps get the full picture from each service’s role within the application by outlining how the endpoint action occurred. In the image below you can see a hover card from our wildrydes demo application system map which shows a POST request sent to `/prod/ride` being traced which then subsequently calls a multiple of services into action.
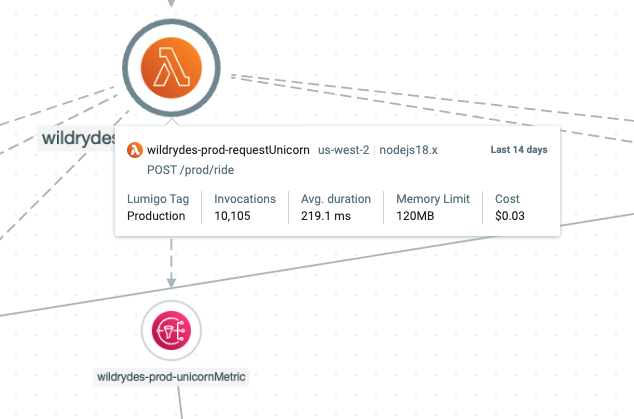
One of services involved in the full trace receives a ` Publish wildrydes-prod-unicornDispatched` request from the invocation
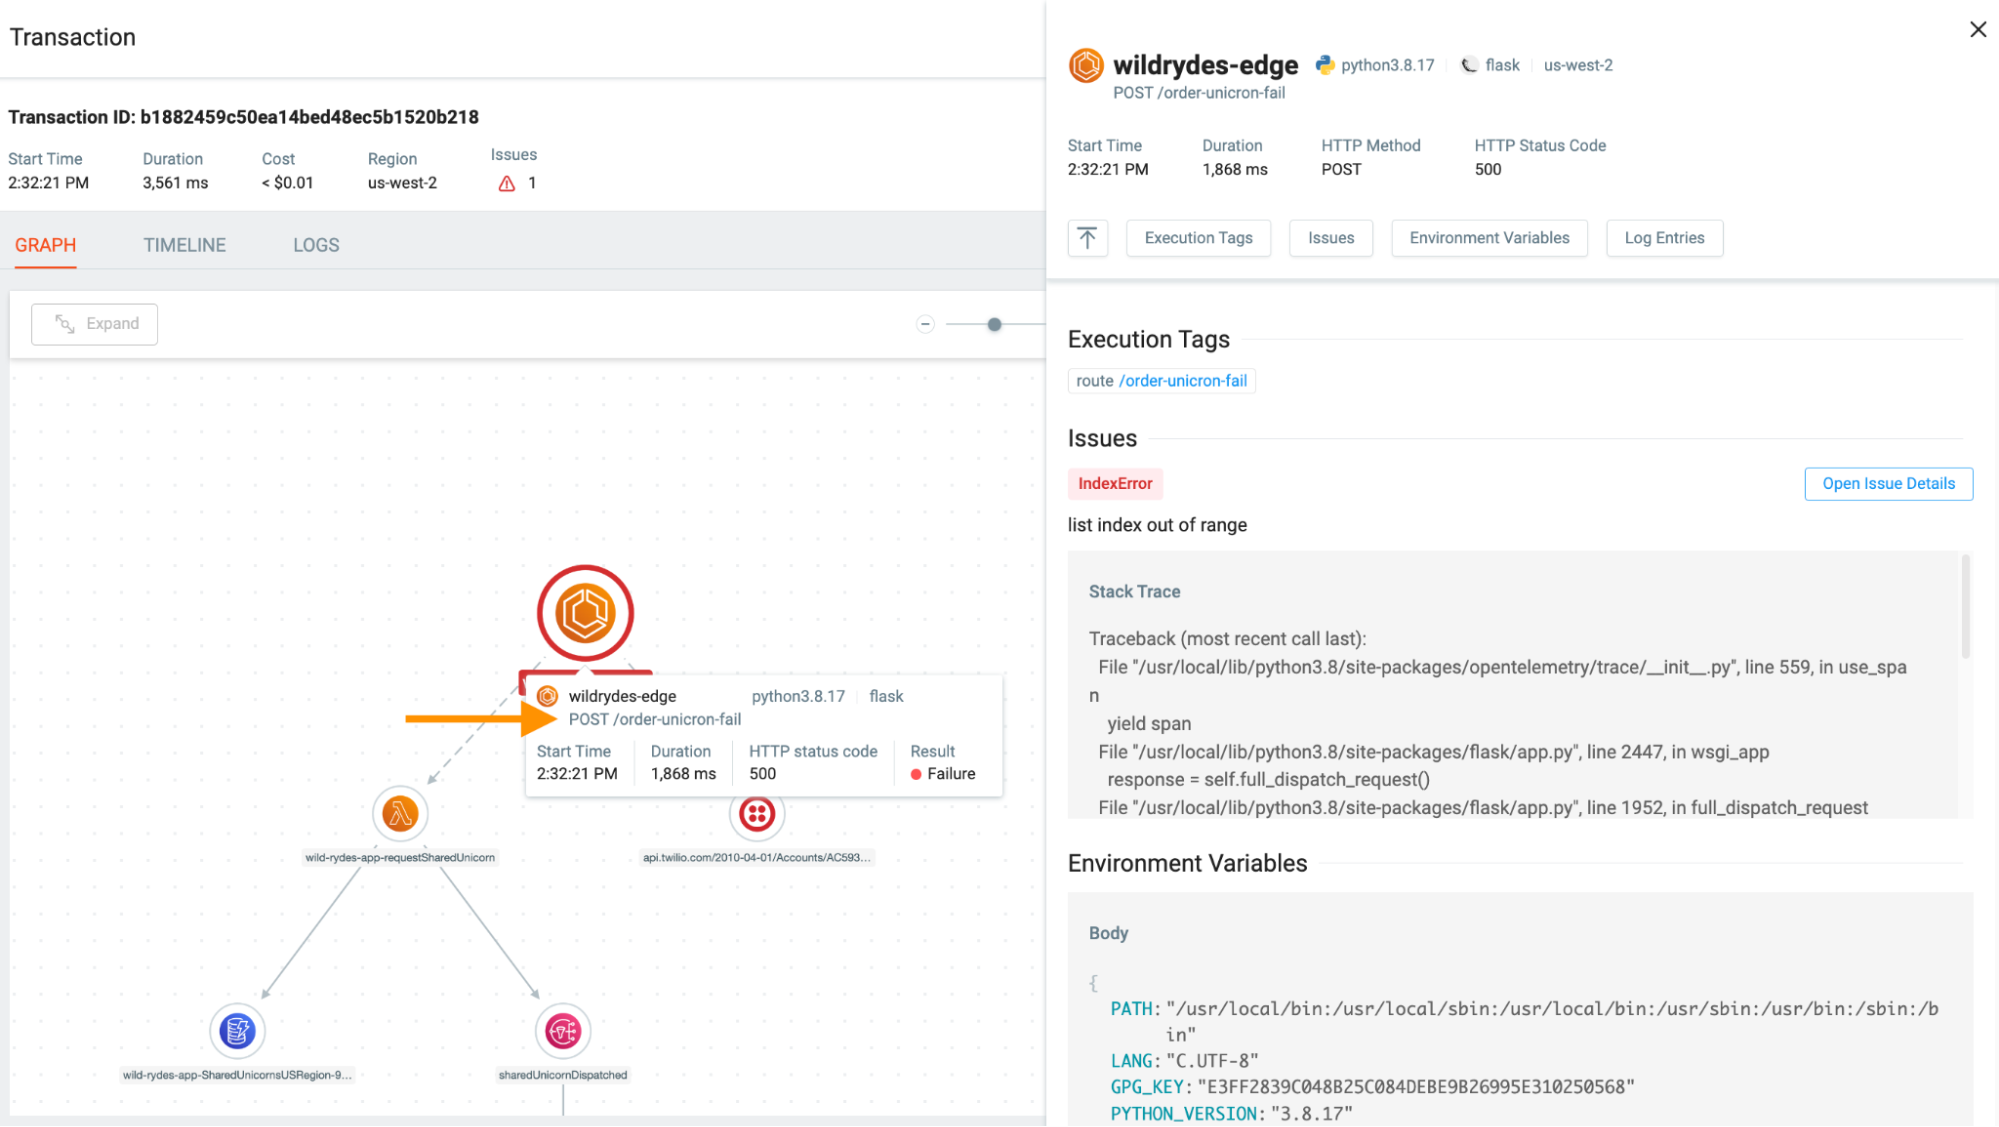
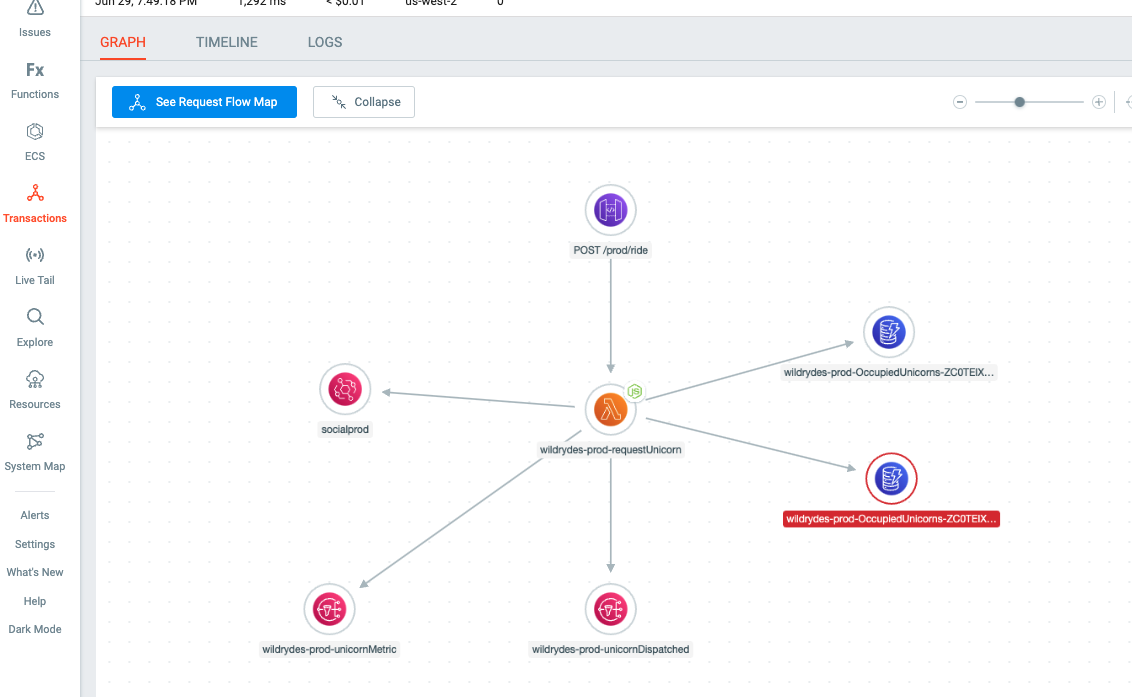
Where this gets even more interesting is then using this to identify potential issues. If we look at an anomalous bug being thrown as part of the transaction view involving this invocation you can see there is a problem with one of the two dynamoDB calls that are being instigated.
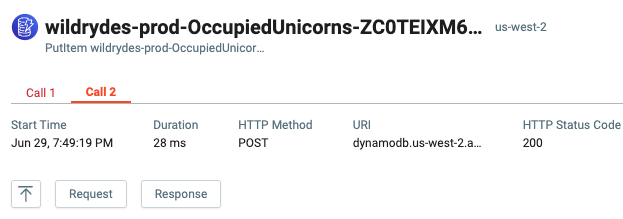
Digging in further and using our new powers of endpoint, we can see that the dynamoDB that worked was in fact for a `PutItem`
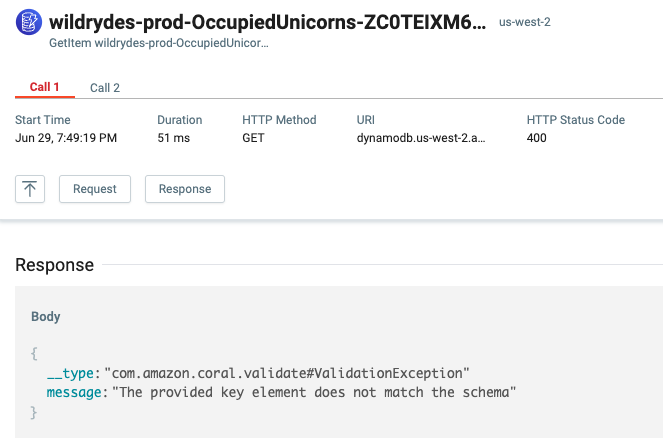
With the `GetItem` being the issue due to a schema query issue
How Endpoint Mapping Rules Work
Our predefined rules serve as the engine for automatic endpoint mapping. They function like detectors, creating an endpoint whenever a match occurs. This operation is designed to cover a wide range of endpoint types, and encompass as many difference service types as possible.
For instance, HTTP endpoints are mapped using their method and path or route. SQL database endpoints are identified by the first 50 characters of their SQL query. We’ve considered various other services as well, such as GraphQL, MongoDB/DocumentDB, Redis, Twilio, Cognito, Amazon DynamoDB, Amazon EventBridge, Amazon Kinesis Firehose or Stream, Amazon S3, Amazon SNS, Amazon SQS, AWS STS, and more.
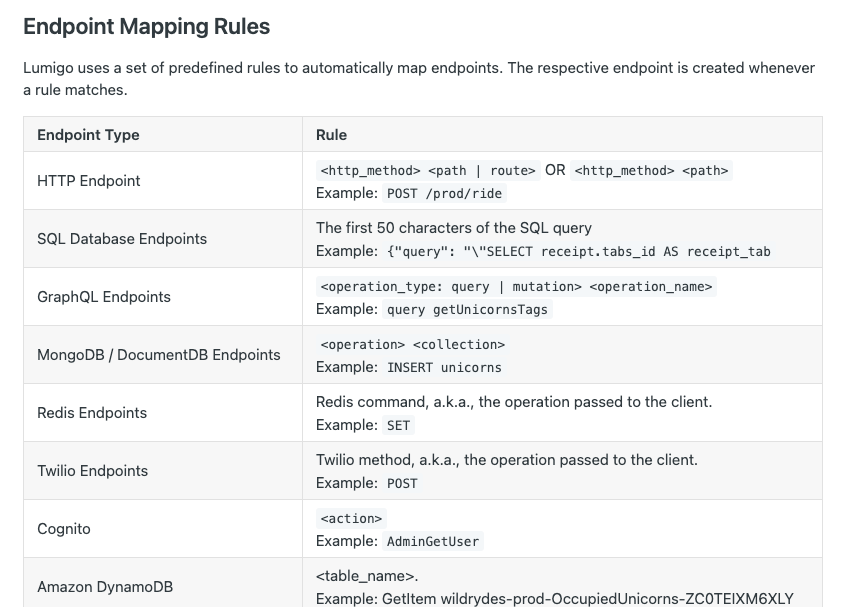
Even for those services that don’t neatly fit into these categories, we have a catch-all ‘Else’ category, primarily based on the span names (for container services) or marked as ‘unknown’.
Check out the Endpoints documentation to find out more including a full list of mapping rules, Additionally if you have any questions or
sign up for a free Lumigo account today
As we continue to enhance Lumigo, our focus remains on offering tools and insights that help you effortlessly understand your container and serverless applications. With our new service endpoint display feature, we’re taking another giant leap towards comprehensive, transparent, and actionable trace data. This feature, like all others at Lumigo, has been thoughtfully designed to simplify your work, optimize performance, and transform the way you manage your applications.
Uncover the practicality and efficiency of Lumigo by giving it a go today, it’s quick and easy to sign up and get started. A wealth of features, designed with user experience in mind, await your exploration. Sign up today to take a step towards enhancing your application’s efficiency and reliability.