
- Guide Content
Using OpenTelemetry with Datadog: A Practical Guide
What Is Datadog?
Datadog is a widely-used monitoring and analytics platform that offers comprehensive observability for modern applications. It assists DevOps teams and cloud-native developers in obtaining insights into their infrastructure, applications, logs, traces, and more. By gathering metrics from a variety of sources, including servers, containers, databases, and third-party services like AWS Lambda or Kubernetes clusters, Datadog allows users to analyze performance data and derive actionable insights.
This is part of a series of articles about OpenTelemetry.
In this article
Integrating OpenTelemetry with Datadog
OpenTelemetry is an open-source initiative designed to offer a unified set of APIs, libraries, agents, and instrumentation resources for capturing distributed traces and metrics from applications. It streamlines the process of instrumenting your code by providing standardized tools that can be utilized across different monitoring platforms.
Datadog supports the ingestion of data collected using OpenTelemetry through its native compatibility with the protocol. As a result, you can employ the same instrumentation in your application to transmit telemetry data to both Datadog and other observability platforms that support OpenTelemetry, without adding extra overhead or complexity.
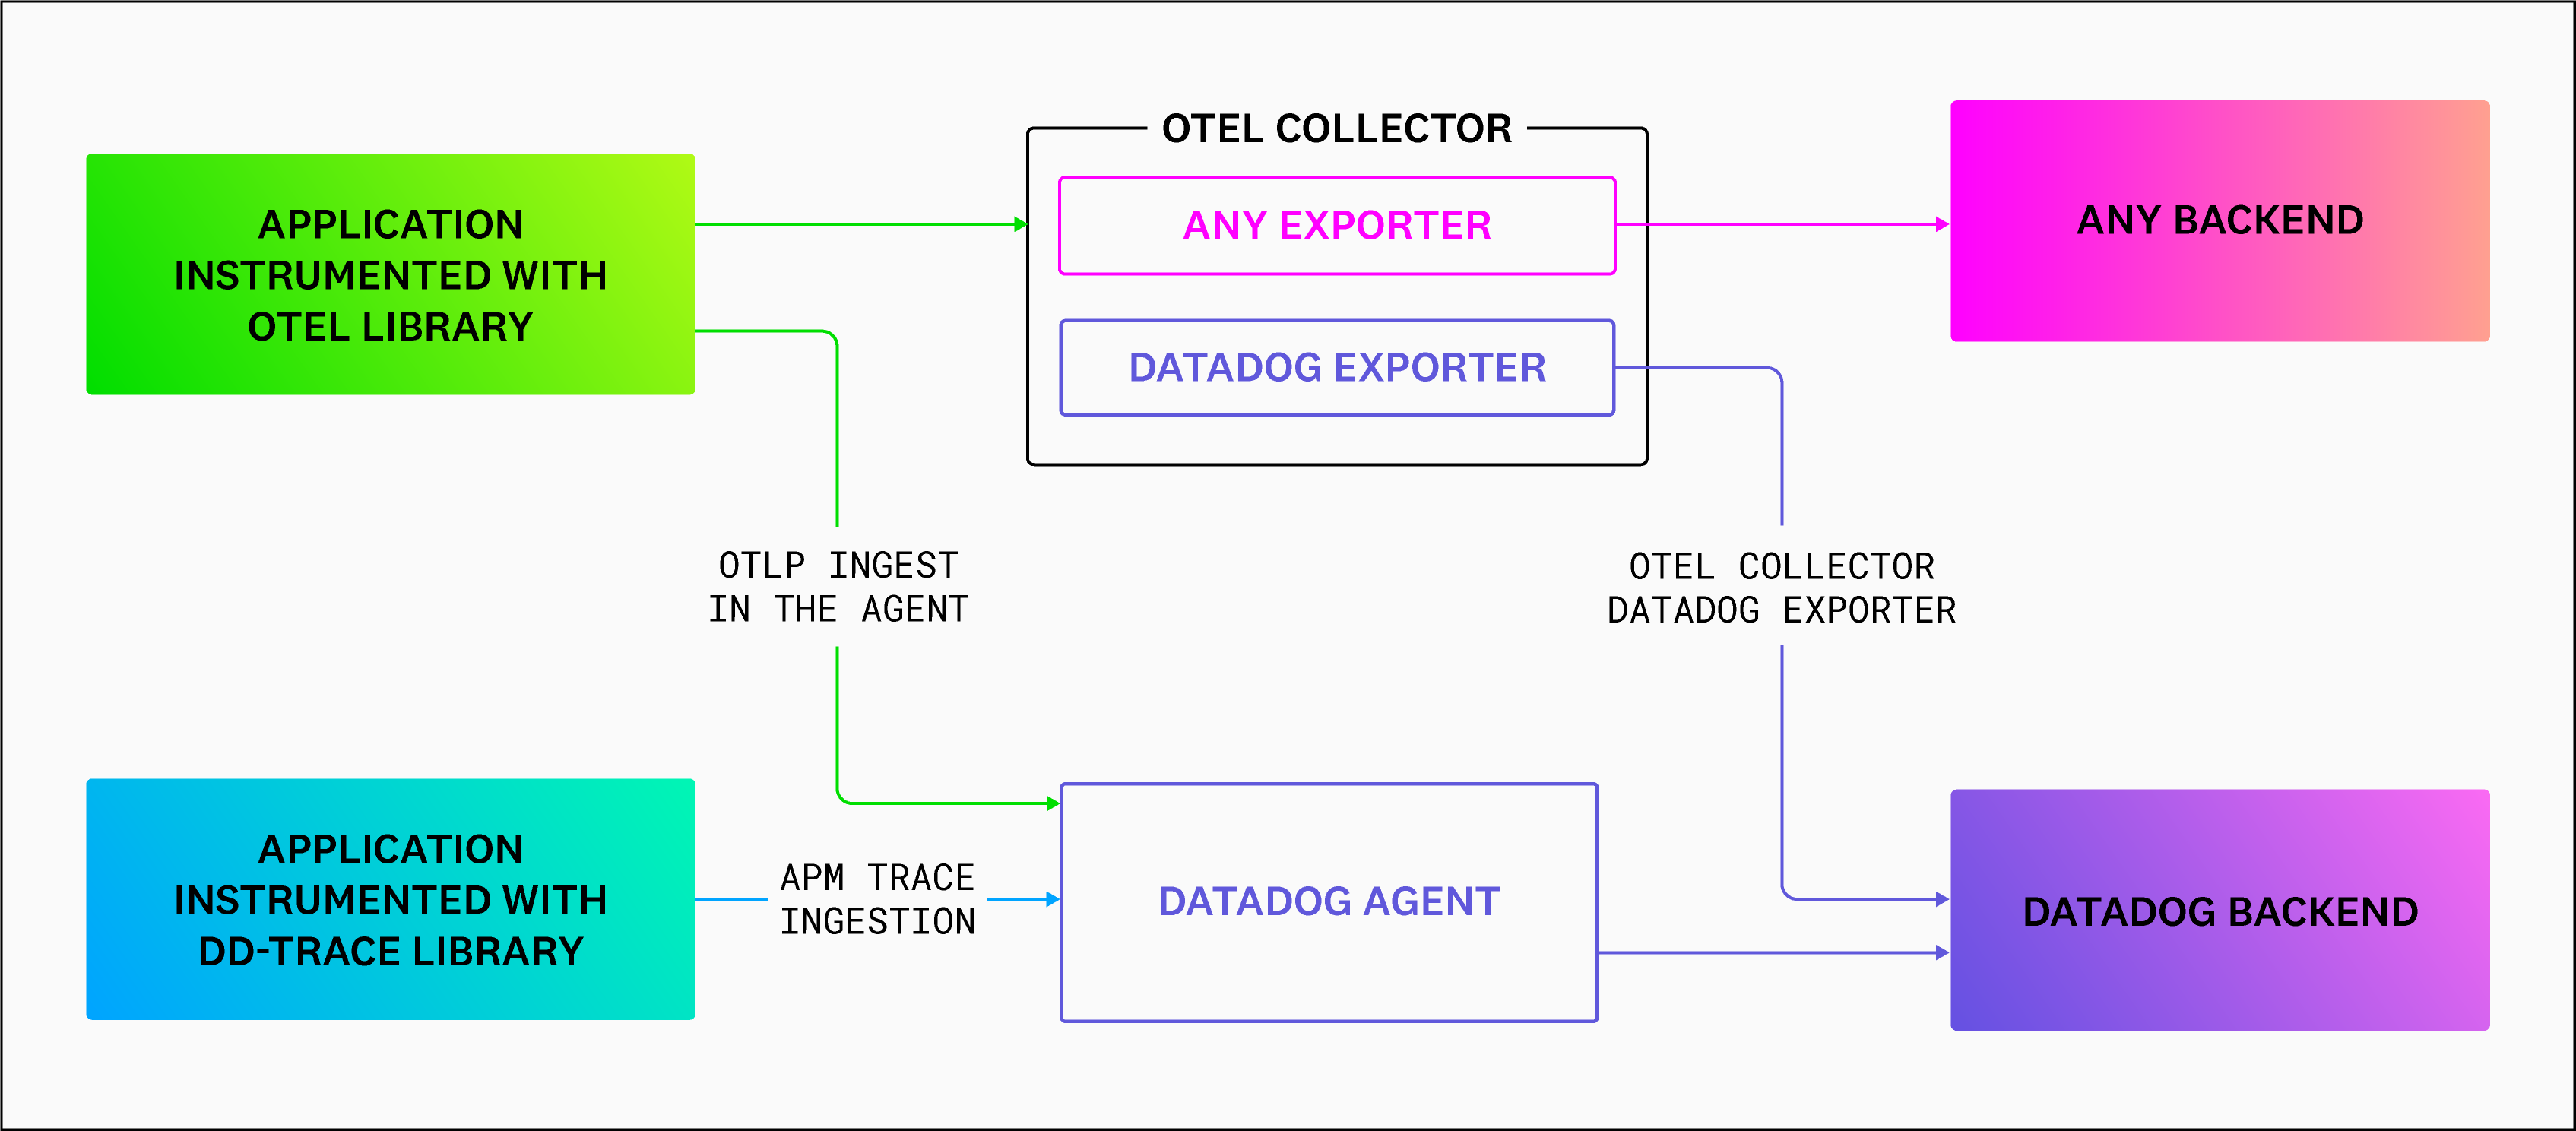
There are three main components involved in this process:
- Data ingestion: The Datadog Agent can ingest trace data directly from the OpenTelemetry Collector or SDKs through the OTLP (Open Telemetry Protocol).
- Metric exporters: You can set up metric exporters within your application code to send metrics directly to Datadog API endpoints.
- Built-in instrumentation libraries: Utilize built-in libraries offered by OpenTelemetry, such as Java, Python, Go, Node.js, and others, which are compatible with various frameworks like Django or Flask, making it simpler to instrument your applications.

Image Source: Datadog
Using Datadog’s OpenTelemetry Collector
To begin utilizing OpenTelemetry with Datadog, follow these steps:
- Install the suitable SDKs: Select the appropriate OpenTelemetry SDK for your programming language (e.g., Java, Python, Node.js) and integrate it into your application.
- Perform instrumentation: Add required telemetry data points, such as spans or events, to your code to collect detailed information about how different components interact within your system.
- Develop an exporter: An exporter sends the gathered telemetry data from your application to a backend service like Datadog. You can use an existing exporter from the community or create a custom one based on your requirements.
- Adjust tracing settings: Configure tracing parameters like sampling rates or span limits to meet your needs, balancing resource usage while maintaining sufficient application behavior visibility.
Datadog offers an OpenTelemetry Collector distribution that can replace the standard collector seamlessly. This custom distribution comes with several improvements, including:
- Datadog exporter: Transmits trace data to Datadog using the Datadog API.
- Resource detection processor: Automatically identifies and appends resource attributes (e.g., cloud provider metadata) to telemetry data.
- Data preprocessing: Enables you to modify or filter telemetry data before sending it to Datadog, enhancing efficiency and reducing the costs of ingesting large data volumes.
Learn more in our detailed guide to OpenTelemetry collector
OpenTelemetry in Datadog: Pros and Cons
Advantages of Using OpenTelemetry with Datadog
- Standardization: Adopting OpenTelemetry provides a single set of APIs, libraries, agents, and instrumentation resources across different languages and frameworks, simplifying application instrumentation and ensuring compatibility with tools like Datadog.
- Easy integration: Datadog’s native support for OpenTelemetry allows users to send traces directly from their applications without additional components or custom code. This integration also enables seamless correlation of metrics between your application’s performance data collected by both systems.
- Flexibility: OpenTelemetry’s support for multiple programming languages (including Java, Python, Go), container orchestration platforms (such as Kubernetes), serverless environments (like AWS Lambda), and database systems (e.g., PostgreSQL) ensures comprehensive monitoring through one unified solution when combined with Datadog’s extensive features.
- Built-in tracing capabilities: Properly integrated tracing offers valuable insights into request lifecycles, service dependencies, and potential application bottlenecks. Datadog can effectively visualize OpenTelemetry’s built-in tracing capabilities.
- Community Support: As an open-source project supported by the Cloud Native Computing Foundation (CNCF), OpenTelemetry benefits from a large community of contributors who continuously improve its features and documentation, ensuring access to up-to-date resources when used with Datadog.
Challenges of Using OpenTelemetry with Datadog
- Maturity: OpenTelemetry, while having made significant advancements, is still relatively new compared to other observability solutions like StatsD or Prometheus. Some organizations may encounter stability or feature completeness challenges when adopting it for use with Datadog.
- Incomplete instrumentation libraries: Although many popular frameworks and libraries are supported by the OpenTelemetry project, specific components may lack out-of-the-box instrumentation support. In such cases, developers will need to create custom integrations or rely on third-party contributions to fully leverage their monitoring solution.
- Evolving APIs: The project’s ongoing development means that API changes could potentially disrupt existing implementations if not carefully managed during updates. Teams working with both technologies (OpenTelemetry and Datadog) must stay informed about upcoming changes to adapt accordingly without adversely affecting their monitoring workflows.
OpenTelemetry with Lumigo
OpenTelemetry offers a pluggable architecture that enables you to add technology protocols and formats easily. Using OpenTelemtry, Lumigo provides containerized applications with end-to-end observability through automated distributed tracing.
Lumigo support for OpenTelemetry comes in two forms:
- Lumigo provides distributions of OpenTelemetry for Node.js and Python, which are optimized to require no code changes to your applications and come entirely pre-configured to report tracing data and resources to Lumigo
- Other implementations of OpenTelemetry, including the OpenTelemetry Collector or applications that include any of the language-specific OpenTelemetry SDKs, can export tracing data to Lumigo.