
- Guide Content
What Is OpenTelemetry?
OpenTelemetry is an open source suite of APIs, SDKs, specifications, and tools for telemetry collection. It is developed by a variety of contributors under the umbrella of the Cloud Native Computing Foundation (CNCF), and aims to provide a standardized, vendor-agnostic solution for instrumenting applications. OpenTelemetry enables sending telemetry data to a variety of backend, proprietary or open source, without having to modify the underlying codebase for specific backends.
OpenTelemetry has its roots in two historical projects—the OpenCensus project developed by Google and the OpenTracing project developed by a variety of open-source contributors and led in large part by Lightstep. Many companies worldwide actively contribute to OpenTelemetry, including Google, Microsoft, Amazon, Red Hat, Facebook, Shopify, Datadog and, recently, Lumigo.
In this article
OpenTelemetry Architecture and Components
OpenTelemetry consists of several main components. At its core is a cross-language specification for telemetry data. It provides tools for collecting, transforming, and exporting telemetry data—primarily the Collector component.
In addition, it includes SDKs for popular programming languages, automatic instrumentation libraries, and contrib packages, which are additional components created by OpenTelemetry contributors but were not selected for the core repositories, like instrumentation for specific libraries and frameworks, or additional capabilities for the OpenTelemetry Collector like being able to export data to AWS Kinesis streams.

Image Source: OpenTelemetry
Let’s review the key components.
Collector
OpenTelemetry Collector is a vendor-independent agent that can receive, process, and export telemetry data. It can receive telemetry data in various formats, including OTLP (the native OpenTelemetry protocol), Jaeger, Zipkin, Prometheus and other formats, including proprietary ones.
The OpenTelemetry Collector then forwards the telemetry it receives to one or more observability backends. It also supports processing and filtering of telemetry data before export, for example batching data to increase the efficiency of compression, or converting between formats.
The “contrib” build of the OpenTelemetry Collector adds support for more data formats and support for additional backends.
Learn more in our detailed guide to OpenTelemetry Collector
Language SDKs
OpenTelemetry also has language-specific SDKs, (Python, Node.js, Java, Ruby, .NET, and more) that let developers use the OpenTelemetry API to generate telemetry data in the language of their choice, and export that data to their favorite backend. These SDKs provide automatic instrumentation for common libraries and frameworks, and can integrate with manual instrumentation currently implemented in applications.
Vendors can distribute the language SDKs within their product to enable easy export to backends.
The coverage and usage of auto-instrumentation varies significantly by language. In some cases developers might prefer to use components loaded together with the application, and in others they might explicitly include packages in their codebase.
Exporters
Exporters allow developers to configure the backend they want to send data to. Exporters separate instrumentation from backend configuration.
This makes it easy to switch backends without re-instrumenting the code.
OpenTelemetry Distributions
An OpenTelemetry distribution is a custom version of a language SDK and some of its accompanying contrib packages or, in some cases, a vendor-specific build of the OpenTelemetry Collector with additional capabilities. Distributions are meant to add features on top of the “vanilla” versions of OpenTelemetry, remove features that are not necessary, streamline the setup and configuration and provide additional testing, performance, or security capabilities not offered in the base OpenTelemetry version.
OpenTelemetry Client Design Principles
OpenTelemetry implementations follow a set of core principles that maintain uniformity across supported languages, while allowing enough flexibility for expressing language-specific features. An OpenTelemetry client should provide a complete out-of-the-box set of extensible features allowing experimentation and innovation.
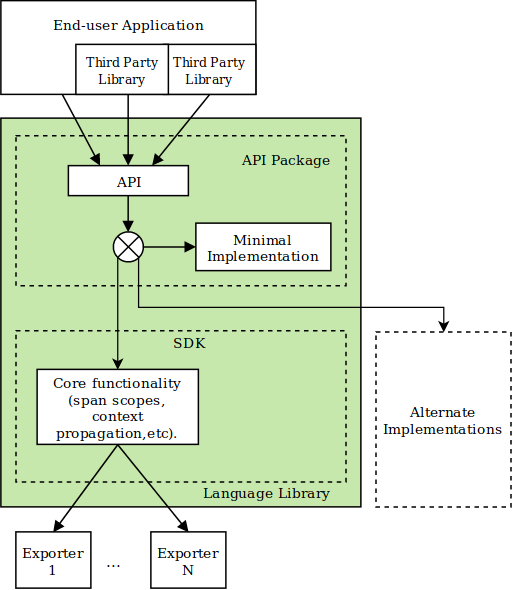
The following diagram illustrates a standard OpenTelemetry client design, with arrows indicating calls:

Image Source: OpenTelemetry
Client package types
An OpenTelemetry client includes four package types: API, SDK, plugin, and semantic conventions packages. Each API and SDK package contains multiple sub-packages based on signal type—for example, a separate package for API-trace, SDK-trace, API-metric, and SDK-metric. These sub-packages serve as implementation details, provided the API artifacts remain separate from the SDK artifacts.
Instrumenting applications, libraries, and frameworks
Applications, libraries, and frameworks instrumented using OpenTelemetry can only take dependencies based on an API package. The developer of a third-party library can generate telemetry data by making calls to the API.
An application using third-party libraries and instrumented using an OpenTelemetry API can control the installation of the SDK package and how it generates telemetry data. If no SDK is installed, there should be a no-ops API to generate minimal overhead.
Dependencies
The application must have a dependency on the SDK to enable telemetry. It must configure additional plugins, including exporters, to enable the correct generation and delivery of telemetry to their chosen analysis tools. The plugin activation and configuration details are language-specific.
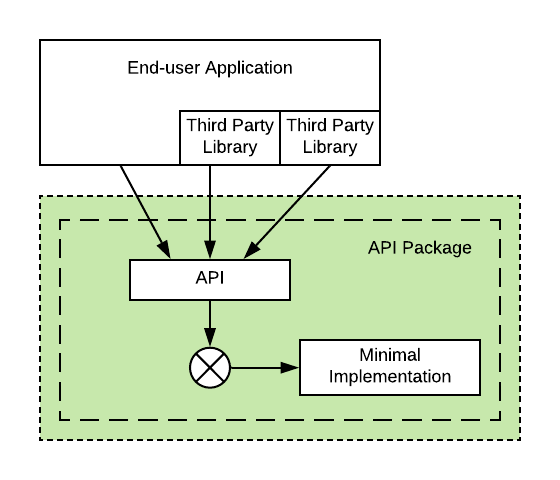
Self-sufficiency
The OpenTelemetry API package is self-sufficient. Suppose an end-user application or third-party library depends exclusively on this package without plugging a complete SDK implementation. In that case, the application should be able to build and run without failure, even if the telemetry backend does not receive any telemetry data.
This API dependency achieves self-sufficiency because it contains a minimal API implementation. If the application does not explicitly include another implementation, it will not collect any telemetry data. The active components of this setup may look like this:

Image Source: OpenTelemetry
The values that the minimal API implementation returns must be valid without the caller having to perform additional checks. For example, using “createSpan()” should result in creating a valid Span object and not return a failure. The caller should not have to assess whether the application has a minimal implementation. This approach helps minimize the instrumented code’s boilerplate and error handling.
Considerable care is devoted to limiting the performance overhead of minimal implementations of OpenTelemetry in the applications that adopt it.
Microservices Observability with Lumigo
Lumigo is a cloud native observability tool, purpose-built to navigate the complexities of microservices. Through automated distributed tracing, Lumigo is able to stitch together the distributed components of an application in one complete view, and track every service of every request.
Taking an agentless approach to monitoring, Lumigo sees through the black boxes of third parties, APIs and managed services.
With Lumigo users can:
- See the end-to-end path of a transaction and full system map of applications
- Monitor and debug third party APIs and managed services (ex. Amazon DynamoDB, Twilio, Stripe)
- Go from alert to root cause analysis in one click
- Understand system behavior and explore performance and cost issues
- Group services into business contexts
Get started with a free trial of Lumigo for your microservice applications.