


At Lumigo, we heavily depend on a set of tests to deploy code changes fast. For every pull request opened, we bootstrap our whole application backend and run a set of async parallel checks mimicking users’ use cases.
We call them integration tests. These integration tests are how we ensure:
- New changes we want to deploy actually work
- Changes aren’t breaking any existing functionality
Recently, we changed our old “traditional log traversing” of integration tests into *amazing* OpenTelemetry traces graphs like the ones below, and in this blog post, we’ll discuss why and how. 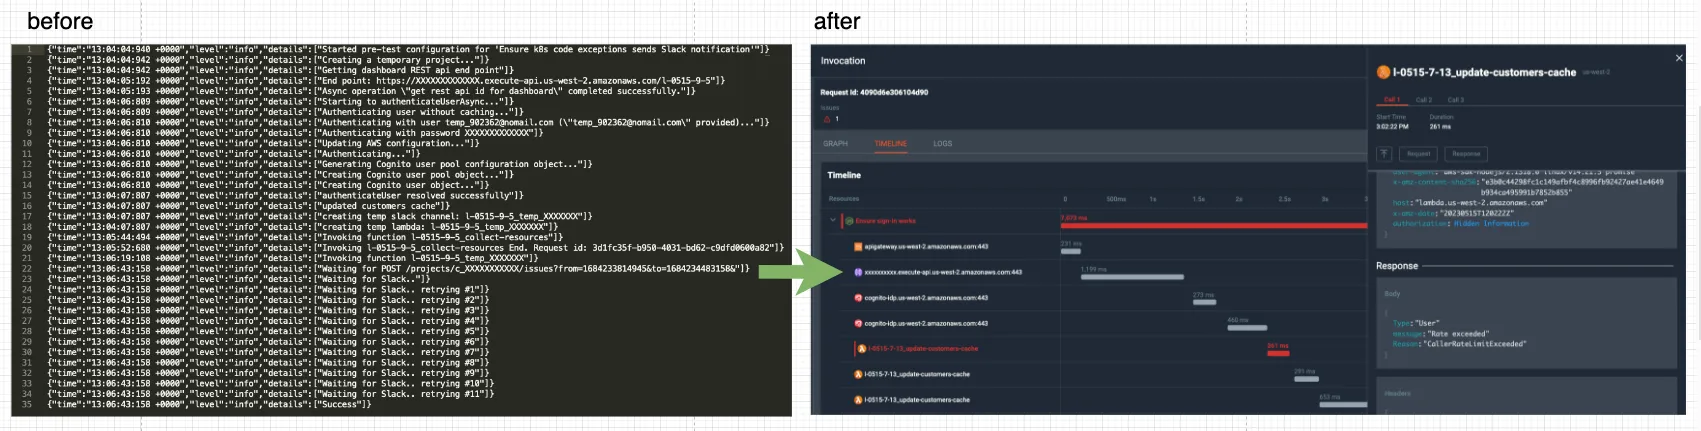
A typical integration test could look like this:
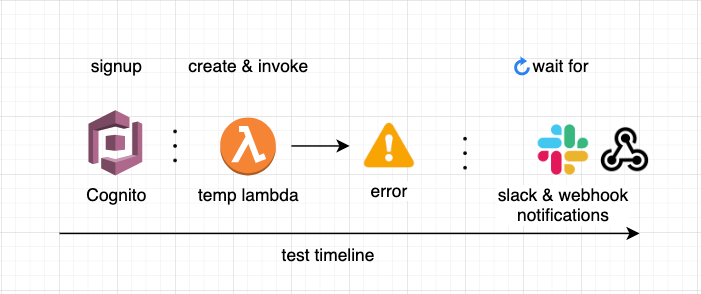
1. Signup to the product
(via the API)
2. Create temporary resources
(temporary Lambda)
3. Do something/ trigger an event — like a user would do
(invoke the temp Lambda and make it crash)
4. Expect results on the other end
(wait for insights to be outputted)
The Problem
Sometimes, the integration tests fail, and not because of the application code (the backend code), but because:
- The test code isn’t robust enough (e.g. API schemas aren’t extendable)
- Caching
- “Race conditions” (the test checks for data before it reaches our data pipelines)
- A dependent resource (e.g. temporary slack account) is flaky
- Slow response times causing Timeouts
- Returns an unexpected response seldomly
- Tokens were revoked
Whenever a test failed, we would look up the logs and try to find the problem. When the test logs weren’t informative enough, we checked the logs across all related components to search for the root cause that made our test fail. ????
I’m glad to say we found a better solution to the problem.
OpenTelemetry to the rescue
“OpenTelemetry provides a standard set of APIs, libraries, and SDKs that can be used to instrument your application code and collect data about its behavior”
OpenTelemetery (also known as OTel) is a `lego` of SDKs that gives users the flexibility to trace their app, starting from the code `instrumentors`, and `exporters` and continuing with the “backend”- `collector`, `ingestor` and a database to query the collected traces.
In the following example, I’ve used Lumigo’s support of OpenTelemetry (since we always eat our own dog food) which makes the setup part effortless, fast, and works like a charm. Lumigo offers support and extensions to OpenTelemetry as part of the platform.
Using OpenTelemetry allows us to trace the test, its timeline, its external calls, and its logs and helps us create a meaningful graph and timeline of events. The traced test can look like this:
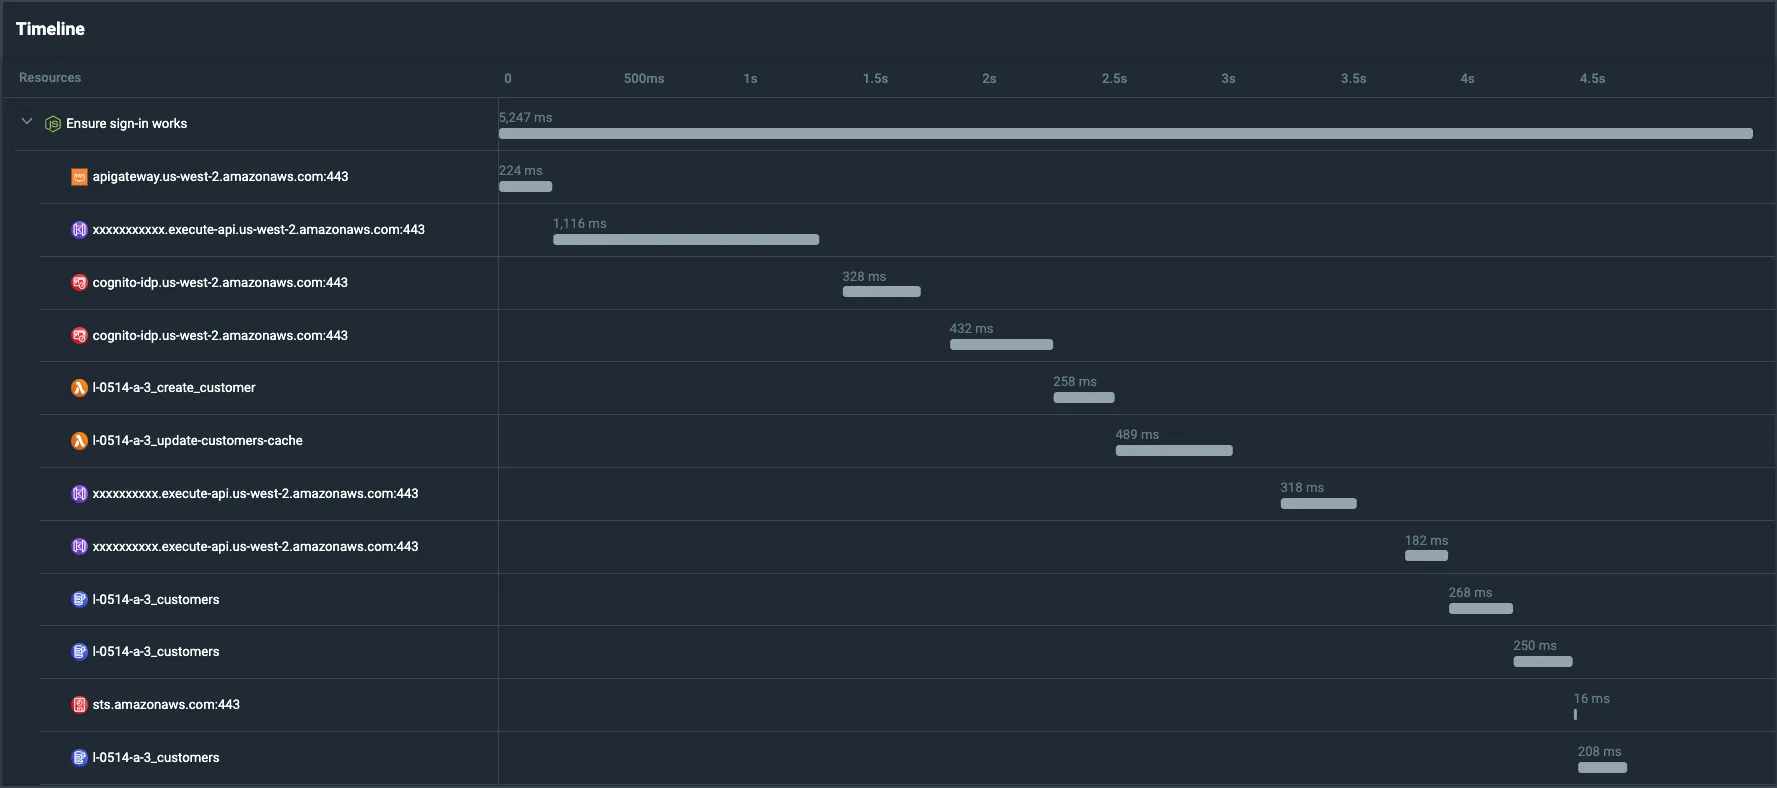
Lumigo Timeline View
“Show me the code” part
As mentioned before, I’ve used Lumigo’s Opentelemetry javascript distribution
- Adding lumigo’s opentelemetry-js distro to our `package.json`:
npm install @lumigo/opentelemetry
2. Add token env var to correlate your spans to your Lumigo project
export LUMIGO_TRACER_TOKEN=<token>
3. Optional: make sure each test has its own parent span
(as a beforeEach, or as a test wrapper. This helps to view traces for specific tests, instead of a big list of traces for all tests)
// start an internal span per-test. `test` is the async test function

await tracer.startActiveSpan(“<testName>”, test);
4. Optional: add some more execution-tags to the test
(as a beforeEach, or as a test wrapper).
For example:
- We can tag the person that invoked the CI job
- We can tag the link to the Pull-Request and attach that to the test
testRootSpan.setAttribute(

“lumigo.execution_tags.userName”,

process.env.CIRCLE_USERNAME || “”

);
Putting it all together (example):
by wrapping Mocha’s “it” function with a customized “test” function:
// setup.js
// Wrapping the mocha.it function

export const test = function({testName}, testCode) {

it(testName, async function() {

const test = async testRootSpan => {

// add tags to enrich the spans

testRootSpan.setAttribute(

“lumigo.execution_tags.userName”,

process.env.CIRCLE_USERNAME || “”

);
// run the test code

await testCode(testData, testParam);

};

// start a parent span for every test

await tracer.startActiveSpan(testName, test);

});

}
// Example of a <test-file>.js

const { test } = require(“./setup”);
describe(“describe”, function() {

test({testName: ‘test-name’}, async() => {

// test code goes here…

//

});

});
That’s it.
Every test now sends its traces to a backend that aggregates OpenTelemetry traces.
By inspecting the test traces, we can now easily understand the test timeline, and the various components. We can easily spot where the test fails and what events happened prior to the failure.
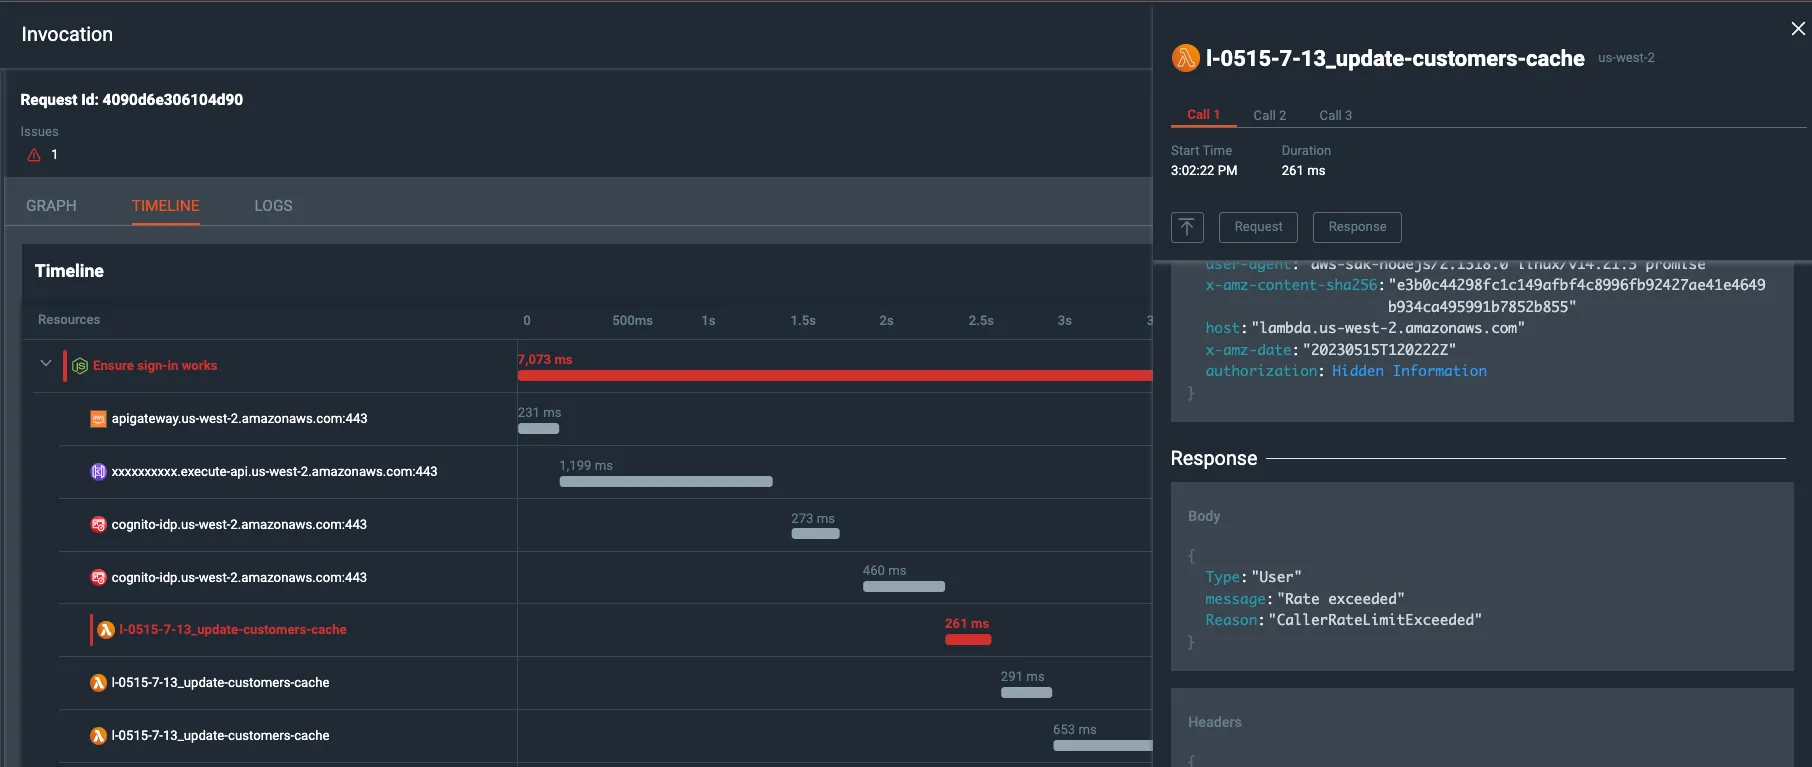
Lumigo timeline with request/ respond view
Notice how in this particular use-case ???? the `Lambda` API returned “Rate Exceeded” response which is unrelated to business-logic at all
We can inspect the HTTP calls made to the 3rd parties and see their payloads, times, query parameters, headers, and if any were different than what (we and) the test expected.
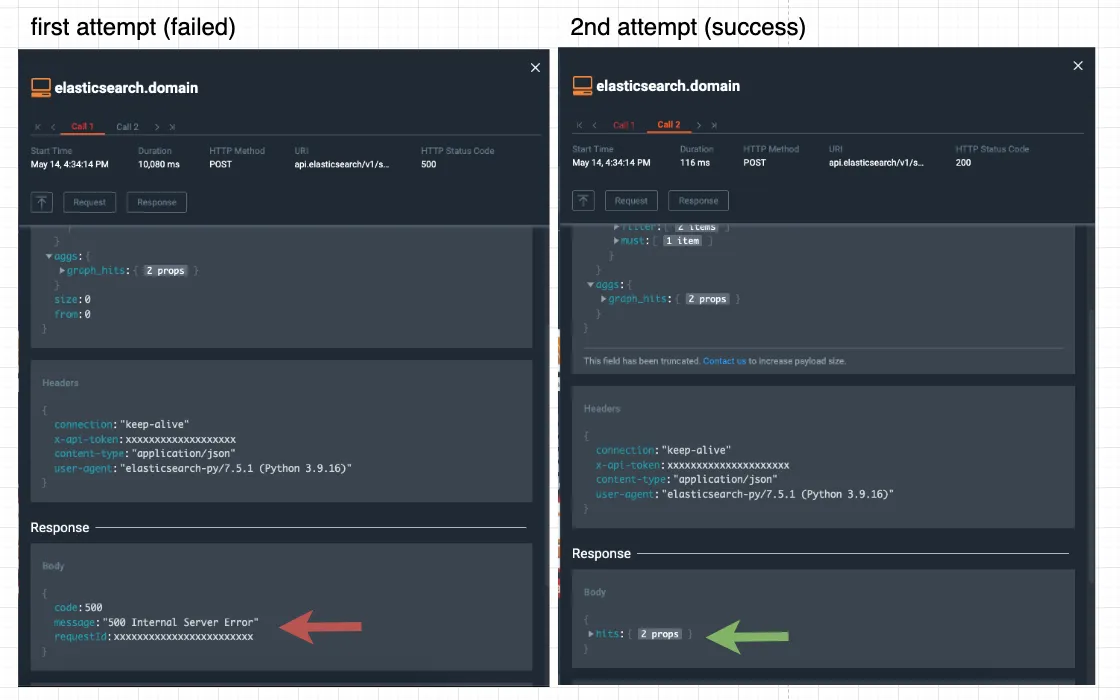
Retrying Elasticsearch API
Notice how in this particular use-case the `Elasticsearch` API returned “500 Internal Server Error” response on the first attempt, but succeeded on the second attempt (after a retry mechanism was implemented)
Conclusion
OpenTelemetry introduces a de-facto standard for tracing applications.
By leveraging tracing, developers can gain a deeper understanding of system behavior and identify issues that may be difficult or impossible to uncover through logging alone. If you want an easy, free way to start tracing your applications, try Lumigo.