


Open Telemetry (OTel) is an open source observability framework that has garnered significant attention for its powerful capabilities in monitoring metrics, logs and traces.. It is second only to Kubernetes in the CNCF velocity chart with contributions being made from major players in the cloud industry, and has a growing community helping build out a thriving ecosystem. Being open source it provides a vendor neutral approach for observability; instrument once and send the data to any backend for processing and storage
As strong advocates for the benefits of OpenTelemetry’s adoption, Lumigo takes the framework’s capabilities a step further by offering near-instantaneous insights that allows you to fully grasp the nuances of your application’s performance. If you’re interested in taking your microservice go apps to a whole new level, then read on!
The Importance of robust Instrumentation
Instrumentation is the process of adding extra code to micro services so that they generate the appropriate trace data when they are invoked. For some language runtimes Lumigo can do this automatically for you with just some minor configuration changes.
For those using binary compiled languages like Golang, manual instrumentation is currently the best option. However, it’s worth mentioning that work is nearly complete to enable fully automated, 1-click OpenTelemetry. Once this is rolled out, it will make it as effortless as possible for you to get your Golang services up and running with robust instrumentation, making the process as frictionless as other auto-instrumented languages.
Go OTel With Lumigo
All the code used here is available on GitHub, but please follow along as I’ll be stepping through each part of the code as we go.
The first step in any journey is to create a Lumigo account. then after signing in retrieve your Lumigo token. Keep this safe, do not commit it to GitHub and most definitely never hard-code it. This function takes the token as an argument which could be passed into the service via an environment variable. Lumigo provides an OTel HTTPS endpoint.
const (
	LUMIGO = "ga-otlp.lumigo-tracer-edge.golumigo.com"
)

func startTracer(token string) error {
	lumigoToken := fmt.Sprintf("LumigoToken %s", token)
	ctx := context.Background()
	options := []otlptracehttp.Option{
		otlptracehttp.WithEndpoint(LUMIGO),
		otlptracehttp.WithHeaders(map[string]string{"Authorization": lumigoToken}),
	}

	client := otlptracehttp.NewClient(options...)
	exporter, err := otlptrace.New(ctx, client)
	if err != nil {
		return fmt.Errorf("error creating exporter %v", err)
	}

	traceProvider := sdktrace.NewTracerProvider(
		sdktrace.WithBatcher(exporter),
		sdktrace.WithResource(appResource()),
	)
	otel.SetTracerProvider(traceProvider)
	// save tracer in global variable
	tracer = traceProvider.Tracer("tracer")

	return nil
}
This small initialisation function is all that is required to set up OTel tracing. OTel tracing is already included in many backend libraries e.g. caches, data stores, message queues, network communication, etc. The common request routers for Golang: Gorilla and Gin already have full support. In this example we’re using Gorilla.
r := mux.NewRouter()

r.Use(otelmux.Middleware("go-lumigo"))

r.HandleFunc("/", handleHome)

r.HandleFunc("/health", handleHealth)

r.HandleFunc("/add/{key}/{value}", handleAdd)

r.HandleFunc("/fetch/{key}", handleFetch)

r.HandleFunc("/list", handleList)

r.HandleFunc("/del/{key}", handleDelete)

http.Handle("/", r)

err = http.ListenAndServe(":8080", r)
Tracing is added by the use of middleware with just one line. The simple example micro service uses Redis for its storage. Once the Redis client is initialised, adding tracing is also quite easily done.
if err := redisotel.InstrumentTracing(rdb); err != nil {
	log.Fatalf("Can not trace Redis: %v\n", err)
}
In the above snippet rdb is the Redis client instance. Now when calling the Redis client API ensure the request context is passed and full end to end tracing is yours.
func handleAdd(w http.ResponseWriter, r *http.Request) {
	…
        _, err := rdb.Set(r.Context(), key, val, 0).Result()
        …
}
Visualisation
Instead of the burden of running your own trace storage and processing, for example: Jaeger, Kafka and Cassandra, which is a non-trivial task. Just ship the traces off to Lumigo then use the excellent user interface to gain deep insight into the performance of your services.
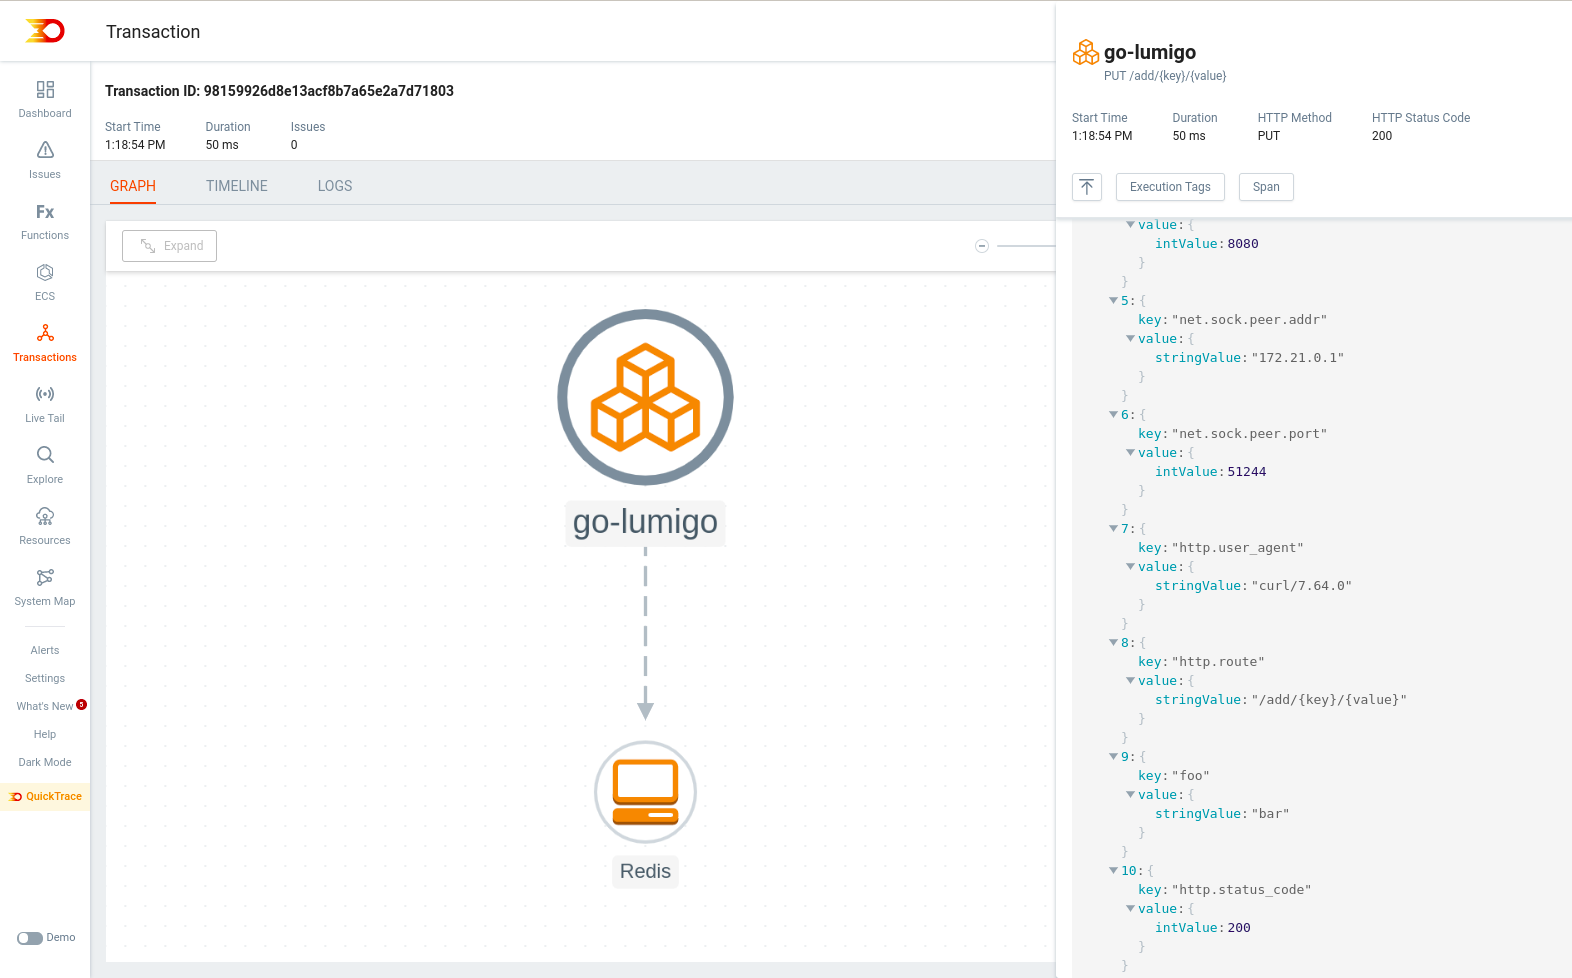
The screenshot shows an example OTel trace end to end from the Golang micro service through the Redis client API and ultimately the Redis backend.
Explore your Go Apps with Otel
When you’re dealing with complexity of Golang microservices, OTel can be invaluable for tracking down performance issues or to troubleshoot and debug unexpected behaviour. By not tying you down to specific vendors, it allows for a flexibility that can be crucial when you’re trying to get the most nuanced insights possible. While some teams might choose to manage their observability data in-house, it’s worth noting that the operational overhead in terms of time, computational power, and storage can be significant.
As strong believers in open source, OpenTelemetry welcomes contributions and involvement from the community. If you’ve found ways to extend or improve the Go instrumentation framework, or want to get more involved, contributing back can be a rewarding way to engage with the OTel community and help others.
Thanks for reading and if you’ve found this post informative, we’d appreciate it if you’d share it and follow us on our social media platforms for more insights.