


Apache Kafka, born at LinkedIn in 2010, has revolutionized real-time data streaming and has become a staple in many enterprise architectures. As it facilitates seamless processing of vast data volumes in distributed ecosystems, the importance of visibility into its operations has risen substantially.
In this blog, we’re setting our sights on the step-by-step deployment of a containerized Kafka cluster, accompanied by a Python application to validate its functionality. The cherry on top? We’ll seamlessly integrate OpenTelemetry into the mix, all without tweaking a single line of code…. yes you read that correctly!
Follow along as we explore the union of Kafka and OpenTelemetry, ensuring top-notch monitoring and debugging with minimal setup.
Setting up the Kafka Cluster
Prerequisites:
Before diving into the deployment and integration of our Kafka cluster and Python application, there are some essential tools and technologies you need to have at your disposal:
1. Docker: Our Kafka setup hinges on containerization, offering consistent environments across platforms. If you’re yet to install Docker, check out the official Docker documentation for guidance.
2. Python: Our application is built with Python, so having it installed on your system is crucial. If you’re unfamiliar with Python or need an upgrade, the official Python website has the latest distributions and installation instructions.
3. Sign up for a Lumigo Account: For the magic of deploying OpenTelemetry without altering any code, a Lumigo account is indispensable. If you haven’t signed up for a free Lumigo account yet, now’s the perfect moment. This account will play a pivotal role in the demonstrations of this blog post, plus it helps you eliminate complex OpenTelemetry setups!
Once you’ve got these tools ready, you’re primed to navigate the depths of Kafka clusters, Python applications, and the wonders of OpenTelemetry without a hitch!
Deploying a Kafka Cluster using Docker Compose
With the prerequisites out of the way its time to deploy our cluster using Docker Compose. Our Docker Compose setup references a Docker network named kafkas. Before you launch the Docker containers, it’s essential to have this network in place. To set it up, run:
docker network create kafkas
Next create a docker-compose.yaml file and copy the following:
version: '3'
services:
  kafka1:
    image: confluentinc/cp-kafka
    container_name: kafka1
    hostname: kafka1
    ports:
      - "9092:9092"
    environment:
      KAFKA_NODE_ID: 1
      KAFKA_CONTROLLER_LISTENER_NAMES: 'CONTROLLER'
      KAFKA_LISTENER_SECURITY_PROTOCOL_MAP: 'CONTROLLER:PLAINTEXT,INTERNAL:PLAINTEXT,EXTERNAL:PLAINTEXT'
      KAFKA_LISTENERS: 'INTERNAL://kafka1:29092,CONTROLLER://kafka1:29093,EXTERNAL://0.0.0.0:9092'
      KAFKA_ADVERTISED_LISTENERS: 'INTERNAL://kafka1:29092,EXTERNAL://localhost:9092'
      KAFKA_INTER_BROKER_LISTENER_NAME: 'INTERNAL'
      KAFKA_CONTROLLER_QUORUM_VOTERS: '1@kafka1:29093,2@kafka2:29093,3@kafka3:29093'
      KAFKA_PROCESS_ROLES: 'broker,controller'
      KAFKA_GROUP_INITIAL_REBALANCE_DELAY_MS: 0
      KAFKA_OFFSETS_TOPIC_REPLICATION_FACTOR: 3
      KAFKA_TRANSACTION_STATE_LOG_REPLICATION_FACTOR: 3
      CLUSTER_ID: 'BHogVA6JTtCQrN8kJPEpMQ=='
      KAFKA_LOG_DIRS: '/tmp/kraft-combined-logs'

  kafka2:
    image: confluentinc/cp-kafka
    container_name: kafka2
    hostname: kafka2
    ports:
      - "9093:9093"
    environment:
      KAFKA_NODE_ID: 2
      KAFKA_CONTROLLER_LISTENER_NAMES: 'CONTROLLER'
      KAFKA_LISTENER_SECURITY_PROTOCOL_MAP: 'CONTROLLER:PLAINTEXT,INTERNAL:PLAINTEXT,EXTERNAL:PLAINTEXT'
      KAFKA_LISTENERS: 'INTERNAL://kafka2:29092,CONTROLLER://kafka2:29093,EXTERNAL://0.0.0.0:9093'
      KAFKA_ADVERTISED_LISTENERS: 'INTERNAL://kafka2:29092,EXTERNAL://localhost:9093'
      KAFKA_INTER_BROKER_LISTENER_NAME: 'INTERNAL'
      KAFKA_CONTROLLER_QUORUM_VOTERS: '1@kafka1:29093,2@kafka2:29093,3@kafka3:29093'
      KAFKA_PROCESS_ROLES: 'broker,controller'
      KAFKA_GROUP_INITIAL_REBALANCE_DELAY_MS: 0
      KAFKA_OFFSETS_TOPIC_REPLICATION_FACTOR: 3
      KAFKA_TRANSACTION_STATE_LOG_REPLICATION_FACTOR: 3
      CLUSTER_ID: 'BHogVA6JTtCQrN8kJPEpMQ=='
      KAFKA_LOG_DIRS: '/tmp/kraft-combined-logs'


  kafka3:
    image: confluentinc/cp-kafka
    container_name: kafka3
    hostname: kafka3
    ports:
      - "9094:9094"
    environment:
      KAFKA_NODE_ID: 3
      KAFKA_CONTROLLER_LISTENER_NAMES: 'CONTROLLER'
      KAFKA_LISTENER_SECURITY_PROTOCOL_MAP: 'CONTROLLER:PLAINTEXT,INTERNAL:PLAINTEXT,EXTERNAL:PLAINTEXT'
      KAFKA_LISTENERS: 'INTERNAL://kafka3:29092,CONTROLLER://kafka3:29093,EXTERNAL://0.0.0.0:9094'
      KAFKA_ADVERTISED_LISTENERS: 'INTERNAL://kafka3:29092,EXTERNAL://localhost:9094'
      KAFKA_INTER_BROKER_LISTENER_NAME: 'INTERNAL'
      KAFKA_CONTROLLER_QUORUM_VOTERS: '1@kafka1:29093,2@kafka2:29093,3@kafka3:29093'
      KAFKA_PROCESS_ROLES: 'broker,controller'
      KAFKA_GROUP_INITIAL_REBALANCE_DELAY_MS: 0
      KAFKA_OFFSETS_TOPIC_REPLICATION_FACTOR: 3
      KAFKA_TRANSACTION_STATE_LOG_REPLICATION_FACTOR: 3
      CLUSTER_ID: 'BHogVA6JTtCQrN8kJPEpMQ=='
      KAFKA_LOG_DIRS: '/tmp/kraft-combined-logs'

  schema-registry:
    image: confluentinc/cp-schema-registry
    container_name: schema-registry
    hostname: schema-registry
    ports:
      - "8081:8081"
    environment:
      SCHEMA_REGISTRY_HOST_NAME: schema-registry
      SCHEMA_REGISTRY_KAFKASTORE_BOOTSTRAP_SERVERS: 'kafka1:29092,kafka2:29092,kafka3:29092'
      SCHEMA_REGISTRY_LISTENERS: 'http://0.0.0.0:8081'
    depends_on:
      - kafka1
      - kafka2
      - kafka3

networks:
  default:
    name: kafkas
    external: true
This Compose configuration sets up a Kafka cluster comprising three broker nodes (kafka1, kafka2, and kafka3). The three brokers run on different ports (9092, 9093, and 9094) and are configured to work in a cluster, ensuring high availability and failover capabilities. Various configurations dictate their roles, inter-broker communication mechanisms, and more.
With your environment prepared and your Docker Compose configuration in hand, deploying the Kafka cluster is a straightforward process:
1. Navigate to the directory containing your docker-compose.yml file.
2. Run the following command to launch your Kafka cluster:
docker-compose up -d
This command instructs Docker to start the services defined in the docker-compose.yml , Within moments, you should have a running Kafka cluster.
Deploying the Kafka Python Demo app
The Kafka Python Demo App will act as both a producer, sending messages to our Kafka cluster, and a consumer, retrieving those messages. This section will guide you through creating the application, dockerizing it, and then deploying it.
Create a new file named producer_consumer.py:
from flask import Flask, jsonify, request
from kafka import KafkaProducer, KafkaConsumer

print("Starting Kafka Python App...")

BROKER_ADDRESSES = ["kafka1:29092", "kafka2:29092", "kafka3:29092"]

TOPIC = 'test_topic'

# Producer configuration
producer = KafkaProducer(
    bootstrap_servers=BROKER_ADDRESSES,
    client_id='python-producer',
    value_serializer=lambda v: str(v).encode('utf-8'),
    key_serializer=lambda k: str(k).encode('utf-8')
)

# Consumer configuration
consumer = KafkaConsumer(
    TOPIC,
    bootstrap_servers=BROKER_ADDRESSES,
    group_id='python-consumer',
    auto_offset_reset='earliest',
    value_deserializer=lambda x: x.decode('utf-8'),
    key_deserializer=lambda x: x.decode('utf-8')
)

app = Flask(__name__)
counter = 0  # global counter

@app.route("/")
def trigger_kafka_interaction():
    global counter
    counter += 1

    try:
        # Produce message
        key = f"key-{counter}"
        value = f"value-{counter}"
        producer.send(TOPIC, key=key, value=value)
        producer.flush()

        # Consume message (not guaranteed to consume the message just produced)
        msg = next(consumer)

        key_str = msg.key
        value_str = msg.value
        counter += 1
        return jsonify(status="success", key=key_str, value=value_str, count=counter)

    except StopIteration:
        return jsonify(status="success", message="Message produced but not consumed yet.")
    except Exception as e:
        return jsonify(status="error", message=str(e))

if __name__ == "__main__":
    app.run(host="0.0.0.0", port=5050)
This script initializes a Kafka producer and consumer, connects them to our brokers, and then sends and receives a simple message each time increasing the message counter.
To run our application inside a Docker container, Create a new file named `Dockerfile` in the same directory:
FROM python:3.8-slim

WORKDIR /app
EXPOSE 5050

# Install dependencies
RUN pip install kafka-python
RUN pip install Flask

# Copy scripts
COPY producer_consumer.py /app

CMD ["python", "/app/producer_consumer.py"]
This Dockerfile sets up a minimal Python environment, installs the kafka-python and flask libraries, and then runs our script.
With the application and Dockerfile in place, it’s time to build and deploy the container:
docker build -t kafka-python-app .
Then run the Docker container:
docker run -p 5050:5050 –network=kafkas kafka-python-app
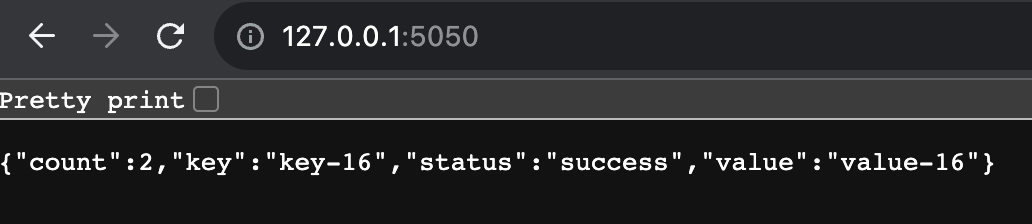
The --network=kafkas flag ensures the container runs on the same network as our Kafka cluster, enabling smooth communication between the Python app and the Kafka brokers. If all is deploying as planned you should now see some json output from the Python app by visiting https://127.0.0.1:5050 in a browser.
Auto-Instrumenting OpenTelemetry Magic
Now is where the fun begins, we are going to deploy OpenTelemetry on the Kafka cluster using the Lumigo Java Distro and Lumigo Python Distro without writing a single line of code!
Log into Lumigo and retrieve your Lumigo Token, we are going to need to set that as an environmental variable on all the containers. Next we need to retrieve the Lumigo Java distro so that we can reference it as a volume within the docker-compose.yaml
wget https://github.com/lumigo-io/opentelemetry-java-distro/releases/download/v0.6.0/lumigo-opentelemetry-0.6.0.jar
docker compose down the Kafka cluster if its still running, then open the docker-compose.yaml file and edit each Kafka service so that each one has the following volumes and environment variables:
volumes:

– /{absolute path}/lumigo-opentelemetry-0.6.0.jar:/app/lumigo-opentelemetry.jar

environment:

KAFKA_NODE_ID: 1

KAFKA_CONTROLLER_LISTENER_NAMES: ‘CONTROLLER’

KAFKA_LISTENER_SECURITY_PROTOCOL_MAP: ‘CONTROLLER:PLAINTEXT,INTERNAL:PLAINTEXT,EXTERNAL:PLAINTEXT’

KAFKA_LISTENERS: ‘INTERNAL://kafka1:29092,CONTROLLER://kafka1:29093,EXTERNAL://0.0.0.0:9092’

KAFKA_ADVERTISED_LISTENERS: ‘INTERNAL://kafka1:29092,EXTERNAL://localhost:9092’

KAFKA_INTER_BROKER_LISTENER_NAME: ‘INTERNAL’

KAFKA_CONTROLLER_QUORUM_VOTERS: ‘1@kafka1:29093,2@kafka2:29093,3@kafka3:29093’

KAFKA_PROCESS_ROLES: ‘broker,controller’

KAFKA_GROUP_INITIAL_REBALANCE_DELAY_MS: 0

KAFKA_OFFSETS_TOPIC_REPLICATION_FACTOR: 3

KAFKA_TRANSACTION_STATE_LOG_REPLICATION_FACTOR: 3

CLUSTER_ID: ‘BHogVA6JTtCQrN8kJPEpMQ==’

KAFKA_LOG_DIRS: ‘/tmp/kraft-combined-logs’

LUMIGO_TRACER_TOKEN: ‘{Lumigo Token}’ # Add your Lumigo token here

OTEL_SERVICE_NAME: ‘kafka1’ # Set your desired service name

JAVA_TOOL_OPTIONS: “-javaagent:/app/lumigo-opentelemetry.jar”
Be sure to replace {absolute path} with the location that you ran the wget, this is so the container can reference the library as part of the container environment. Likewise also update the {Lumigo Token} with your respective token, and also change the OTEL_SERVICE_NAME number to correspond with the service its listed on.
One of my favourite things here is that last environment variable, this one line deploys OpenTelemetry automatically for any Java app in the container.
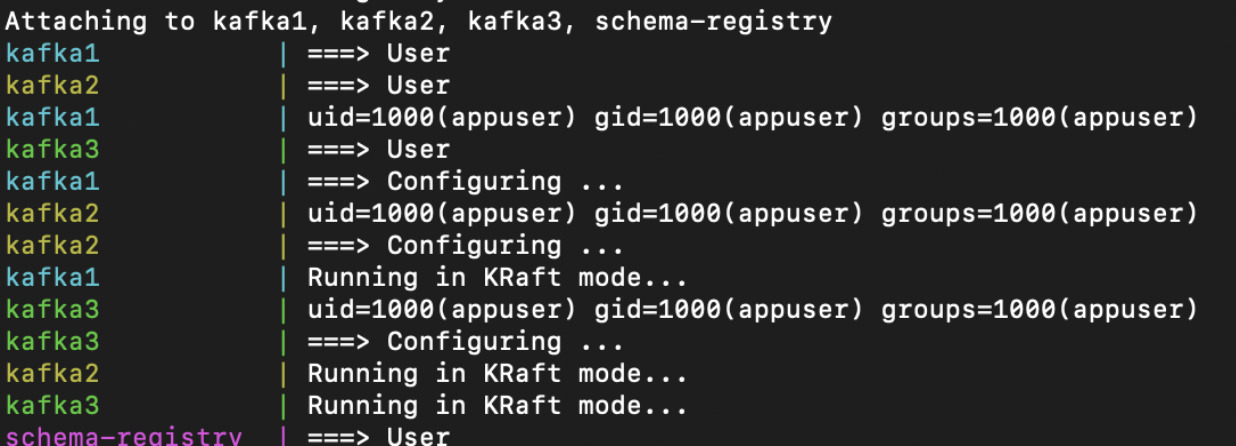
Run another docker compose up -d and wait for the services to deploy and launch.
And the final step is then to redeploy our python app, This part is even easier!
Open the Dockerfile and add the following line after RUN pip install flask
RUN pip install lumigo_opentelemetry
Save the file and then run docker build -t kafka-python-app to build the container again. Once its done you then only need run docker run with some environment variables, including another auto-magic OpenTelemetry instrumentation.
docker run -p 5050:5050 --network=kafkas \
-e LUMIGO_TRACER_TOKEN={Lumigo Token} \
-e OTEL_SERVICE_NAME=kafka_demo \
-e AUTOWRAPT_BOOTSTRAP=lumigo_opentelemetry \
kafka-python-app
The only thing to do here beyond hitting enter is to update the {Lumigo Token}with your Lumigo Token… and thats it!
Refresh the demo app url http://127.0.0.1:5050 a few times and then you should see data appearing within your Lumigo login
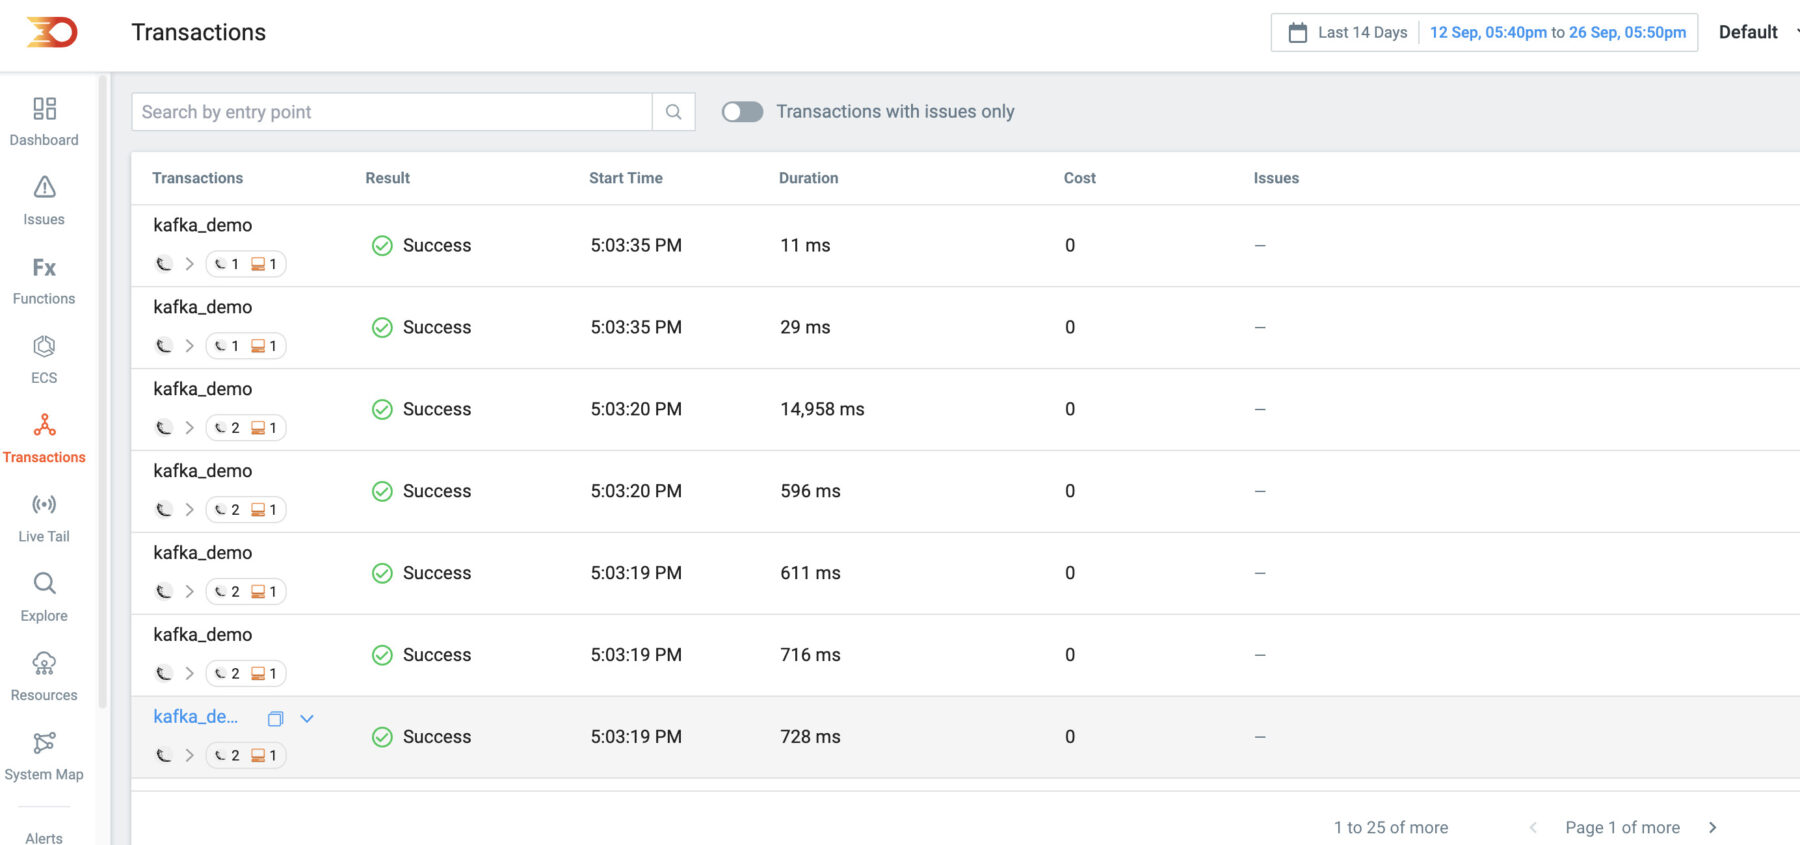
One of the highlights of this deployment is the integration of the Lumigo Java distribution within each Kafka instance, as well as the Python app distribution. Thanks to auto-instrumentation, we gain a clear, end-to-end trace from the Python application to Kafka, complete with the payload body from the request!
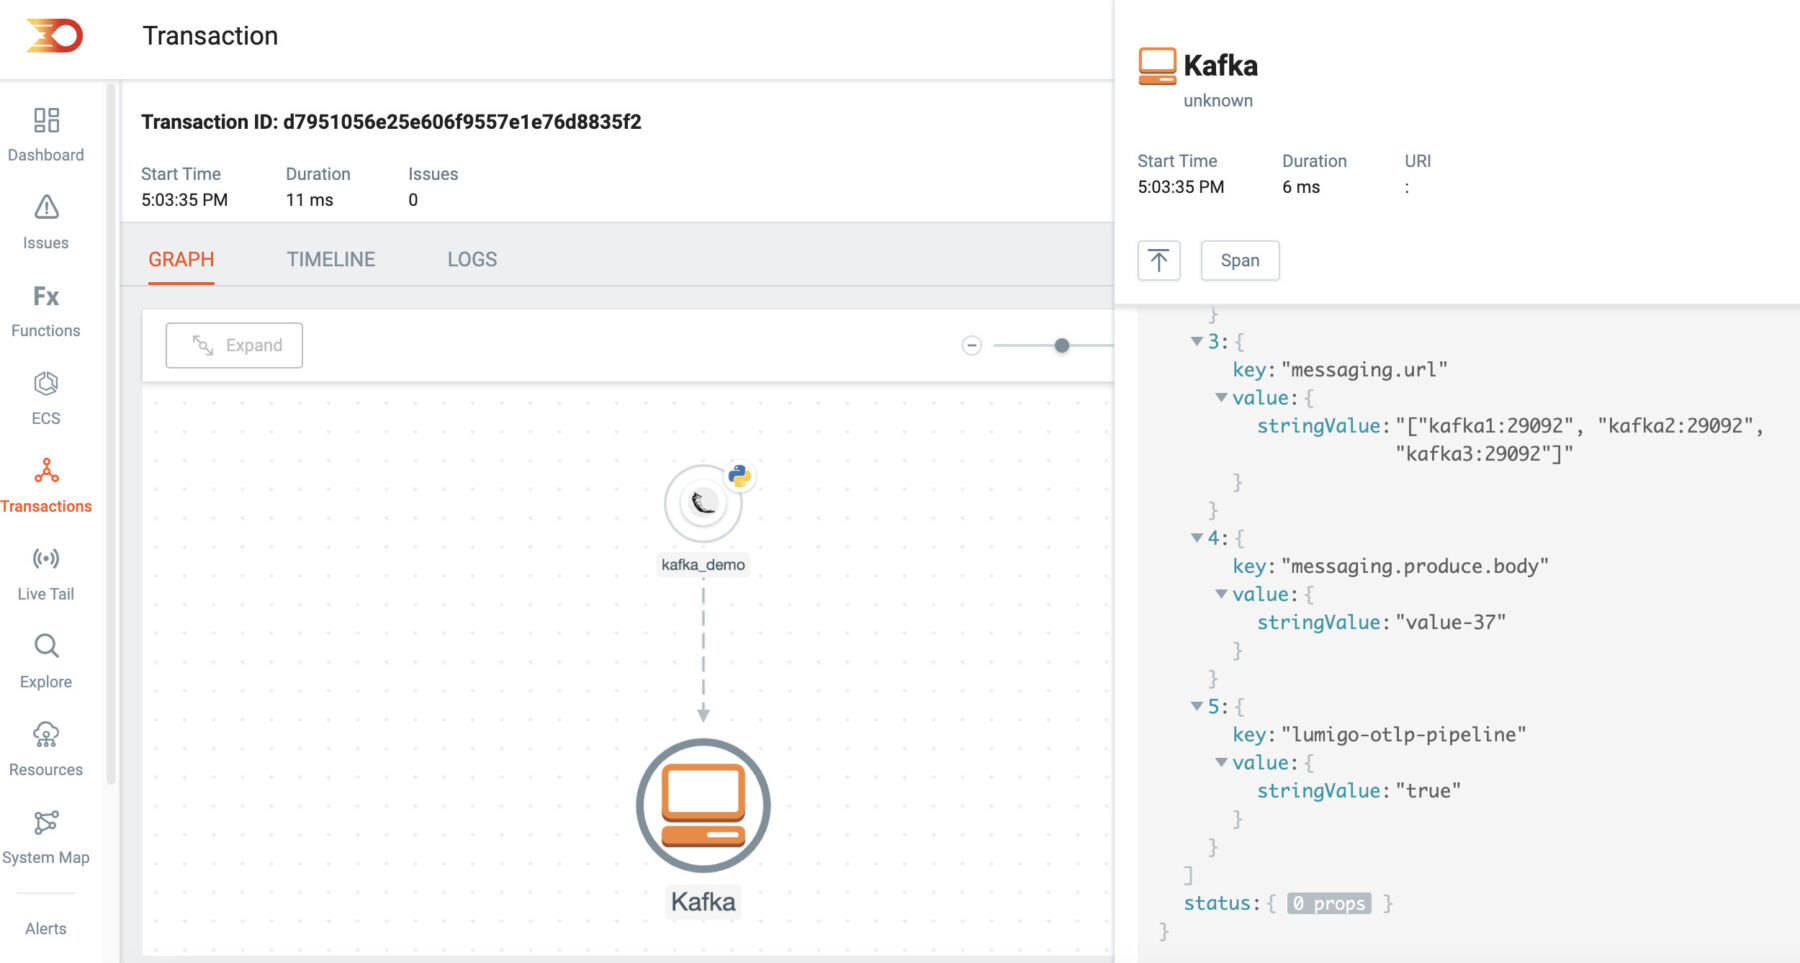
Special mention here too for the Lumigo Python Distro additional enriched trace support for the kafka_python and flask libraries. These are but a few of many commonly utilized Open Source libraries we have additional support for, enabling a more comprehensive view of the data and runtime information encapsulated from within these libraries.
Remember to clean up your dev env
In this journey through auto-instrumenting OpenTelemetry for Kafka, we’ve seen the speed that Lumigo brings to the table. By combining a containerized Kafka cluster with a Python application, we demonstrated how effortless it is to monitor and trace across different languages. The magic lies in Lumigo’s ability to deploy OpenTelemetry in mere moments with just a few clicks.
If this sparked your curiosity and you’re keen to take your observability to the next level, I encourage you to try it for yourself. See firsthand the difference Lumigo can make in your application monitoring journey. Sign up for a Lumigo account today and start benefiting from being able to deploy OpenTelemetry at the speed of deployment.