May 04 2021

When it comes to performance, AWS Lambda gives you a single configuration to control the performance and cost of your Lambda functions – by adjusting the memory allocation setting. The more memory, the more CPU resource and network bandwidth the function receives but also the higher cost per millisecond of execution time.
For CPU-intensive workloads, raising the memory allocation setting is a great way to give the function more power to complete the workload quicker. However, most serverless applications also need to perform IO operations such as calling other AWS or SaaS services. Often, when performance issues arise in these serverless applications, the root cause can be traced back to the response time from these IO operations. Sadly, having more CPU doesn’t help here as the additional CPU resource would simply go to waste as the function waits for a response from, say, a DynamoDB query. How can we quickly identify the root cause for performance issues in our serverless applications and identify these slow dependencies?
Another common challenge when it comes to optimizing the performance of Lambda is around cold starts. That is, the first request for a newly created Lambda execution environment takes longer because there are additional steps involved, such as initializing the runtime and your application dependencies. Once warmed, Lambda’s performance is on-par with serverful applications (whether they’re running in containers or on EC2 instances). But cold starts still impact the tail latency for many applications and is a particular concern for user-facing APIs where slow response time can negatively impact user experience and can directly affect your bottom line!
In this post, let’s look at three major ways you can improve the performance of your Lambda functions, starting with…
1. Eliminating Cold Starts
So much has been written about Lambda cold starts. It’s easily one of the most talked-about and yet, misunderstood topics when it comes to Lambda. Depending on who you talk to, you will likely get different advice on how best to reduce cold starts.
In this post, I will share with you everything I have learned about cold starts in the last few years and back it up with some data.
What are Lambda cold starts?
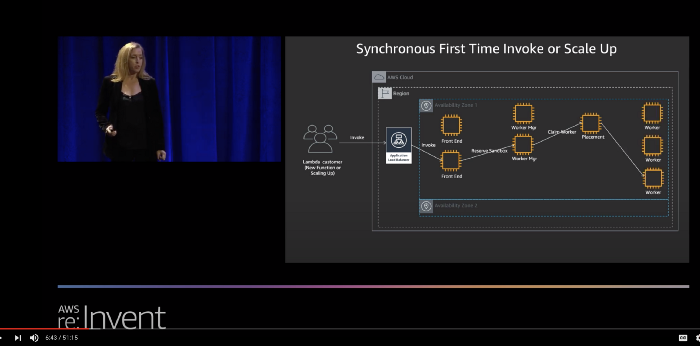
Lambda automatically scales the number of workers that are running your code based on traffic. As mentioned above, a “cold start” is the 1st request that a new Lambda worker handles. This request takes longer to process because the Lambda service needs to:
- find a space in its EC2 fleet to allocate the worker
- initialize the runtime environment
- initialize your function module
before it can pass the request to your handler function. If you want to learn more about this process, then check out this talk from re:invent 2019 (around the 5:46 mark).
You can see these steps in an X-Ray trace for a cold start, although step 1 and step 2 are not explicitly captured in the trace. We could, however, infer their duration from the available information. For example, in the X-Ray trace below, we can infer that step 1 and step 2 took a total of ~80ms, while step 3 took 116ms.

How long step 1 and step 2 takes are mostly outside of your control. It’s also an area where AWS has optimized aggressively. Over the years, this part of the cold start has improved significantly across all language runtimes. 12 months ago, this used to average around 150–200ms.
As such, module initialization (step 3) usually accounts for the bulk of cold start durations in the wild. When optimizing cold start durations, this is where you should focus on. As we’ll see later in the post, several factors can affect this initialization time and therefore the total roundtrip time for processing a request during a cold start.
When should you care about cold starts?
For many, cold starts are a non-issue because their primary workload is data processing, so spikes in latency don’t negatively impact user experience.
Or maybe their traffic pattern is so uniform and stable that there are seldom spikes that cause a flurry of cold starts.
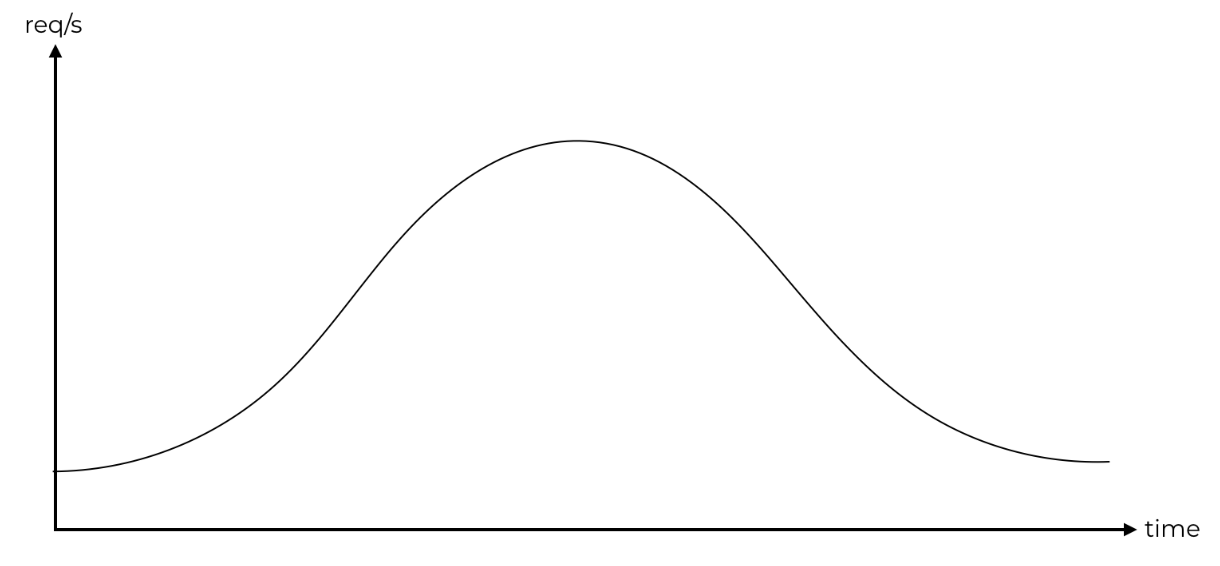
However, user behaviours are difficult to predict and traffic patterns can change over time. Also, even if the overall traffic confirms to a bell curve it doesn’t mean that there are no unpredictable spikes at the individual function’s level where cold starts occur.
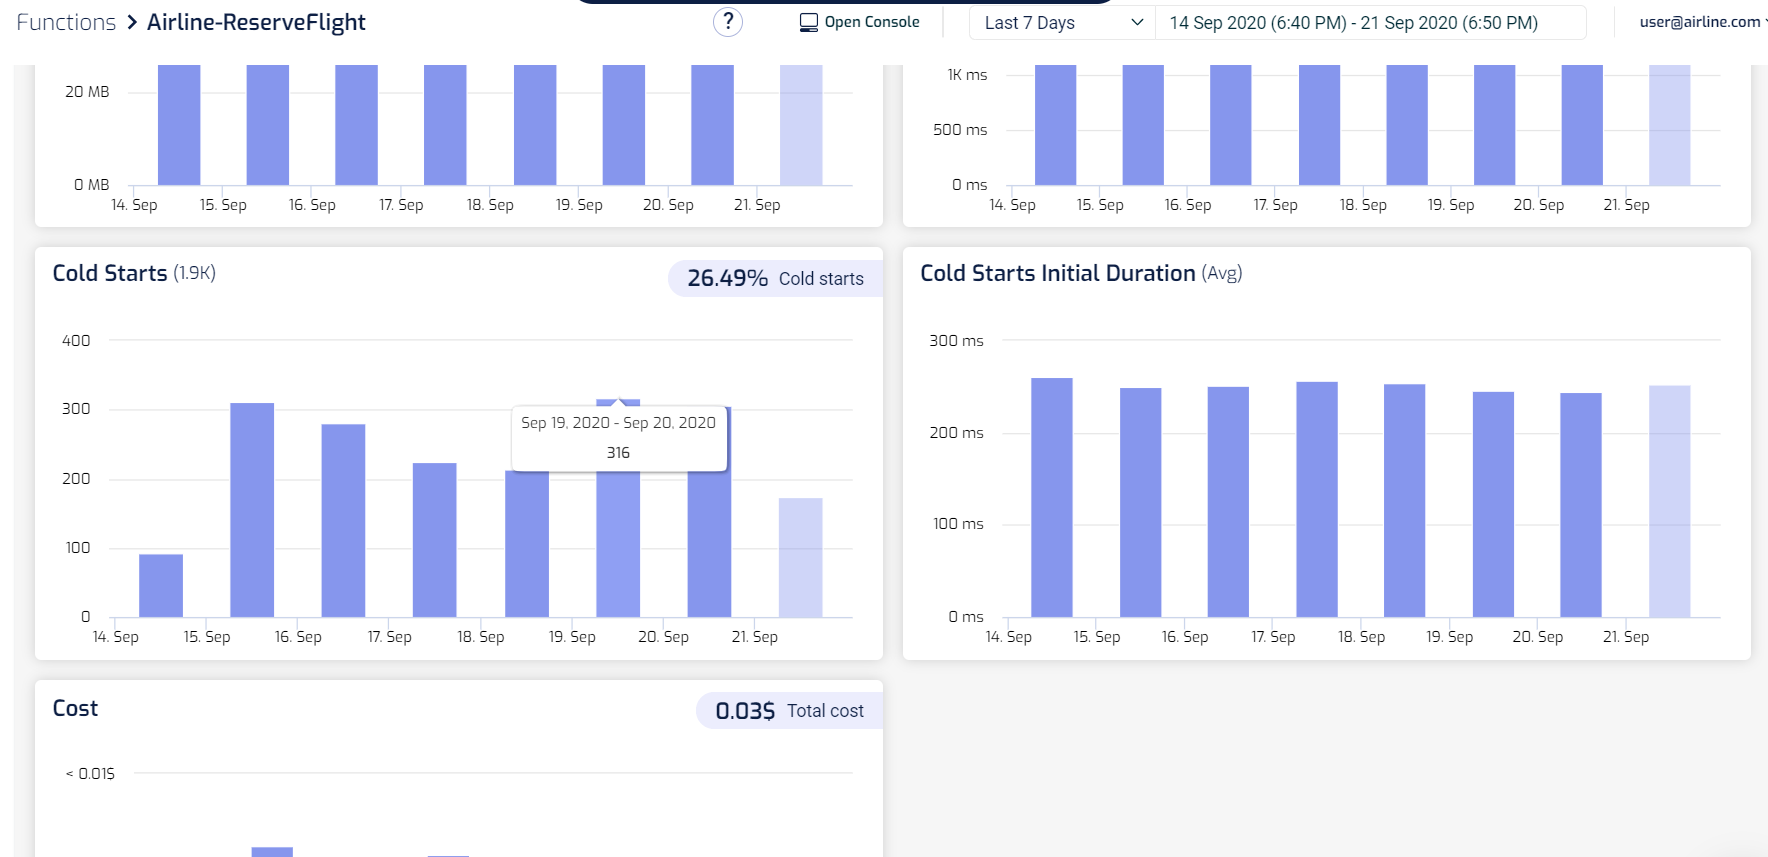
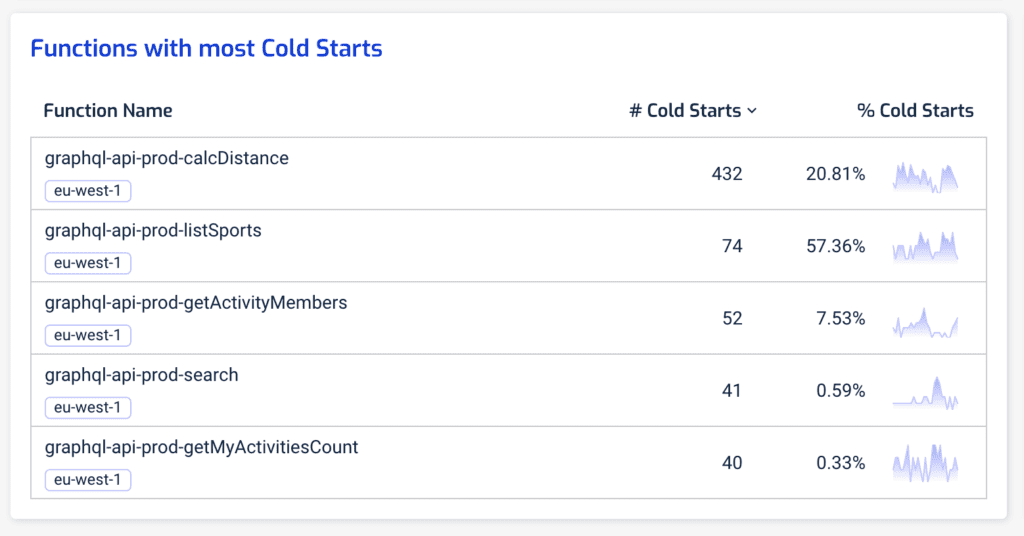
This is why you should let data tell you whether or not cold starts are a problem for you, and where (as in, which functions). In the Lumigo dashboard, you can see at a glance the functions with the most cold starts. When you see functions with a high percentage of cold starts, such as the graphql-api-prod-listSports function below (with 57.36% of its invocations being cold starts), these are functions that you need to pay special attention to!

You can drill into each of these functions further and see how bad these cold starts are in terms of duration. After all, if the cold start duration is short then the cold starts have a much smaller impact on our user experience when they happen. The worst-case scenario is when the cold start duration is long and cold starts happen frequently!
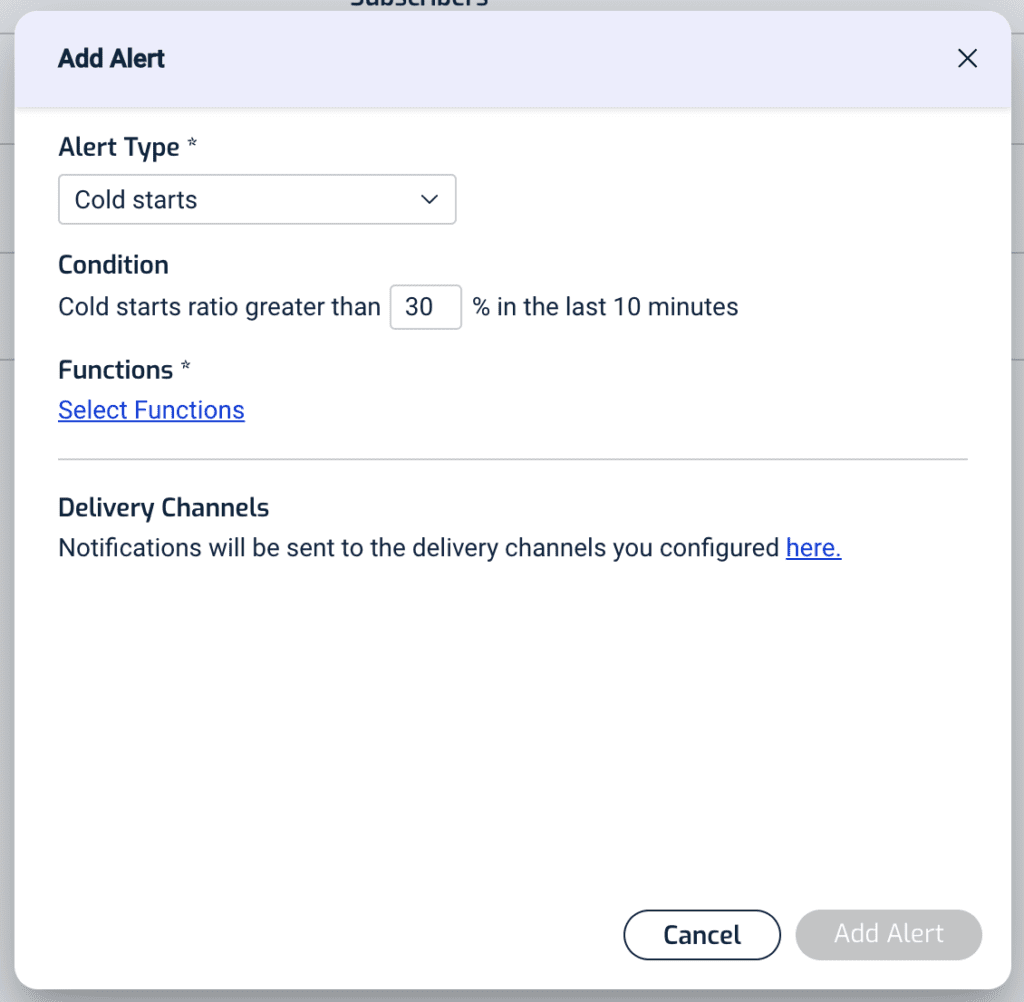
Furthermore, you can set up alerts in Lumigo so you can be notified when your functions experience a high percentage of cold starts. This is a great way to keep an eye on those user-facing functions where you’re concerned about end-to-end latency. Maybe cold starts are not an issue for you today, but maybe they will be in the future if user behaviours and traffic patterns change. These alerts will tell you which functions are experiencing a high percentage of cold starts, and so you can prioritize your optimization efforts on those functions.
One way to eliminate cold starts altogether is to use Provisioned Concurrency, which you can read all about here. As I explained in that post, there are many caveats you need to consider when using Provisioned Concurrency and they do come with a certain amount of operational as well as cost overhead. This is why they should be used as a last resort rather than your first step.
In most cases, it’s possible to optimize your function so that even the cold start durations fall within the acceptable latency range (e.g. 99 percentile latency of 1 second). After all, if cold starts are fast enough that users don’t notice them, then you probably shouldn’t worry too much about them either.
Here I’m going to explain the different factors that affect the cold start duration so you can formulate an optimization strategy that works.
For instance, many people would tell you that you should use a higher memory size to improve cold start duration. Turns out, that doesn’t work, because of this one interesting caveat…
Module initialization is always run at full power
Kudos to Michael Hart for this nugget of information, even though he was clearly abusing it for fun & profit!
Because of this, adding more memory is NOT GOING TO improve your cold start time. This is further backed up by this analysis by Mikhail Shilkov, which also found that memory size has no meaningful impact on the cold start time for most language runtimes. However, .Net functions are the exceptions, and adding more memory does significantly improve their cold start times.
Another facet you need to consider is that…
There are two “types” of cold starts
Another wonderful insight from Michael Hart, who noticed that there are noticeable differences between:
- cold starts that happen immediately after a code change
- other cold starts (e.g. when Lambda needs to scale up the number of workers to match traffic demand)
Aha! Here’s the kicker – the *type* of cold start makes a difference. If it’s a code deploy, then it’s large (400ms). If it’s just an env update, it’s… maybe nothing! (still collating data) Which makes you think, what’s a “normal” cold start that a user would see?
— Michael Hart (@hichaelmart) February 11, 2020
Perhaps there are some additional steps that need to be performed during the first cold start after a code deployment. Hence why the first cold start after a code change takes longer than the other cold starts.
In practice, most of the cold starts you will see in the wild will be of the 2nd type and it’s where we should focus on. However, I was really intrigued by this discovery and ran several experiments myself.
The big fat experiment
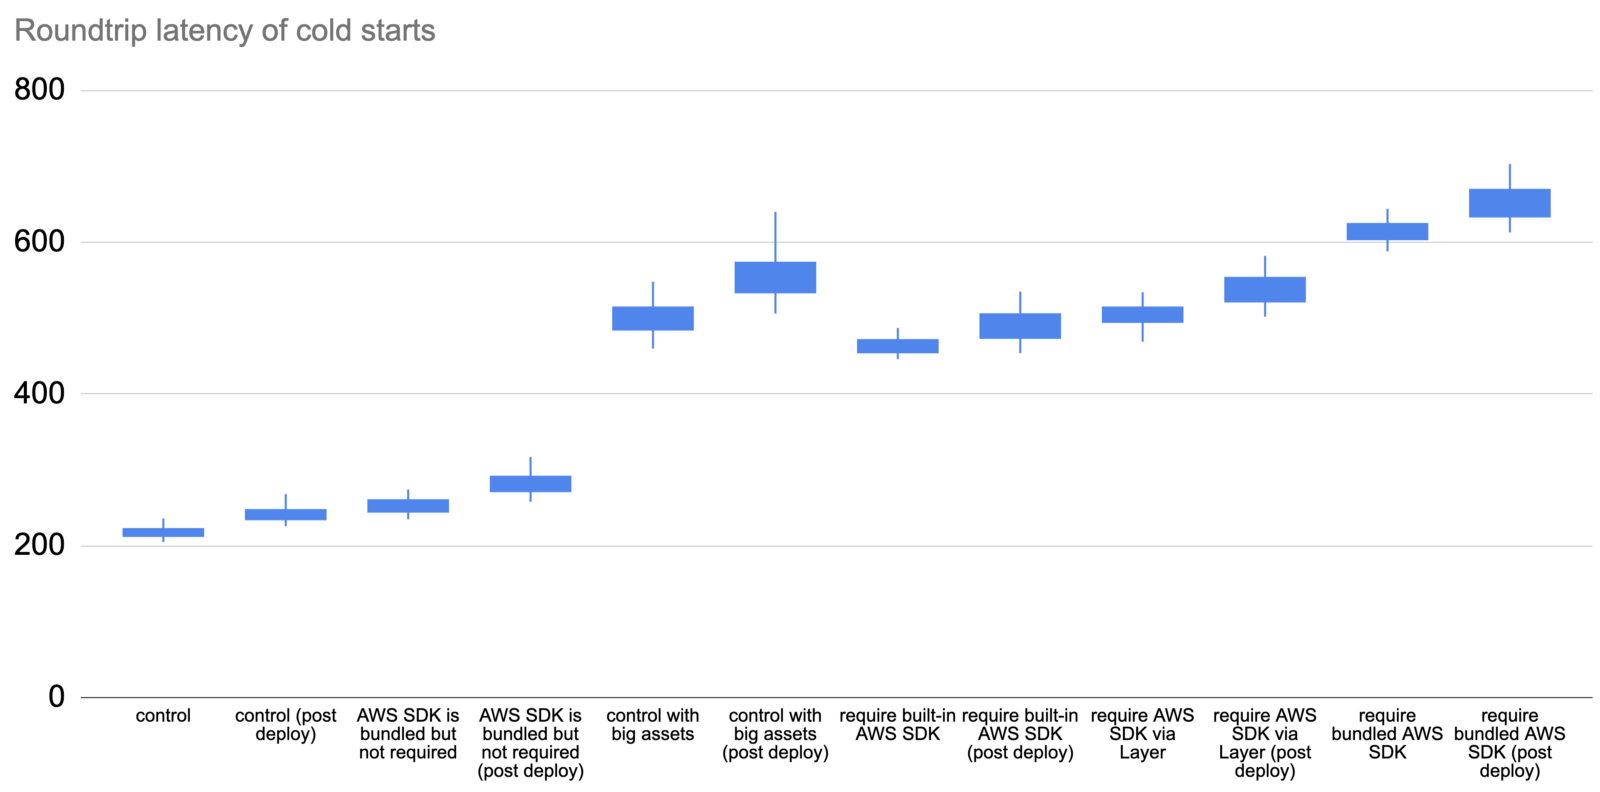
In one such experiment, I measured the roundtrip duration for a few different functions:
control— a hello world function with no dependencies whatsoever.
module.exports.handler = async event => {
  return {
    statusCode: 200,
    body: '{}'
  }
}
AWS SDK is bundled but not required— the same function as control, but the deployment artefact includes the Node.js AWS SDK (even though the function doesn’t actually require it), which results in a 9.5MB deployment artefact.control with big assets— the same function as control, but the deployment artefact includes two large MP3 files, which results in a 60.2MB deployment artefact.require bundled AWS SDK— a function that requires the AWS SDK duration module initialization. This function bundles the AWS SDK as part of its deployment artefact (9.5MB).
const AWS = require('aws-sdk')module.exports.handler = async event => {
  return {
    statusCode: 200,
    body: '{}'
  }
}
require AWS SDK via Layer— the same function asrequire bundled AWS SDKbut the AWS SDK is not bundled in the deployment artefact. Instead, the AWS SDK is injected via a Lambda layer.require built-in AWS SDK— the same function asrequire bundled AWS SDKbut the AWS SDK is not bundled in the deployment artefact. Instead, it’s using the AWS SDK that is included in the Lambda execution environment.
For each of these functions, I collected 200 data points for the post deploy cold starts (type 1) and 1000 data points for the other cold starts (type 2). The results are as follows.

There are a few things you can learn from these data.
Type 1 is slower
Type 1 cold starts (immediately after a code deployment) consistently take longer than type 2, especially as we look at the tail latencies (p99).
Deployment artefact size matters
The size of the artefact has an impact on cold start even if the function does not actively require them. The following three tests all have the same function code:
module.exports.handler = async event => {
  return {
    statusCode: 200,
    body: '{}'
  }
}
The only difference is in the size of the deployment artefact. As you can see below, bundling the Node.js AWS SDK in the deployment artefact adds 20–60ms to the roundtrip latency for a cold start. But when that artefact gets much bigger, so too does the latency impact.
When the artefact is 60MB, this adds a whopping 250–450ms!

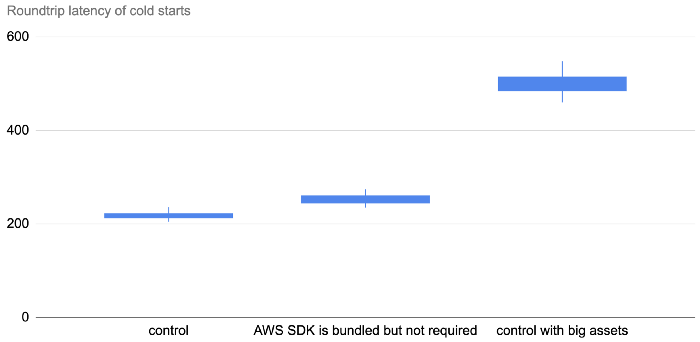
So, deployment size does impact cold start, but the impact is somewhat minimal if it’s just the AWS SDK.
Where the dependency is loaded from matters
Oftentimes, the AWS SDK is an unavoidable dependency. But turns out where the AWS SDK comes from matters too. It’s fastest to use the AWS SDK that’s built into the Lambda execution environment. Interestingly, it’s also much faster to load the AWS SDK via Layers than it is when you bundle it in the deployment artefact! The difference is much more significant than the aforementioned 20–60ms, which suggests that there are additional factors at play.

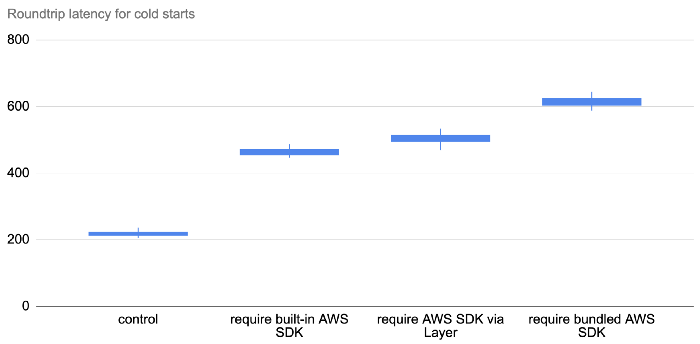
Before you decide to never bundle the AWS SDK in your deployment artefacts, there are other factors to consider.
For example, if you use the built-in AWS SDK then you effectively lose immutable infrastructure. There have also been instances when people’s functions suddenly break when AWS upgraded the version of the AWS SDK. Read this post for more details.
If you use Lambda layers, then you must carry additional operational overhead since the Lambda layer requires a separate deployment and you still have to update every function that references this layer. Read this post for why Lambda Layers is not a silver bullet and should be used sparingly.
That being said, for serverless framework users, there is a clever plugin called serverless-layers which sidesteps a lot of the operational issues with Lambda Layers. Effectively, it doesn’t use Layers as a way to share code but use it purely as an optimization. During each deployment, it checks if your dependencies have changed, and if so, package and deploy the dependencies as a Lambda layer (just for that project) and update all the functions to reference the layer.
But wait! There’s more.
What you require matters
Just what is taking the time when this line of code runs during module initialization?
const AWS = require('aws-sdk')
Behind the scenes, the Node runtime must resolve the dependency and check if aws-sdk exists in any of the paths on the NODE_PATH. And when the module folder is found, it has to run the initialization logic on the aws-sdk module and resolve all of its dependencies and so on.
All these takes CPU cycles and filesystem IO calls, and that’s where we incur the latency overhead.
So, if your function just needs the DynamoDB client then you can save yourself a lot of cold start time by requiring ONLY the DynamoDB client.
const DynamoDB = require('aws-sdk/clients/dynamodb')

And since a lot of the cold start time is going towards resolving dependencies, what if we remove the need for runtime dependency resolution altogether?
The webpack effect
By using a bundler like webpack, we can resolve all the dependencies ahead of time and shake them down to only the code that we actually need.
This creates savings in two ways:
- smaller deployment artefact
- no runtime resolution
And the result is awesome!

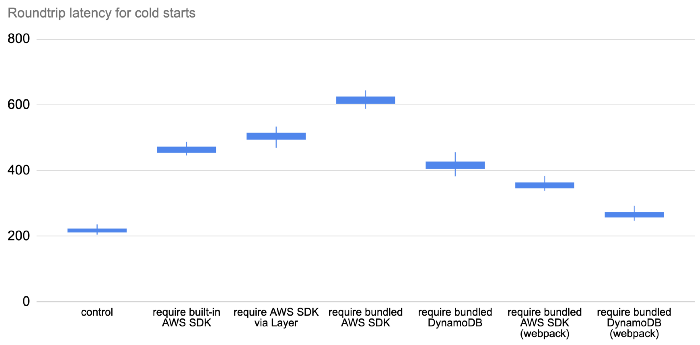
So, if you’re running Node.js and want to minimize your Lambda cold start time. Then the most effective thing you can do is to be mindful of what you require in your code and then apply webpack. It addresses several of the contributing factors to cold time latency simultaneously.
For the Serverless framework users out there, you can use the serverless-webpack plugin to do this for you.
For Java functions, have a look at this post by CapitalOne on some tips for reducing cold starts.
Eliminating cold starts
If it’s not enough to make cold starts faster and you must eliminate them altogether, then you can use Provisioned Concurrency instead. This might be the case if you have a strict latency requirement, or maybe you have to deal with inter-microservice calls where cold starts can stack up. Whatever the case, you should check out this post to see how Provisioned Concurrency works and some caveats to keep in mind when you use it.
As mentioned before, Lumigo offers a lot of tools to help you identify functions that are worst affected by cold starts and are therefore the prime candidates for Provisioned Concurrency. The Lumigo dashboard is usually my first port-of-call when I want to find out which functions to use Provisioned Concurrency on and how many instances of Provisioned Concurrency I need.
Click here to register a free account with Lumigo and let us help you eliminate Lambda cold starts.
2. Debugging AWS Lambda Timeouts
Some time ago, a colleague of mine received an alert through PagerDuty. There was a spike in error rate for one of the Lambda functions his team looks after. He jumped onto the AWS console right away and confirmed that there was indeed a problem. The next logical step was to check the logs to see what the problem was. But he found nothing.
And so began an hour-long ghost hunt to find clues as to what was failing and why there were no error messages. He was growingly ever more frustrated as he was getting nowhere. Was the log collection broken? Were the errors misreported? Is there a problem with CloudWatch or DataDog?
It was at that point, another teammate noticed the function’s Max Duration metric had flatlined at 6 secs around the same time as the spike in errors.
“Could the function have timed out?”
“Ahh, of course! That must be it!”
Once they realized the problem was timeouts, they were able to find those Tasks timed out after 6.00 seconds error messages in the logs.
If you have worked with Lambda for some time then this might be a familiar story. Unfortunately, when a Lambda function times out, it’s one of the trickier problems to debug because:
- Lambda does not report a separate error metric for timeouts, so timeout errors are bundled with other generic errors.
- Lambda functions often have to perform multiple IO operations during an invocation, so there is more than one potential culprit.
- You’re entirely relying on the absence of a signpost to tell you that the function timed out waiting for something to finish, which requires a lot of discipline to signpost the start and end of every operation consistently.
In this section, I’ll explore a few ways to debug Lambda timeouts. I also hosted a live webinar about this topic on August 19, 2020. You can watch it here.
Detect timeouts
The story I shared with you earlier illustrates the 1st challenge with Lambda timeouts — that it can be tricky to identify. Here are a couple of ways that can help you spot Lambda timeouts quickly.
Look at Max Duration
As I mentioned before, the biggest telltale sign of timeout is by looking at a function’s Max Duration metric. If it flatlines like this and coincides with a rise in Error count then the invocations are likely timed out.

Look out for “Task timed out after”
As the problem is that Lambda does not report a separate Timeout metric, you can make your own with metric filters. Use the pattern Task timed out after against a Lambda function’s log group and you can create a count metric for timeouts.
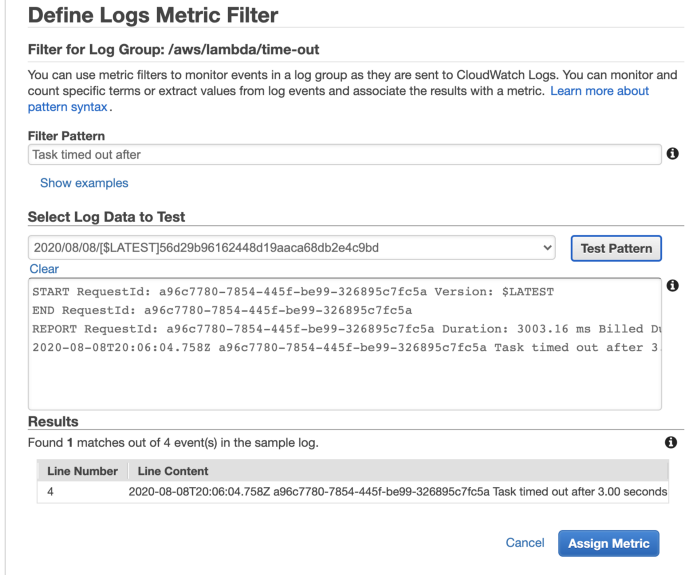
This approach is easy to implement but hard to scale with the number of functions. You will need to do this for every function you create.
You can automate this using an EventBridge rule that triggers a Lambda function every time a new CloudWatch log group is created.
source:
   - aws.logs
detail-type:
   - AWS API Call via CloudTrail
detail:
   eventSource:
      - logs.amazonaws.com
   eventName:
      - CreateLogGroup
The Lambda function can create the metric filter programmatically for any log group that starts with the prefix /aws/lambda/ (every Lambda function’s log group starts with this prefix).
Log an error message just before function times out
Many teams would write structured logs in their Lambda function, and set up centralized logging so they can search all their Lambda logs in one convenient place. The log aggregation platform is where they would most likely start their debugging efforts.
When an invocation times out, we don’t have a way to run custom code. We can’t log an error message that tells us that the function has timed out and leave ourselves some context around what it was doing when it timed out. This negates the effort we put into writing useful logs and to centralize them in one place. It’s the reason why my former colleague wasn’t able to identify those errors as timeouts.
So if you can’t run custom code when the function has timed out, then how about running some custom code JUST BEFORE the function times out?
This is how a 3rd-party service such as Lumigo is able to detect timeouts in real-time. You can apply the same technique using middleware engines such as Middy. In fact, the dazn-lambda-powertools has a built-in log-timeout middleware that does exactly this. When you use the dazn-lambda-powertools, you also benefit from other middlewares and utility libraries that make logging and forwarding correlation ID effortless.
Use 3rd-party tools such as Lumigo
Many 3rd-party tools can detect Lambda timeouts in realtime. Lumigo, for instance, would highlight them on the Issues page.

From here, you can drill into the function’s details and see its recent invocations, check its metrics and search its logs.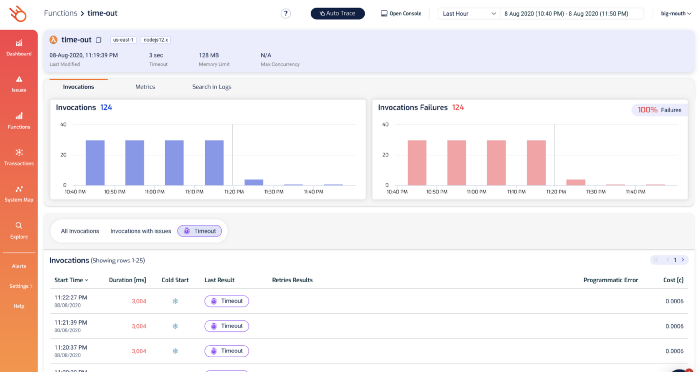
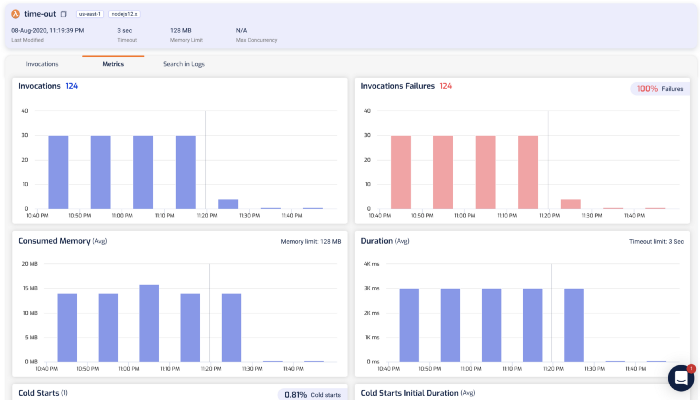
Of course, you can also drill into individual invocations to see what happened.
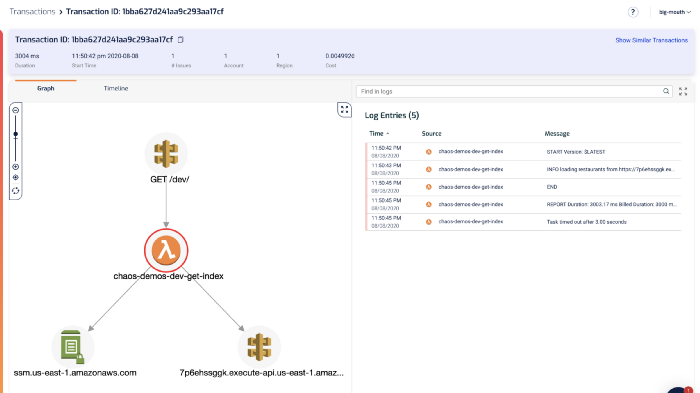
From the log messages on the right, we can see the dreaded Task timed out after 3.00 seconds error message.
The last log message we saw before that was loading restaurants from https://…. That’s a useful signpost that tells us what the function was doing while it timed out. This brings us to the 2nd challenge with debugging Lambda timeouts.
Finding the root cause of the timeout
There are many reasons why a function might time out, but the most likely is that it was waiting on an IO operation to complete. Maybe it was waiting on another service (such as DynamoDB or Stripe) to respond.
Within a Lambda invocation, the function might perform multiple IO operations. To find the root cause of the timeout, we need to figure out which operation was the culprit.
Signposting with logs
The easiest thing you can do is to log a pair of START and END messages around every IO operation. For example:
const start = Date.now()
console.log('starting doSomething')
await doSomething()
const end = Date.now()
const latency = end - start
console.log(`doSomething took ${latency}ms`)
This way, when the function times out, we know what the last IO operation that it started but never finished.
While this approach is easy to implement for individual functions, it’s difficult to scale with the number of functions. It requires too much discipline and maintenance and would not scale as our application becomes more complex.
Also, we can only signpost IO operations that are initiated by our code using this approach. Many libraries and wrappers (such as Middy middlewares) can often initiate IO operations too. We don’t have visibility into how long those operations take.
Use X-Ray
If you use the X-Ray SDK to wrap the HTTP and AWS SDK clients, then X-Ray would effectively do the signposting for you.
Every operation you perform through the instrumented AWS SDK client or HTTP client will be traced. When a function times out before receiving a response to an IO operation, the operation will appear as Pending in an X-Ray trace (see below).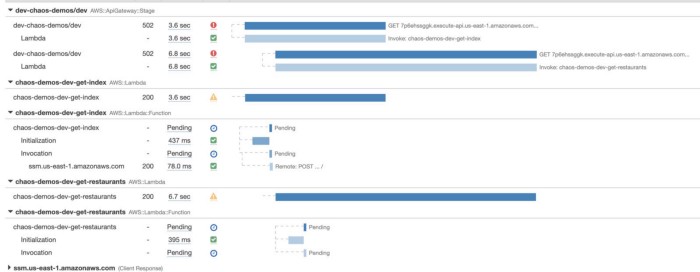
Instrumenting these clients with the X-Ray SDK is far less demanding compared to writing manual log messages.
However, this approach still has a problem with IO operations that are initiated by other libraries. For instance, the function above makes a call to SMS Parameter Store, but it has not been captured because the request was initiated by Middy’s SSM middleware.
Use 3rd party tools such as Lumigo
Lumigo also offers the same timeline view as X-Ray.
From the aforementioned transactions view:

Click on the Timeline tab, and you can see a similar bar graph of what happened during the invocation.

As with X-Ray, we can see that the HTTP request to 7p6ehssggk.execute-api.us-east-1.amazonaws.com never completed (and hence marked as N/A). And therefore it was the reason why this function timed out.
Compared to X-Ray, Lumigo requires no need for manual instrumentation. In fact, if you’re using the Serverless framework, then integrating with Lumigo is as easy as:
- install the
serverless-lumigoplugin - configure the Lumigo token in
serverless.yml
And you get so much more, such as better support for async event sources such as Kinesis and DynamoDB Streams, and the ability to see function logs with the trace segments in one screen. Read my previous post to learn more about how to use Lumigo to debug Lambda performance issues.
Mitigating timeouts
Being able to identify Lambda timeouts and quickly find out the root cause is a great first step to building a more resilient serverless application, but we can do better.
For example, we can use context.getRemainingTimeInMillis() to find out how much time is left in the current invocation and use it to timebox IO operations. This way, instead of letting the function time out, we can reserve some time to perform recovery steps.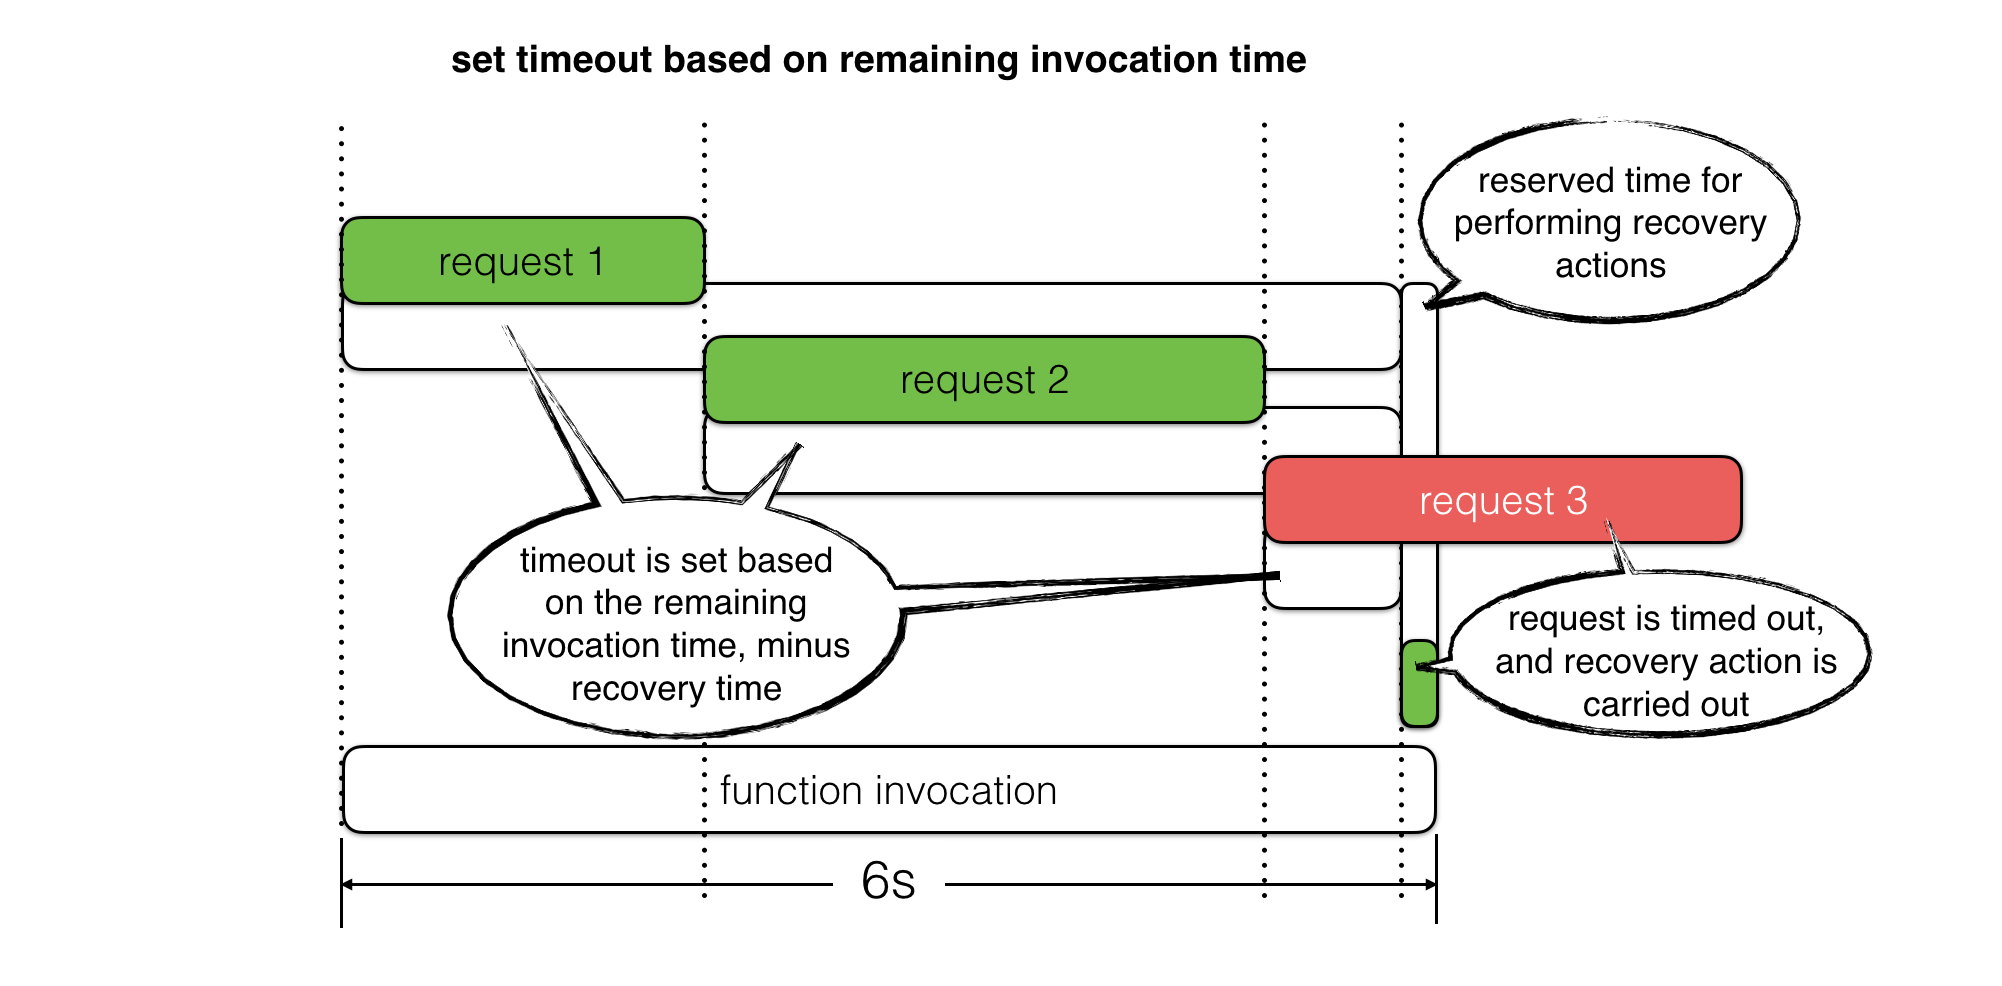
For read operations, we can use fallbacks to return previously cached responses or even a static value as default. For write operations, we can queue up retries where applicable. In both cases, we can use the reserved time to log an error message with as much context as possible and record custom metrics for these timed out operations.
See this post for more details.
3. How to Debug Slow Lambda Response Times
When you build your application on top of Lambda, AWS automatically scales the number of “workers” running your code based on traffic. And by default, your functions are deployed to three Availability Zones (AZs). This gives you a lot of scalability and redundancy out of the box.
When it comes to API functions, every user request is processed by a separate worker. So the API-level concurrency is now handled by the platform. This also helps to simplify your code since you don’t have to worry about managing in-process concurrency. Consequently, gone are the days when an overloaded server means all concurrent requests on the same server will slow down.
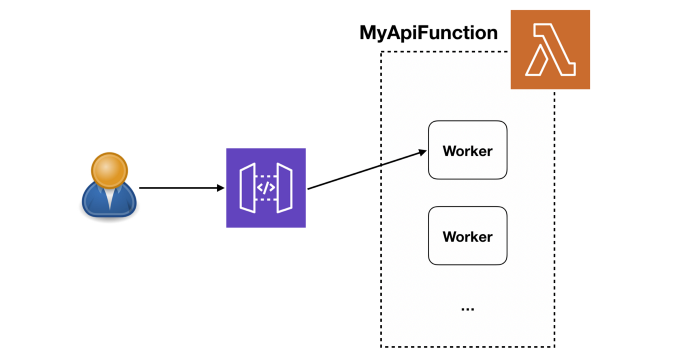
If you want to learn more about how Lambda works under the hood, once again, I strongly recommend watching this session from re:Invent 2019.
Without the CPU contention that often affects serverful applications, the primary cause for slow Lambda response time is elevated latency from services that your functions integrate with.
In my previous post, we discussed different ways you can track the latency to these external services. In this post, let’s dive a bit deeper into how to make the most of these telemetry data to debug Lambda response time issues quickly. If you don’t know how to track the latency of these external services then please check out my last post first.
Now, suppose you have an API that consists of API Gateway, Lambda, and DynamoDB, like the following.

At the macro level, we want to know if there are systemic issues affecting our end-to-end response time. And if so, where is it? Also, if a service we depend on cannot perform at an adequate level, we need to be able to identify them and potentially replace them with alternatives.
So, let’s consider everything that can contribute towards the end-to-end request latency of this simple API.
API Gateway
API Gateway typically has a single-digit ms of latency overhead. It reports a number of system metrics to CloudWatch, including two performance metrics — Latency and IntegrationLatency.

Image source: AWS
Lambda
Lambda functions report their invocation Duration to CloudWatch. During cold starts, this also includes the time it takes to initialize your function module.
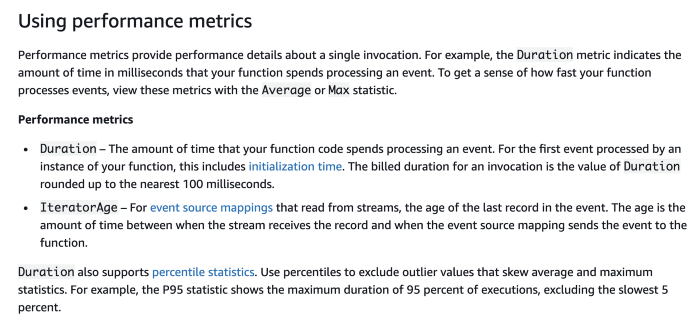
Image source: AWS
However, this Duration metric doesn’t include the time it takes the Lambda service to create and initialize the worker instance. You can see this in an AWS X-Ray trace as the unmarked time before the Initialization segment.
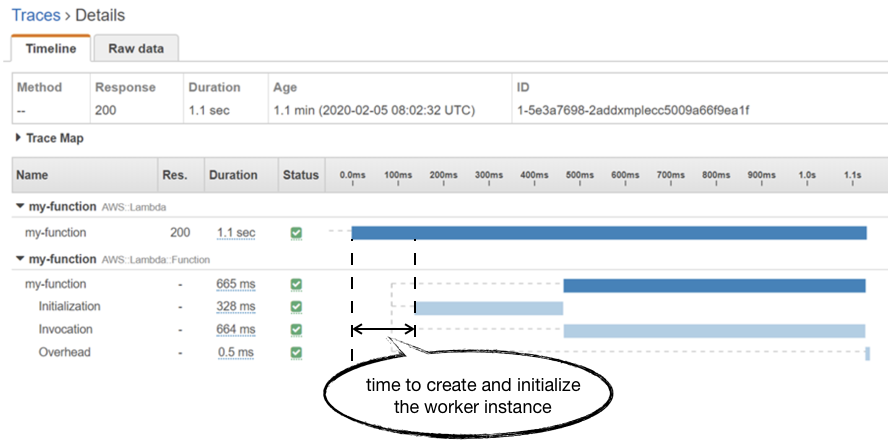
Unfortunately, you don’t have much control over how much time it takes the Lambda service to allocate a new worker. Although some previous analysis by a client of mine seemed to suggest that there’s an inverse relationship to the function’s memory allocation.
In practice, this allocation time seems to average around 150ms and has been steadily improving over the years for all language runtimes. Although we can’t exert any control over how long this process takes, it’s still useful to understand how it impacts our overall response time. If you’re only looking at Lambda’s Duration metric then it’s easy to miss it from your tail (p95/p99/max) latency numbers. This is why, when it comes to API functions, I prefer to use API Gateway’s IntegrationLatency as a proxy for “total response time from Lambda”.
DynamoDB
Just like the other services, DynamoDB also reports a number of system metrics to CloudWatch. The one that’s relevant to us here is the aptly named SuccessfulRequestLatency.
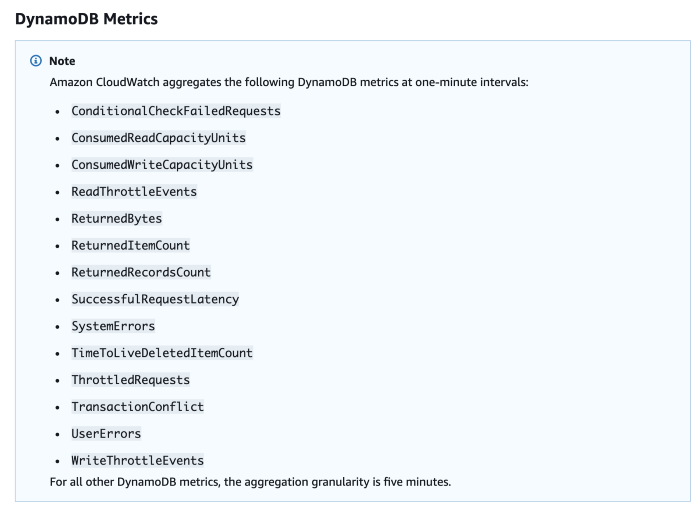
Image source: AWS
SuccessfulRequestLatency tells you how long it took DynamoDB to process a successful request. But what it doesn’t tell you is whether the caller had to perform any retries and any execution time that went into exponential delays.
The AWS SDK performs retries with exponential delay out-of-the-box, and the JavaScript SDK defaults DynamoDB retries to 10 with a starting delay of 50ms. From this, you can work out the maximum delay between each retry as the following.
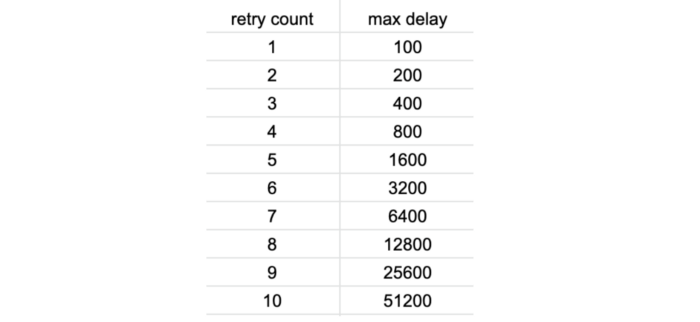
Considering that Lambda (and most frameworks such as Serverless and SAM) defaults to a low timeout value of 3–6 seconds. You only need to be slightly unlucky for a Lambda invocation to timeout after 5 or 6 DynamoDB retries. While it might not happen frequently, many have reported this as the cause for mysterious Lambda timeouts.
When these rare events happen, you would not see a corresponding spike in DynamoDB’s SuccessfulRequestLatency. All the more reason why you should be recording caller-side latency metrics for operations as I discussed in the last post. To record these caller-side latencies as custom metrics, consider using the Embedded Metric Format (EMF).
The onion layers
Armed with telemetry data about every layer of the stack that can introduce latency, we can start to see the end-to-end response time of our API as layers. Not only are the layers themselves useful information, but the gap between each layer is also a valuable data point that can help you identify the root cause for latency problems.
If you have a latency problem, it’ll be in one of these layers!
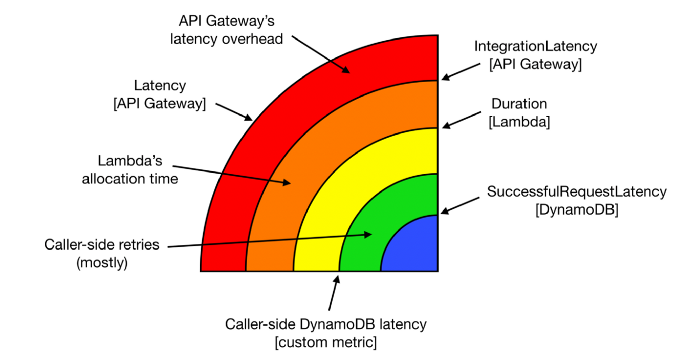
These layers generally translate well to dashboards. For an API endpoint, you can lay these metrics on top of each other and they will typically follow the same general shape.
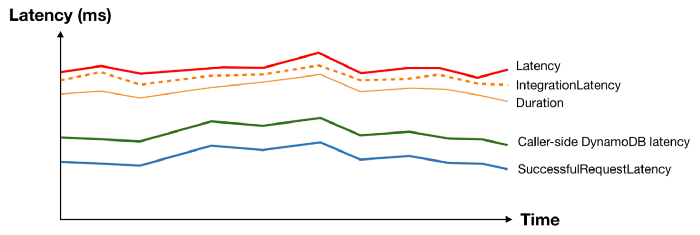
And when something interesting happens at the macro level, you can see patterns and usually spot the “odd one out”.
Take the following latency spike as an example, everything moved apart from DynamoDB’s SuccessfulRequestLatency. What could possibly cause the caller-side DynamoDB latency to spike without affecting the underlying SuccessfulRequestLatency? We don’t know for sure, but a pretty good bet would be caller-side retries and exponential delays.

Now that you have a working theory, you can gather other supporting evidence. For example, by checking to see if there’s a corresponding spike in the no. of DynamoDB throttled events.
Identifying poor-performing dependencies
As mentioned above, another question we often want to answer at the macro-level is “Are any of my dependencies performing poorly?”
To answer this question, we need to see performance metrics for our dependencies at a glance. As we already saw with DynamoDB and Lambda, most AWS services report performance metrics to CloudWatch already. However, we have to track the latency for other services that we depend on. It might be 3rd-party services such as Zuora or Stripe, or it could be internal APIs that are part of our microservices architecture.
We could track the latency of these services ourselves as custom metrics. It’s however not a scalable solution as it will be laborious and easy to miss.
When you look at a Service Map in X-Ray, you do see a high-level performance summary of each component.
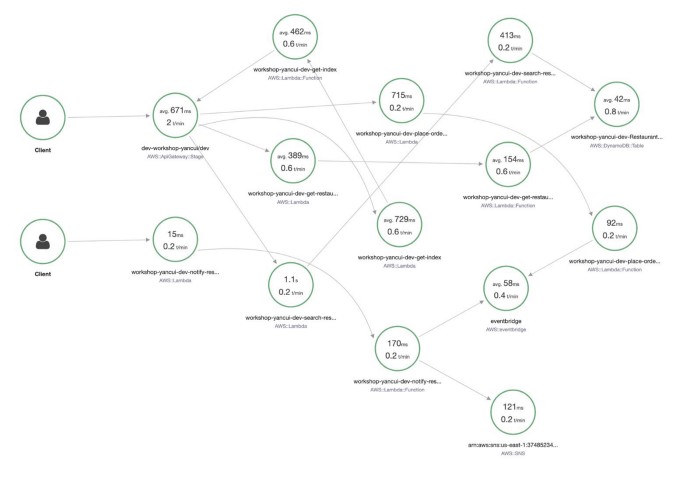
However, as you can see, the information is not organized in such a way that I can easily make sense of. Also, the data is limited to the traces that have been sampled in the selected time range. And whereas CloudWatch Metrics keep the most coarse data (1-hour aggregates) for 15 months, X-Ray keeps traces for only 30 days.
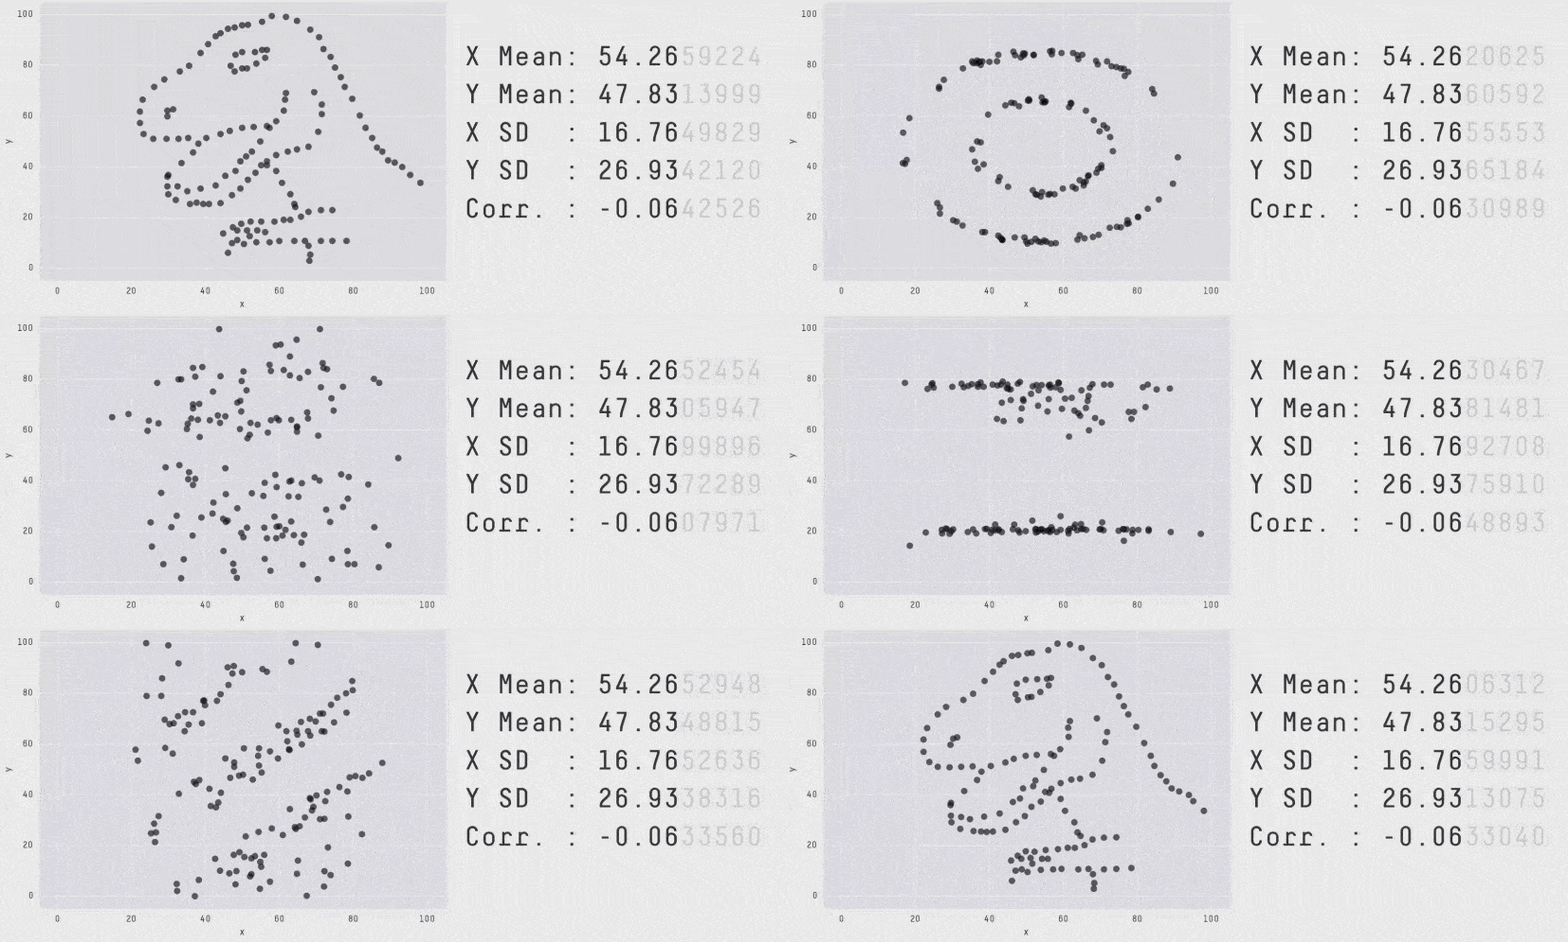
What’s more, the summary shows only average latency, which is not a meaningful measure of how well a service is performing. When measuring latency, always use tail percentile values such as p95 or p99. They tell you the upper bound response time for 95% or 99% of all requests respectively. How many requests had an average latency? Well, in the same way that all the plots below have the same average, there’s no way of knowing how good or bad the latency distribution was by looking at the average latency.
Another problem with X-Ray is that it offers poor support for async event sources. At the time of writing, only SNS is supported, although I do expect this to improve in the future.
And X-Ray does not support any TCP-based transactions. So if you’re using RDS or Elasticache then X-Ray would not be able to trace those transactions.
Generally speaking, I think X-Ray is great when you’re starting out with Lambda. As with most AWS services, it’s great at meeting basic customer needs cheaply. But I often find myself growing beyond X-Ray as my architecture grows and I need more sophisticated tools for more complex serverless applications.
This is where 3rd-party observability tools can add a lot of value, as they tend to provide a more polished developer experience.
Lumigo, for instance, supports SNS, Kinesis, and DynamoDB Streams and can connect Lambda invocations through these async event sources. This allows me to see an entire transaction in my application, including those background tasks that are triggered via DynamoDB Streams. You can sign up for a free Lumigo account here.

It also traces TCP-based transactions, which means I can see requests to RDS and Elasticache in my transactions.
It captures the invocation event for the function, and you can see the request and response to other services including RDS, which makes debugging functions in the wild much easier.
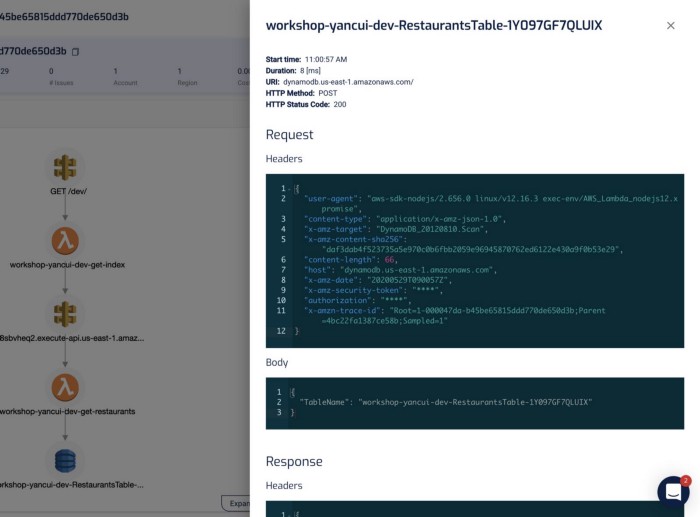
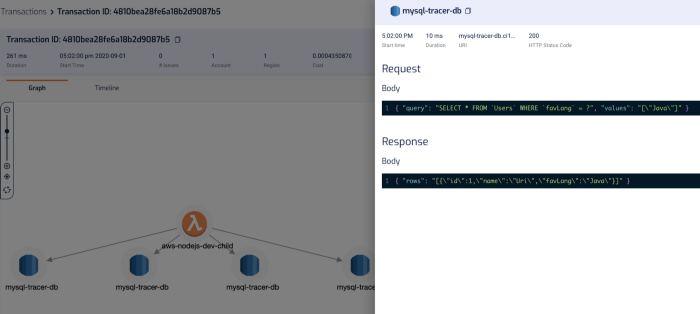
“mm.. why did this code thrown a null reference exception?”
“ahh, because the SQL query didn’t return anything for PatientId! Why is that?!”
“aha, it’s because the user request didn’t pass in a HospitalId, and we are missing some validation logic there, so the code blew up later on when we try to process the SQL response.”
In the transaction timeline, I can also see how long those SQL queries took without having to manually instrument my code.

And, in the Lumigo Dashboard, there’s a Services Latency widget in the dashboard, which lists the tail latency for the services that your Lambda functions integrate with.
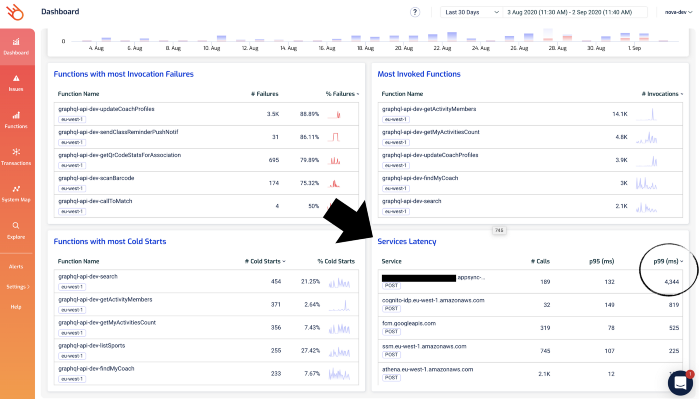
Notice that one of the AppSync endpoints has a high p99 latency? Given that the p95 latency for 189 requests is a respectable 132ms, this is likely an outlier as opposed to a systemic problem.
But nonetheless, it’s something that we want to check out. If you click on the 4344 figure, you’ll be taken to the Explore page and showing just the relevant transactions. Both of these two transactions involved the aforementioned AppSync endpoint.

And this brings us nicely to the micro-level question of “why was this particular request slow?”.
Tracing transactions
The techniques we discussed in the last post can really help you figure out why a particular transaction/request was slow.
For example, by logging latencies manually.
const start = Date.now()
console.log('starting doSomething')
await doSomething()
const end = Date.now()
const latency = end - start
console.log(`doSomething took ${latency}ms`)
Or by using EMF.
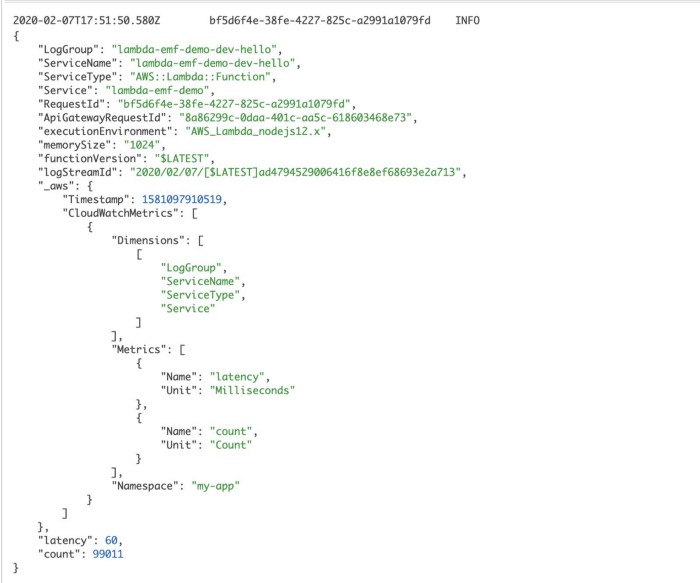
In both cases, we’re leaving some clues in the logs to helps us understand where the time is spent on a particular request.
Both are valuable but are not scalable solutions as you need to manually instrument every single request you make. It’s laborious and hard to enforce, and that means people will forget or cut corners, and the whole thing falls apart.
This is why you should be using tools like X-Ray or Lumigo, which can automate a lot of these for you.
With X-Ray, you still need to write a few lines of code to instrument the AWS SDK and the HTTP module (for Javascript).
const XRay = require('aws-xray-sdk-core')
const AWS = AWSXRay.captureAWS(require('aws-sdk'))
AWSXRay.captureHTTPsGlobal(require('https'))
Once you’re done, X-Ray can start tracing these requests to other services for you. And you can see in the X-Ray console exactly what happened during a Lambda invocation and where did the time go.
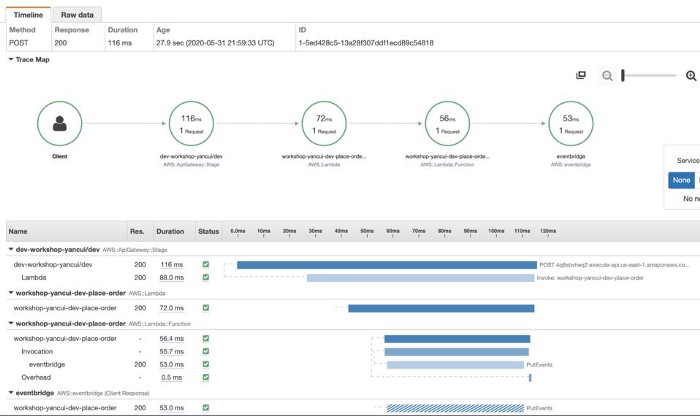
However, as mentioned earlier, X-Ray has poor support for async event sources for Lambda, and do not support TCP-based requests at all.
Also, it only collects metadata about the requests, and not the request and response themselves, which are very useful for debugging problems with the application’s business logic. And while you absolutely log these yourself, you will have to jump between X-Ray and CloudWatch Logs consoles to see both pieces of the puzzle.
Lumigo, on the other hand, shows you the transaction and the Lambda logs (for all the functions that are part of the transaction) side-by-side. This is my favorite feature in Lumigo, as it really helps me get a complete picture of what happened during a transaction.
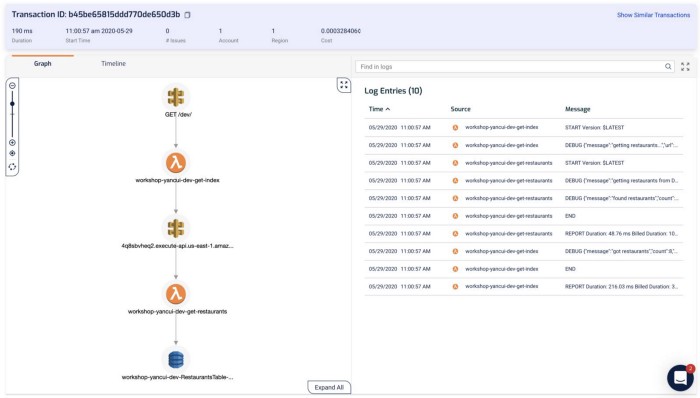
Clicking on each of the components in the graph shows me the request and response to and from that service, which helps me debug problems quickly. If I click on the Lambda functions, I can also see both the invocation event as well as the environment variables that were used during the invocation.
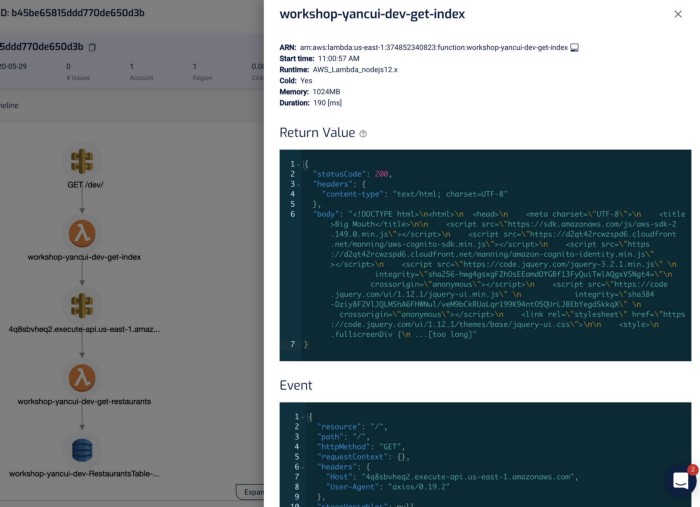
I find this a godsend for reproducing and debugging problems locally. Often, I will use this to capture invocation events for failed Lambda invocations and put them in a JSON file. From here, I can step through the code line-by-line using the Serverless framework and VS Code! See here for more details on how you can do the same yourself.
As with X-Ray, Lumigo also offers a timeline of the transaction.

And as I mentioned earlier, all these capabilities extend to TCP-based requests too. So you can trace requests to RDS and Elasticache in the same way as you do HTTP requests.
With these capabilities, I have been able to manage and debug problems in even complex serverless applications involving many moving parts.
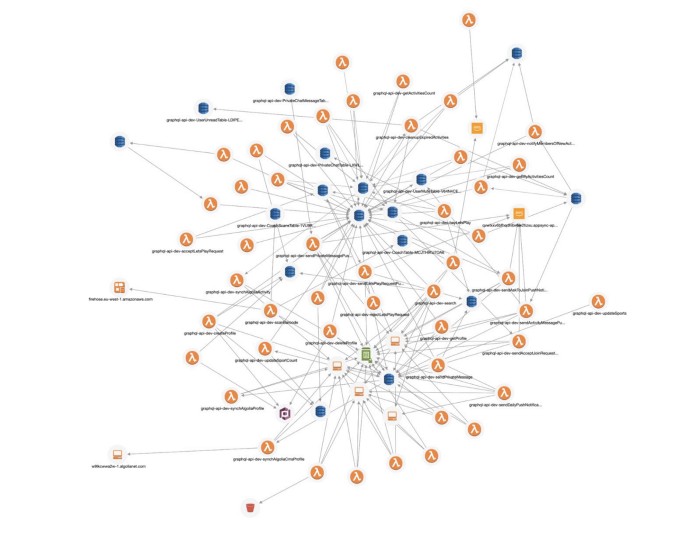
Get Lumigo in the AWS Marketplace.


