Sep 04 2023

Since its inception, Amazon Elastic Container Service (ECS) has emerged as a strong choice for developers aiming to efficiently deploy, manage, and scale containerized applications on AWS cloud. By abstracting the complexities associated with container orchestration, ECS allows teams to focus on application development, while handling the underlying infrastructure, load balancing, and service discovery requirements.
At the core of ECS adaptability lies ECS tasks, a fundamental unit that anchors the process of scaling to achieve peak application performance. As developers embark on the journey of refining application performance, ECS tasks play a pivotal role in maintaining harmony between resources and requirements. This enables developers to navigate complexities and swiftly respond to evolving demands, all while ensuring the requisite resilience for adept adaptation within deployments.
Let’s begin our container task scaling journey by first understanding what ECS Tasks are, and look closer at some of the metrics to measure when looking to scale them.
Understanding ECS Tasks
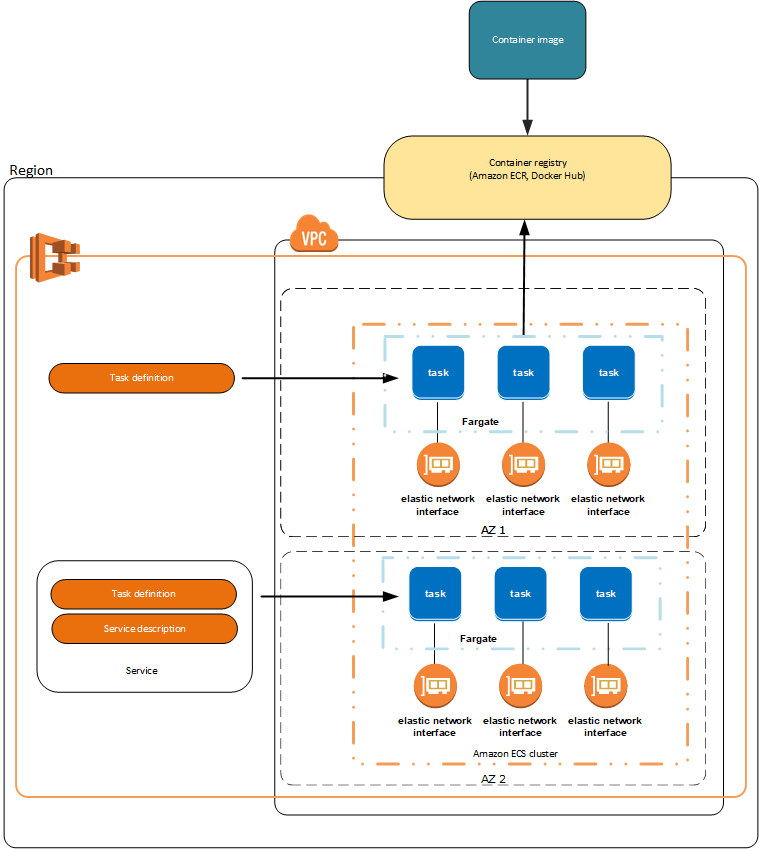
Amazon Elastic Container Service (ECS) tasks are the heart of application deployment in the ECS environment. A task is a runnable unit that encompasses one or more Docker containers, defined by a task definition, which serves as a blueprint detailing how the containers should operate. This task definition specifies the Docker image to use, the required CPU and memory, the Docker networking mode, and various other settings that tailor the operational behavior of the containers within the task. Essentially, when you run an instance of a task definition, it becomes an active task in your ECS cluster.

Tasks provide the flexibility and granularity needed for deploying complex applications on ECS. For instance, in a microservices architecture, each service could be encapsulated in its own task, allowing it to scale independently based on its individual requirements. This modular approach ensures that resources are utilized optimally and services can be updated or rolled back with minimal disruption.
Key Indicators for ECS Task Scaling
The decision to scale ECS tasks is guided by discerning key indicators that reveal when adjustments are necessary. By monitoring specific metrics and signals, you can proactively address potential bottlenecks and ensure your application’s seamless performance:
High CPU or Memory Utilization: Keep a vigilant eye on CPU and memory metrics for your tasks. If you consistently observe usage values approaching the resource limits you’ve set, it’s a clear signal that scaling is warranted to prevent performance degradation.
Increased Application Load: The surge in user traffic or sustained heightened activity demands immediate attention. Scaling your ECS tasks becomes imperative to match the increased demand and guarantee optimal user experience.
Pending Task Count: An accumulation of pending tasks waiting for scheduling signifies that your current task setup might be overwhelmed. Scaling out your tasks can effectively clear the backlog and restore smooth operations.
By observing these indicators, you can proactively anticipate scaling needs and ensure that your ECS tasks seamlessly adapt to the dynamic demands of your containerized applications. This comprehensive guide equips you with the knowledge and tools to wield the power of ECS task scaling effectively, ensuring your applications thrive in a rapidly changing digital landscape.
ECS Task failures
These issues can be an issue for example, If a container within an ECS task doesn’t have enough memory or CPU resources to run. You can expect various behaviors and outcomes, depending on the specific circumstances, but here’s what you might experience:
Insufficient Memory
Container Failures: If a container doesn’t have enough memory to accommodate its operations, it might fail to start or crash shortly after starting. The container runtime might terminate the container if it exceeds its memory limits.
Out of Memory Errors: The container might generate “out of memory” errors, which can impact the container’s performance and stability.
Performance Degradation: Even if the container starts, it might experience severe performance degradation due to constant swapping between memory and disk, negatively affecting the application’s responsiveness.
Insufficient CPU
Sluggish Performance: Containers with inadequate CPU resources might run with sluggish performance, causing delays in processing tasks and responding to requests.
CPU Starvation: In a shared environment, where other containers also require CPU resources, the container might suffer from CPU starvation, impacting its ability to execute tasks.
Long Queues: If the container is part of a service that experiences high demand, tasks might be queued up due to lack of available CPU resources.
Network Limitations
Network Bottlenecks: Containers might face reduced throughput if there are network constraints. This can manifest as prolonged response times or failed network calls.
Limited Network Bandwidth: If a container is set to communicate with external services or databases frequently, and the bandwidth isn’t sufficient, it might result in dropped connections or timeouts.
Dependency Failures: Applications often rely on various external services. If these services face downtimes or are slow to respond due to network issues, the containerized application might register these as errors or failures.
In these cases, ECS and the underlying container runtime will attempt to manage resource allocation based on the specifications provided in the task definition. If a container consistently fails to run due to resource constraints, you might see status updates indicating task failures or container terminations in the ECS console or logs.
Monitoring is key
Effective monitoring is an indispensable aspect of managing applications within the AWS ECS ecosystem. By closely monitoring the performance, health, and resource utilization of your containerized applications, you can identify potential issues, optimize resource allocation, and ensure seamless operations. In this section, we delve into the significance of application monitoring in ECS and highlight key metrics to track for maintaining optimal performance.
Early Issue Detection: Monitoring allows you to identify issues and anomalies before they escalate into critical problems. By proactively spotting performance bottlenecks or resource shortages, you can take corrective action before they impact user experience.
Resource Optimization: Monitoring helps you track resource utilization patterns, enabling you to fine-tune memory and CPU allocations based on actual workload demands. This optimization enhances efficiency, reduces waste, and ensures optimal performance.
Scaling Insights: Monitoring metrics can offer valuable insights into when to scale your ECS tasks. Monitoring can help you understand how your application behaves under varying workloads, allowing you to trigger scaling events proactively to accommodate increased traffic or activity.
Service Health: Monitoring helps maintain the health of your ECS services by alerting you to unhealthy containers or tasks. This allows for swift responses to mitigate downtime and ensure seamless service availability. For more information on ECS Health Checks, see the blog post Troubleshooting Bad Health Checks on AWS ECS.
ECS Monitoring with AWS
With AWS, users have access to a suite of monitoring tools tailored for ECS. Amazon CloudWatch, for instance, provides detailed insights about your ECS tasks, services, and clusters. By integrating CloudWatch, users can set up alarms, visualize logs, and monitor key metrics, all of which can assist in maintaining the desired performance of applications. Another tool, AWS X-Ray, offers insights into the behavior of your applications, helping to trace requests from start to end and visualizing latency bottlenecks.

Despite these advanced AWS monitoring offerings, they might not always provide an exhaustive view of every intricate detail of your containerized application. It’s crucial to remember that while these tools are powerful, they present data within the AWS ecosystem context. To have a holistic understanding of your applications, especially when integrating third-party services or when containers interact with components outside AWS, you might need to incorporate additional monitoring solutions. This ensures that no aspect of your application’s performance remains obscured.
Find out more about ECS Troubleshooting using AWS with our handy ECS Monitoring guide
ECS Monitoring with Lumigo
At Lumigo, we fully grasp the intricate challenges developers face when troubleshooting and debugging applications in environments like Amazon ECS. We not only endeavor to provide tools designed for rapid deployment, but it’s critical to also ensure minimal integration effort. By prioritizing a reduced integration footprint, we allow developers the freedom to focus on coding while our auto-tracing handles as much of the setup as possible.

This approach not only speeds up the development and deployment processes but also becomes a vital part of your troubleshooting toolkit. Lumigo’s deep association with OpenTelemetry ensures comprehensive observability, rendering actionable insights that equip developers to preemptively address issues, optimize performance, and refine their applications continually.
Getting Started
Setting up Lumigo is as easy as creating an account and installing the containerized language distribution of choice, and defining some environmental variables. For example, Monitoring a containerized Python application starts with a `pip install lumigo_opentelemetry` in the application root directory, and then by setting the following environment variables:
AUTOWRAPT_BOOTSTRAP=lumigo_opentelemetry

LUMIGO_TRACER_TOKEN={Your Lumigo Token}

OTEL_SERVICE_NAME=wildrydes

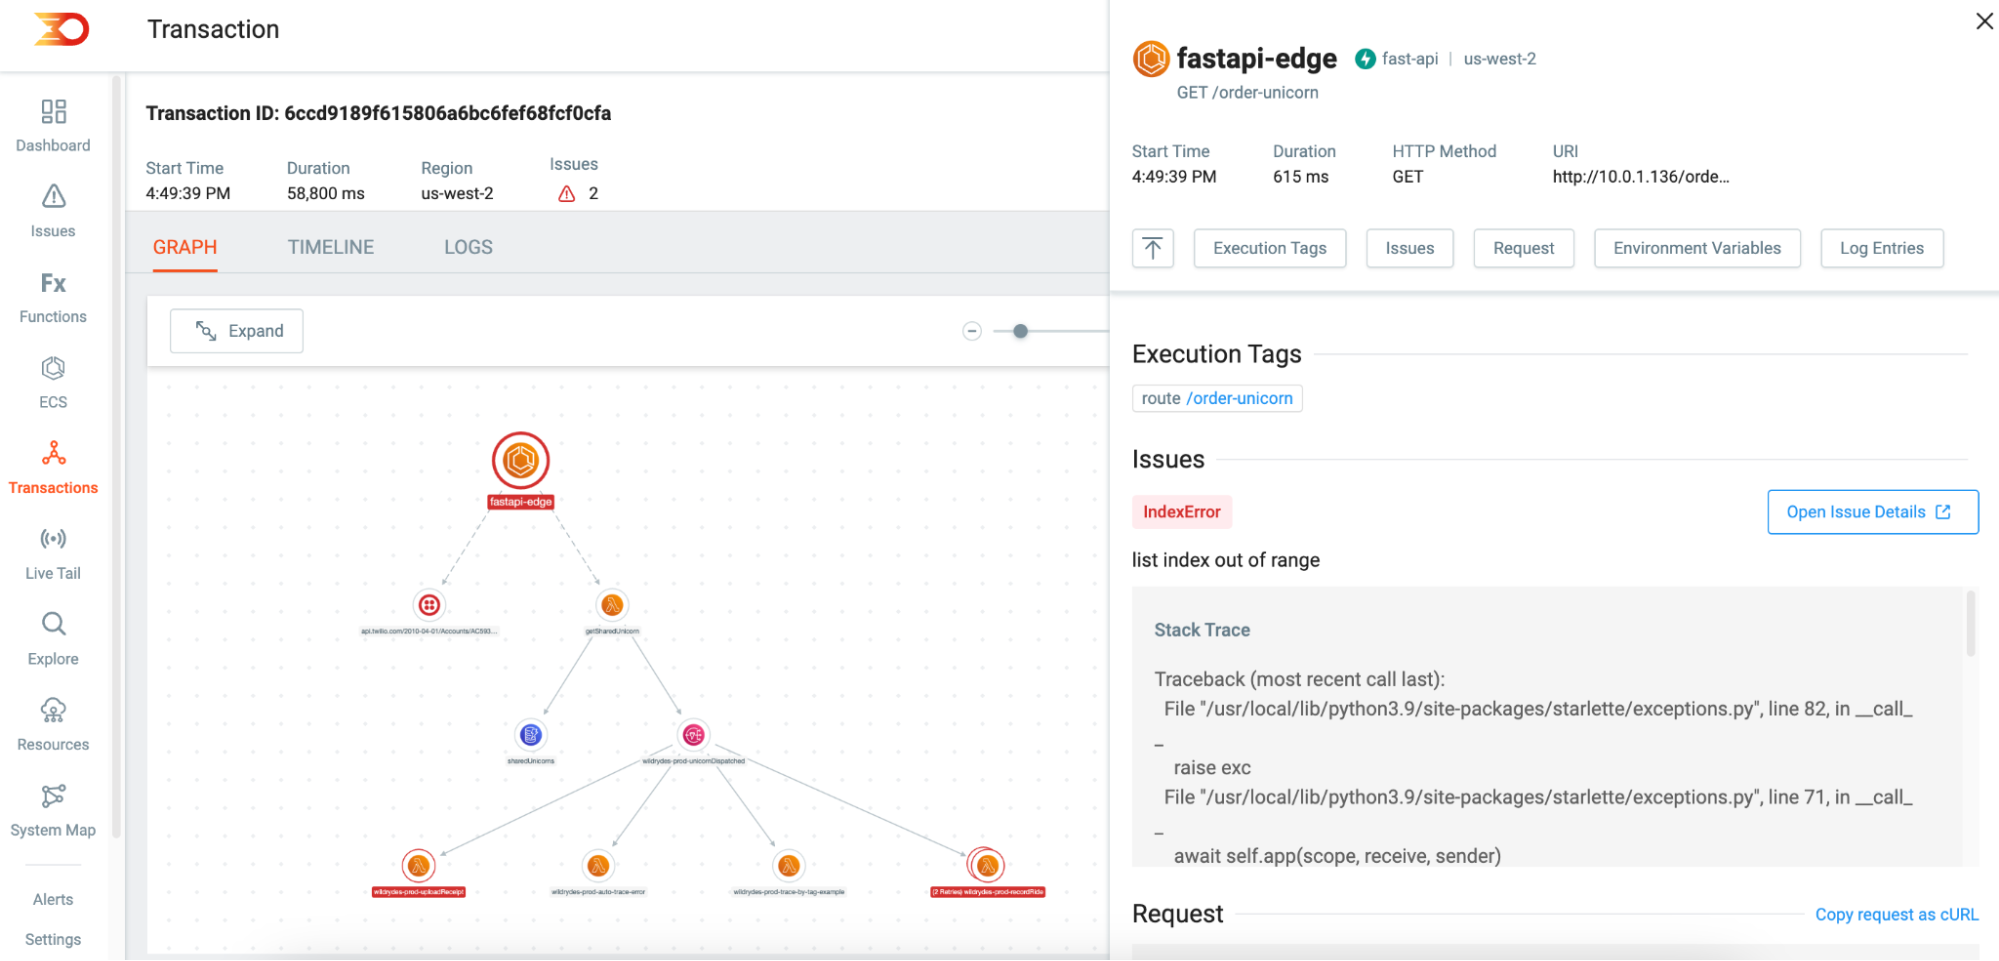
What truly stands out for me is the ability to grasp the complete narrative when application challenges crop up during invocation. Lumigo’s end-to-end tracing provides a comprehensive perspective on the erroneous instigation’s path. More often than not, it unveils that the root cause of the error isn’t necessarily where it was initially detected, but had its origins earlier in its microservice-driven journey.
Get the full Deployment Picture
Understanding and monitoring your ECS environment is more than just a commendable approach—it’s essential for the health and efficiency of your deployments. Proactive monitoring provides the insights needed to pinpoint and resolve issues, make the most of your resources, and ensure your applications are primed to scale with your business demands. With the right tools and strategies, navigating the world of containerized applications becomes intuitive, laying the foundation for a resilient and responsive ecosystem.
Unlock the full picture from your ECS deployments, sign up for a free Lumigo account and get started monitoring your container deployments.

