Apr 04 2023

Distributed tracing: Understanding the basics
A distributed system is a system whose components are located on different networked computers, which communicate and coordinate their actions by passing messages to one another. The components interact in a decentralized manner and work together to achieve a common goal. Working with distributed systems is challenging, because failure often spreads between components and debugging across multiple components is difficult and time-consuming. Distributed tracing is a way to automatically collect data about how the various components in a distributed system interact to serve specific requests, and it is an irreplaceable tool to troubleshoot distributed systems. In this blog, we will explore what distributed tracing is and how it can be used to monitor and debug a distributed system.
Distributed tracing is a technique used to help Software Engineers, SREs and DevOps engineers to understand and gain an insight into what is going on and the behavior of a distributed system. By tracking the flow of requests and transactions across different services, this provides a holistic view of the system and can help to identify issues, faults, bottlenecks and performance issues.
To implement distributed tracing, engineers such as you and I, need to write code or add libraries to our applications that generate and propagate trace context, and record spans, which describe what each component is doing. As trace context is propagated across our applications and spans are collected we can look at all the spans in a trace to visualize and analyze the flow of requests and transactions across different services.
Debugging Intermittent Failures in Distributed Systems: Challenges and Best Practices
Simply having traces and logs in place is sometimes not enough to debug an intermittent failure. These failures can come from deep within a system that might be making a lot of noise. As a developer, you really need to identify the difference between a successful trace and a failed trace in order to identify the issue. Some of the challenges faced when doing this are:
- Reproduction of the failure can be hard to expose if the error condition is obscure or unknown and this is where good error documentation in the trace span is needed.
- Scalability of the system. Some distributed systems can have hundreds of servers all producing logs making it hard to trace errors.
- Time-sensitivity is particularly challenging as an error may occur for only a certain period of time meaning you need to catch it before it disappears.
That being said, from the get-go it is always good to follow some best practices when debugging failures in a distributed system. These best practices will help you to debug quicker, and mitigate some of the challenges mentioned above.
- Implement a comprehensive monitoring system. This will help you to identify when a failure occurs and will help you to narrow down the scope of the failure.
- When reproducing failures, always use a controlled environment where you can control the inputs and outputs of the system.
- Only analyze relevant data. With such large volumes of data available it is important to know where you are looking. This will help you identify patterns and trends in the data.
- Talk to your team and other teams around you as it is important to understand the context of the failure and how it affects the system as a whole.
- Ensure you are using the right tools. There are many tools available to help you debug failures in a distributed system. It is important to use the right tool for the job.
- Automate as much as possible, from log dumps to error handling. This will help to keep your team productivity as high as possible.
How to troubleshoot database access issues in Python Flask-based ECS services using pymongo
Let’s look at a classic distributed tracing scenario: Lambda → HTTP → ECS Service (Python Flask) → Database. The application is throwing intermittent failures in the access to the database and in turn, this causes issues in the user-facing Lambda function, somewhat of a bubble-up effect.
There are a number of steps you can take when troubleshooting this example. In no particular order, here are a few:
- Check all logs / traces / metrics of the services to gather a clear picture of what is going on.
- Monitor the database connections. By doing this, you will be able to identify if the database pool has been configured incorrectly.
- Check the pymongo configuration and ensure that the correct settings are being used (host / port / authentication).
- Check the connection between the database and the ECS service. You could use a ping or a traceroute to test connectivity.
- Check the database performance. If this application is making many read / write requests then it could be causing bottlenecks in the infrastructure.
- Ensuring the code is performant. Make sure connections are not being left open and that the code is not making unnecessary calls to the database as this could cause memory leaks and in turn slow down a part of your system.
Leveraging distributed tracing tools to isolate the root cause of failure
That is a lot of manual steps that have to be taken to identify and isolate the cause of the failures and this is where distributed tracing tools come in handy. Distributed tracing tools can help you to identify the root cause of the failure by providing you with a holistic view of the system by embedding trace IDs in the logs and traces. This allows you to trace the flow of requests and transactions across different services at a granular level.
This is where Lumigo enters the room. Lumigo’s distributed tracing capabilities gives you the power to drill down into the request and see the exact path it took through your system, somewhat like a tracked GPS service. As a developer you may set thresholds for error rates and latency and if one of your services encounters an error, for example, a response rate spikes then Lumigo can send you an alert. It can also help you visualize bottlenecks in your infrastructure with a representation of the flow of requests within your entire system. With this information, you can see a birds eye view of the infrastructure in place, thus helping you to debug and identify issues from one single dashboard and set of tools.
How to analyze stack traces, transactions, invocations and timelines
Now let’s look at how you should approach analyzing the data in front of you. There are a number of ways you can do this, but here are a few tips:
- Understand the context of the error. You should build a clear picture and understanding of the request flow. Let’s take the Python Flask-based ECS service as an example. Without the context of the intermittent error, the stack trace would not mean a lot, but having a clear picture of the request flow from the Lambda to the ECS service, you can understand the context and trace it quickly.
- Understand the timeline of events within your system of when requests are being made and when responses are being sent. By doing this, you may be able to see anomaly data. Let’s use the same Python example, by looking at the timing of each request, you may be able to notice a spike in latency with a certain database query corresponding to a certain failure.
- Look for patterns and sequences in the data. By this, we mean looking at the structure and organization of the data being captured. You could look into the format of the data trace, any metadata and different data types included. Being able to spot patterns when debugging is important as this will help you to navigate the traces far easier.
Lumigo is a tool that will help you do all of the above with ease by providing you with a complete system map, live tail of logs, a list of all transactions happening, ECS monitoring giving you a complete picture of your CPU and memory utilization and much more!
Implementing effective monitoring and alerting strategies to minimize downtime
With a distributed system, you are relying heavily on logs and traces to maintain good order and minimize downtime but there are a few steps you can take to optimise your monitoring and alerting strategies.
To begin with, you should outline your clear business objectives. You should have a clear understanding of your service level objectives (SLO’s) and key performance indicators (KPI’s). By having these clearly outlined it will prevent any B2C disputes and allow you to maintain a highly performant system. Some of the metrics measured here can include latency, throughput, error rate, availability and recovery time objective (RTO).
You then need to implement a monitoring tool such as Lumigo to help track and visualize the KPI’s and SLO’s. Within a tool such as Lumigo, you can set up proactive alert policies to ensure you are notified if anything out of the ordinary is happening. For example, you may have an alert to signal when a latency exceeds a certain threshold. Alongside having the alerts in place you will also need them to be actionable and provide enough context to ensure an engineer can quickly identify the root cause of the issue and resolve it.
Finally you should consistently refine and adjust your SLO’s and KPI’s in order to keep them up to date. As the landscape of your system changes, you may need to add new metrics or remove redundant ones as well as testing what is currently in place to ensure your system is working as it should. By doing all of this, and becoming familiar with the system in hand, you are eliminating the possibility for errors and minimizing your overall downtime if something does go wrong. To find out more on SLO’s, see our blog post on defining and measuring your SLI’s and SLO’s.
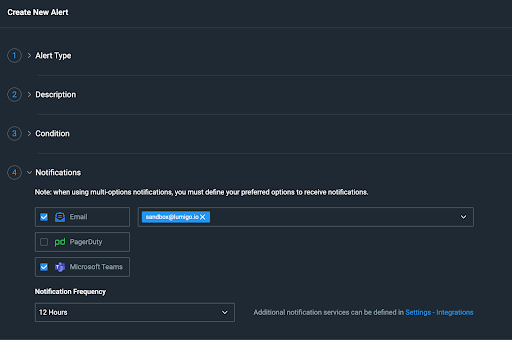
Before moving on, let’s see how simple it is to set up your own alerts using Lumigo.
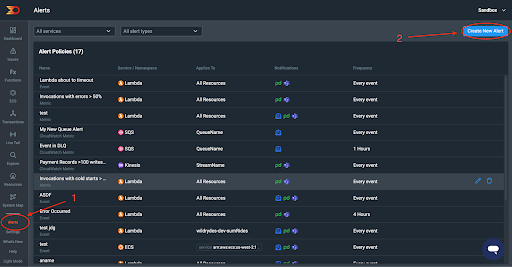
Sign into your Lumigo account and head to your dashboard. Then click on “Alerts” on the side menu. Once you are on your Alerts page, click on the “Create New Alert” button in the top right corner of the page.
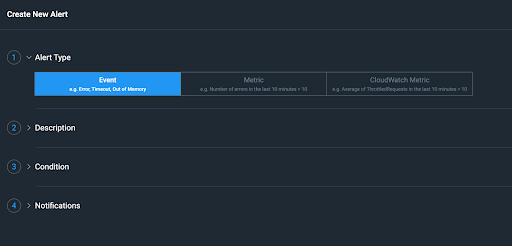
Now you are on the new alert page, first choose the alert type, and this is where you will see first hand Lumigo’s tight integration with AWS.
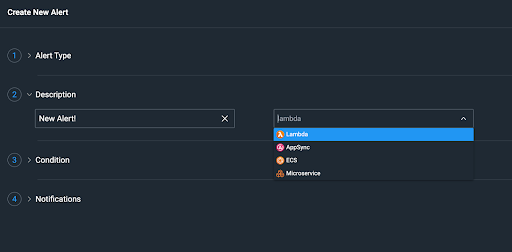
Next, give it a description and choose the service type you are wanting to monitor.
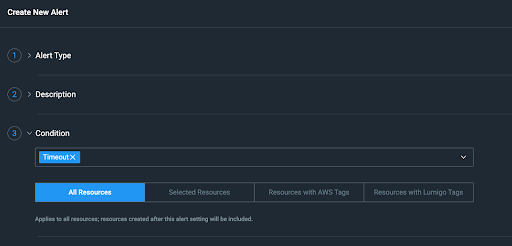
Now you need to give it a condition to work with. This is where you choose what resources you want to monitor. This can be done with the resource directly or using tags.
Finally, after that has been selected, you now just need to tell it how to notify you and how often. You have three options here, Email, PagerDuty or Microsoft Teams.
Preventing database access failures: Best practices for building resilient systems
When it comes to building a resilient system, it can be hard but there are a few best practices you can follow to help you along the way. Here are a few that you should follow:
- Use a database that is known for resilience and works for your use case. For example, do not use a Document database when an SQL database is far better suited.
- Take regular backups of the database and test them regularly. This can be costly but it is cheaper than having to deal with the flip side of it.
- Implement redundant systems and infrastructure. This will help to mitigate the risk of a single point of failure and ensure you have high availability.
- Monitor performance with an observability product to ensure the database is not being overloaded and identify bottlenecks.
- Plan for scalability from the beginning to avoid building in technical debt.
- Regularly test for failure scenarios and have a disaster recovery plan in place. Being familiar with procedures and processes is important and often overlooked.
By using these best practices you can help ensure your database and system integrations remain available, resilient, and secure.
Conclusion: Building robust and scalable distributed applications with distributed tracing
Overall, it is important to stay vigilant and familiar when building and maintaining a distributed system. Observability is key, especially when things do not go to plan. In this post, we have looked at how to troubleshoot database access issues in Python Flask-based ECS services, how to analyze stack traces, transactions, invocations and timelines and how to implement effective monitoring and alerting strategies using Lumigo. We have also looked at how to prevent database access failures and some best practices to consider.
Happy observing and stay tuned for the next blog post in this series on troubleshooting ECS and slow draining queues.

