Aug 03 2023

Amazon Elastic Container Service (ECS) is a versatile platform that enables developers to build scalable and resilient applications using containers. However, containerized services, like Node.js applications, may face challenges like memory leaks, which can result in container crashes. In this blog post, we’ll delve into the process of identifying and addressing memory leaks in Node.js containers running on ECS.
First, let’s look closer at what a memory leak is. A memory leak is a type of resource leak that occurs when a written program incorrectly manages memory allocations in such a way that memory which is no longer needed is not released. In Node.js, memory leaks can be caused by a number of things, including:
- Storing references to objects that are no longer needed
- Creating too many child processes without terminating them properly
- Not closing streams, event listeners or database connections
- Using global variables and not managing them properly
If your application has a memory leak, ultimately it is going to fail at any given point. This is why it is imperative to catch these before they become a problem.
Understanding the Memory Leak Domino Effect
In ECS, containers are deployed as a task. A task is essentially a group of containers that are deployed together on the same EC2 host. If one of these containers crashes or fails, then the entire task will need to be restarted. Therefore, if you have a memory leak in any one of your containers, you run the risk of this affecting more than one container and this becomes a knock-on effect..
In order to identify a memory leak in a Node.js container, you need to monitor the memory usage of the container over a specific period of time. One way to do this from the code side of things, is by using a pre-existing Node.js method, `process.memoryUsage()`. This will return a JSON object containing the memory usage of the process. The object will contain the following properties:
- rss – Resident Set Size, the amount of space occupied in the main memory device (RAM) for the process, in bytes.
- heapTotal – the total size of the allocated heap, in bytes.
- heapUsed – the amount of heap used, in bytes.
- external – the amount of memory allocated by Node.js bindings, in bytes.
If you use this over a set period of time, you will be able to monitor the usage and identify if there is a leak or not.
The following code is a very simple example of how you could include this in your NodeJS app code, but it will give you an idea of how to use the method:
const memoryUsage = process.memoryUsage();

console.log(memoryUsage);
However, it’s important to note that while the code snippet provides a simple example of monitoring memory usage, in a containerized production environment, accessing this information may require navigating through logs in AWS logging services. This process can be challenging due to various factors, including accessibility permissions within the environment. Therefore, refining the way applications expose this information and setting up proper logging configurations is crucial to effectively troubleshoot and mitigate memory leaks in the long term.
No More Hunting for Needles in Logstacks
This is where Lumigo comes into play, offering an observability and monitoring solution equipped with end-to-end tracing capabilities tailored for ECS applications. With Lumigo, you can automatically trace your ECS applications, enabling proactive monitoring to detect and resolve issues, crashes, and errors. Furthermore, Lumigo empowers you to optimize the performance of your applications by identifying and addressing potential bottlenecks, such as memory leaks in containers.
To get started, the first step is signing up for a free Lumigo account and connecting it to your AWS environment. Once you’ve completed the setup, navigate to the dashboard, where you’ll find the “ECS” tab on the left menu. Click on it, and you’ll gain visibility into the ECS clusters detected on your AWS environment. Additionally you’ll also be able to easily see metrics from your traced clusters, all in one handy view.
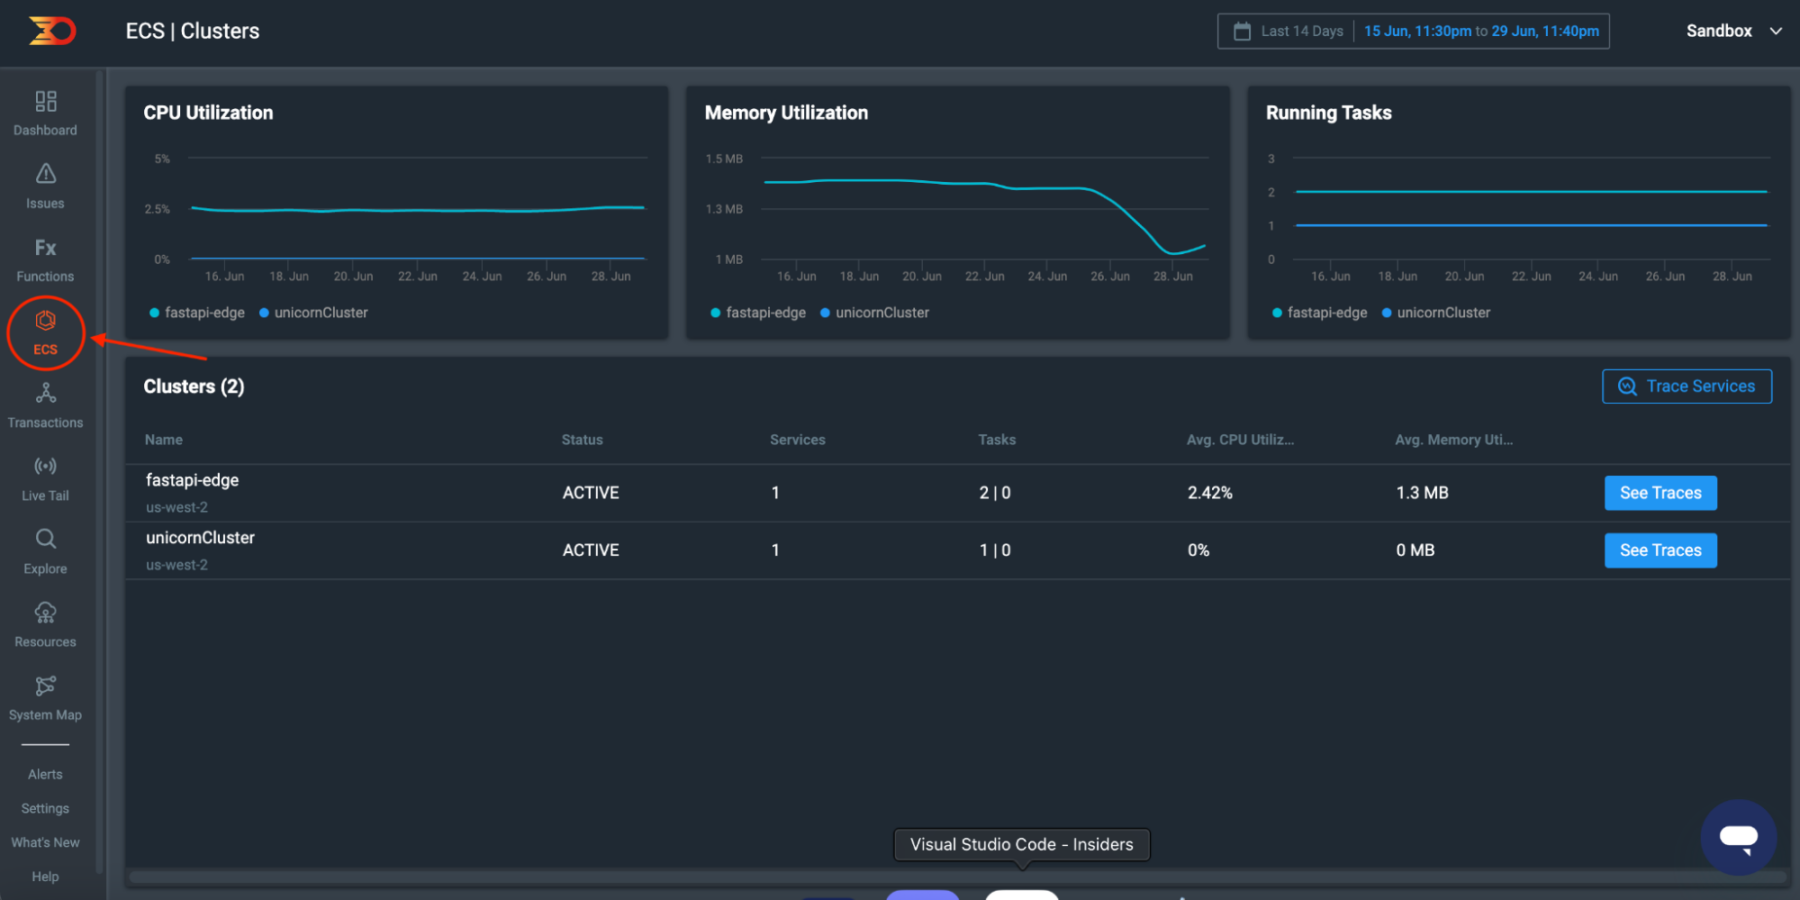
In the screenshot presented, you can observe three insightful graphs, each illustrating important information concerning the deployed ECS clusters. These graphs shed light on key metrics, enabling a comprehensive understanding of the clusters’ performance and health. The graphs offer a visual representation of the following metrics:
CPU utilization of the cluster: This graph exhibits how effectively the CPU resources of the ECS cluster are being utilized over time, helping you assess the cluster’s processing efficiency.
Memory utilization of the cluster: This graph visually depicts the memory consumption pattern of the ECS cluster, providing crucial insights into how efficiently the memory resources are being managed.
Running tasks in the cluster: The third graph highlights the number of tasks currently running within the ECS cluster, giving you an overview of the operational status and workload distribution.
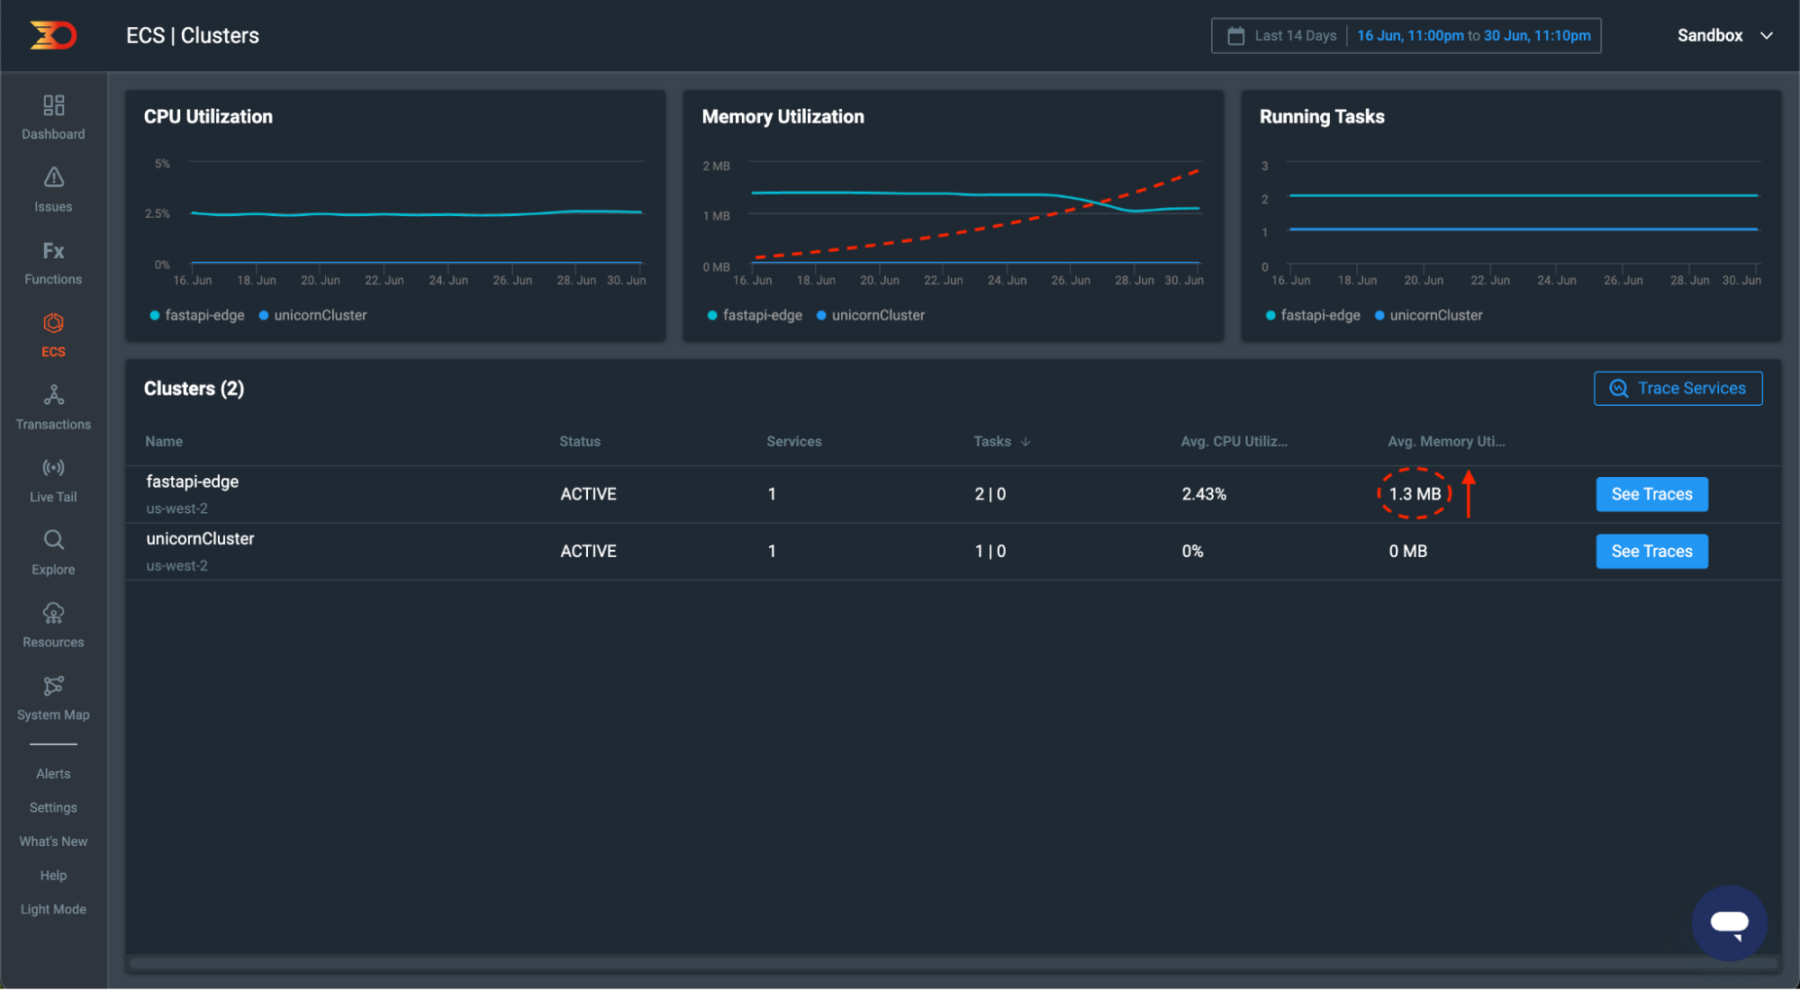
If there was a memory leak at any point, this would be visible from the middle graph shown, “Memory Utilization”. On the graph below I have drawn on a red dotted line to illustrate what you would expect to see, with the average memory utilization of the ECS cluster within the “Cluster” table increasing over time.
To enhance the view on this dashboard and gain more granular insights into your ECS tasks, you can set up the Lumigo tracer within your application. This process involves installing the Lumigo Node.js package, which enables seamless tracing of your ECS tasks.
By integrating the Lumigo tracer, you unlock a wealth of valuable information. The tracer automatically captures essential data related to your application’s performance and behavior, including detailed traces of request flows, error logs, and execution times. This comprehensive tracing capability allows you to delve deeper into the interactions between services, understand the root cause of issues, and optimize your application’s performance.
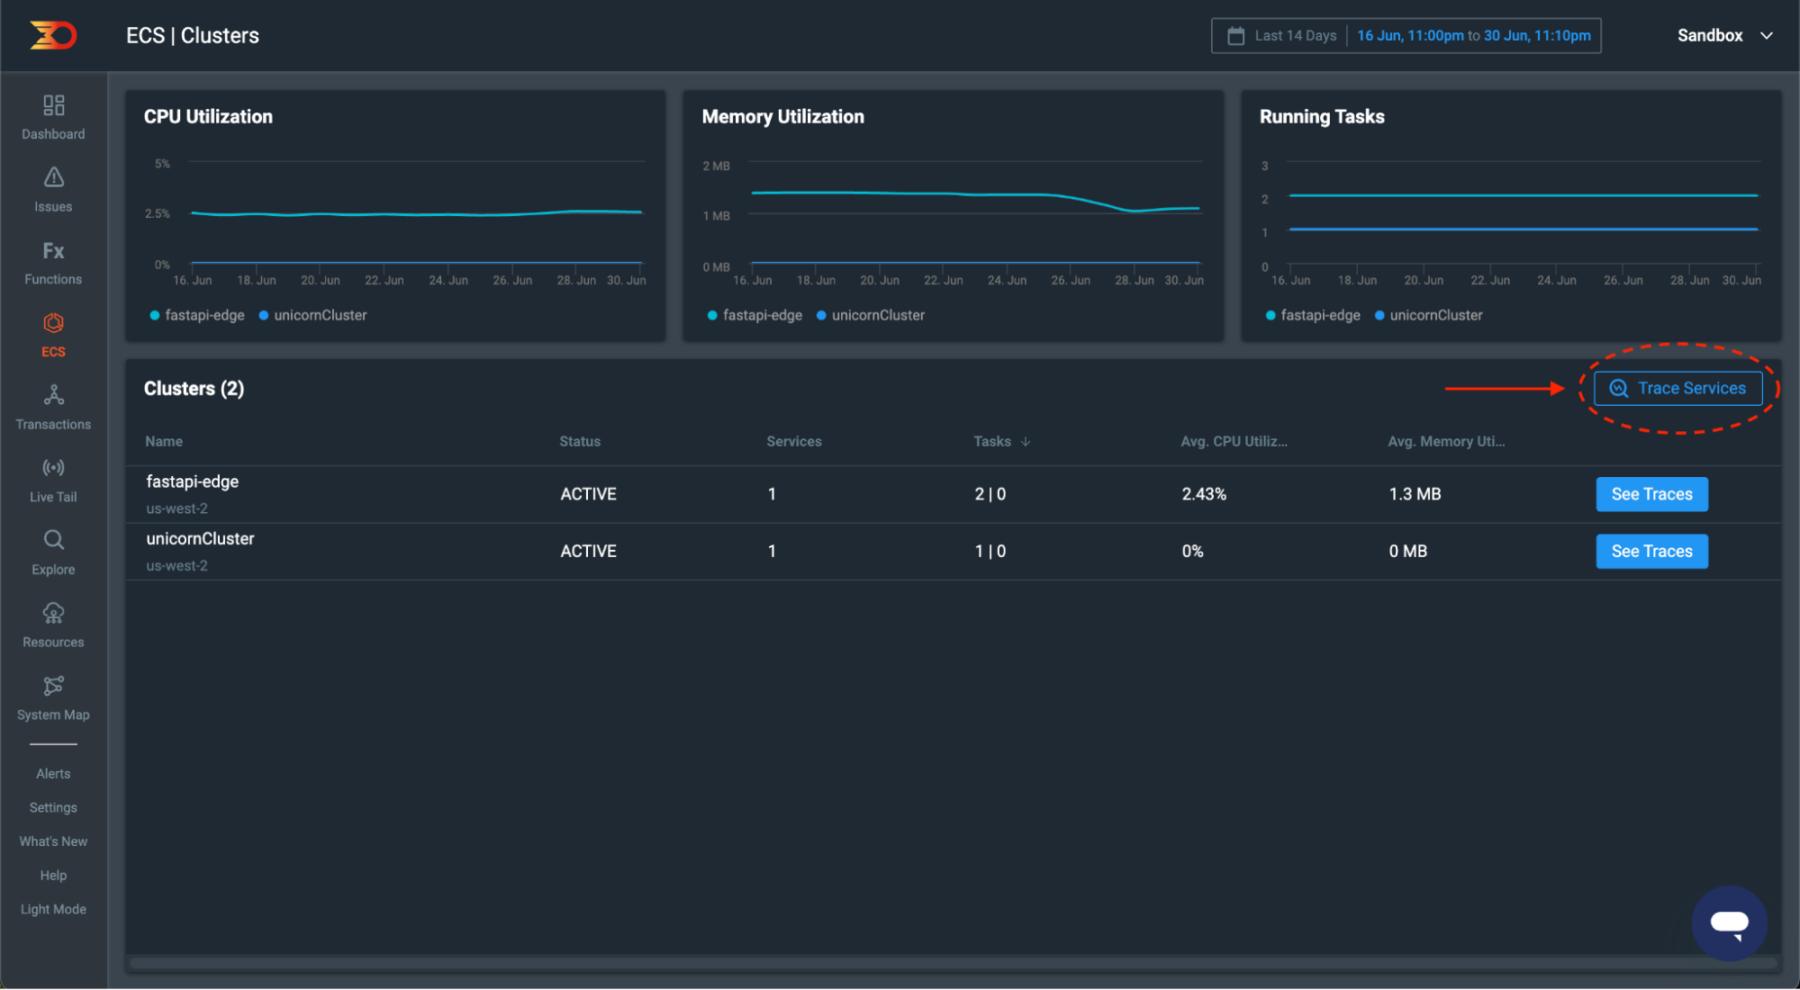
To get started, click on the “Trace Services” button on the ECS dashboard
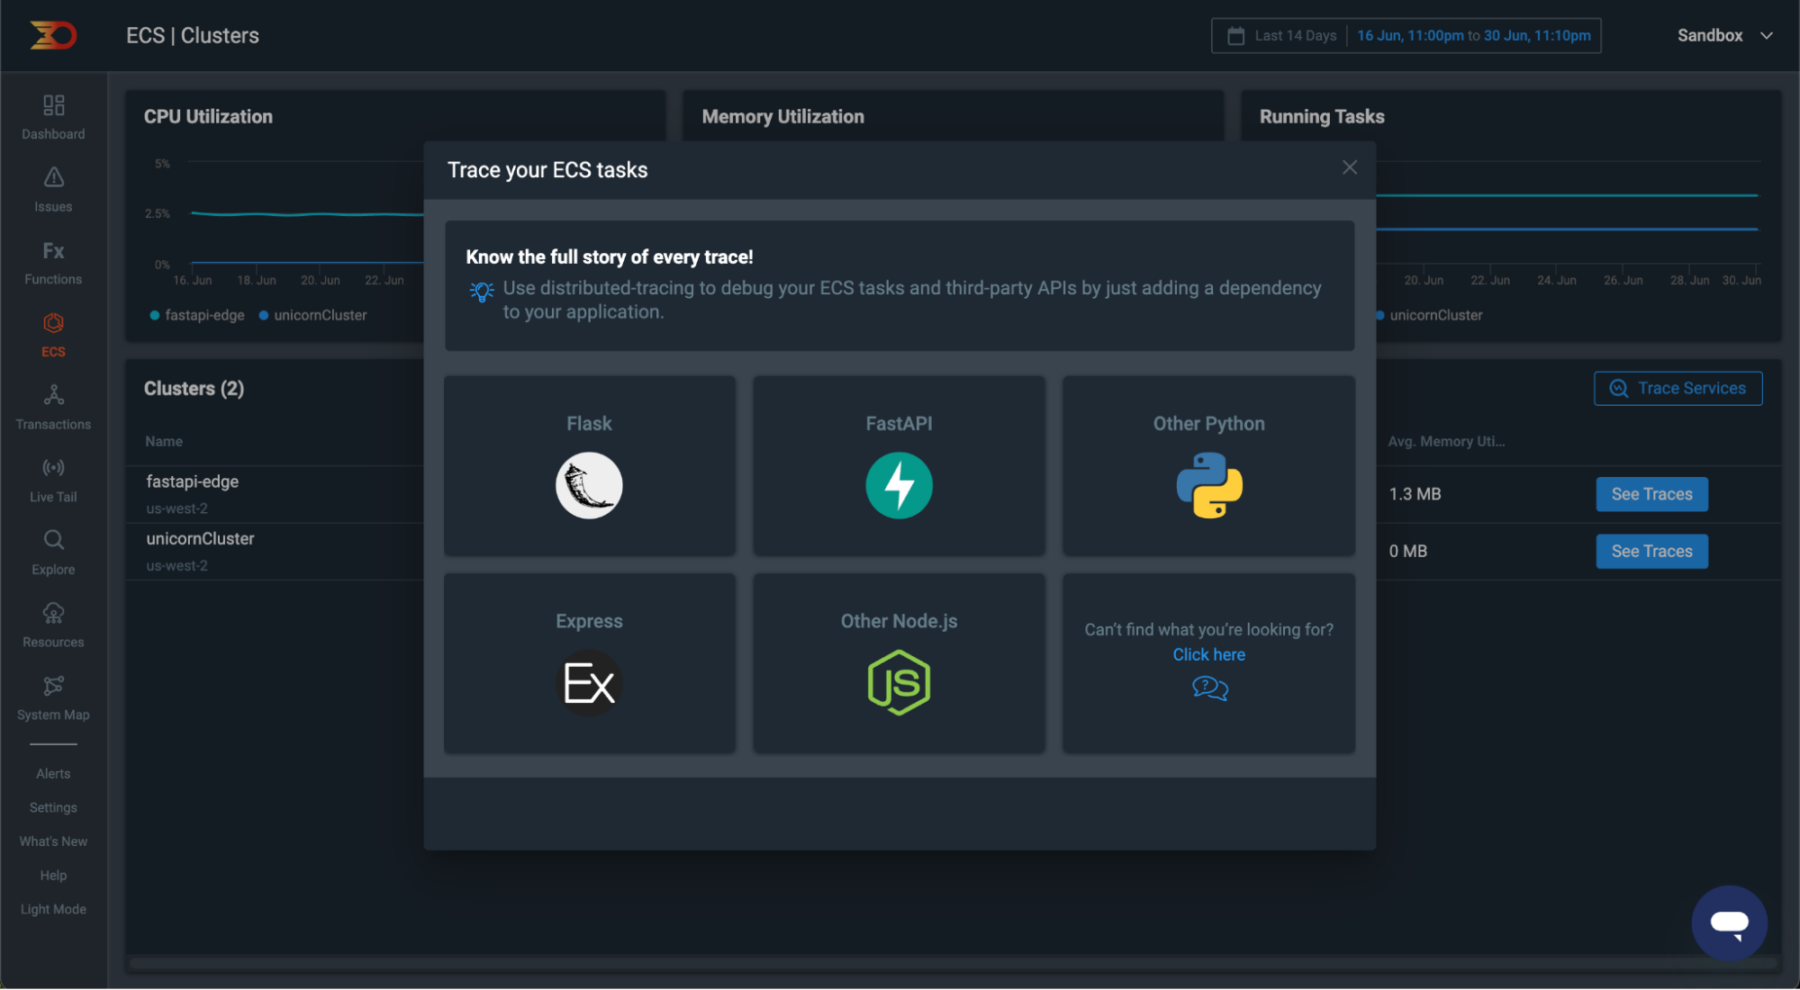
Now select the framework or language that you are using. In this example scenario we are using Node.js, but there are a number of other options available as you can see from the UI popup that appears..
After making your selection, the next step involves following a set of straightforward instructions to install the Lumigo package and configure the tracer. The provided instructions will guide you through the following steps:
- Adding the Lumigo package as a dependency for your chosen stack, whether you’re using npm for Node.js or pip for Python. This ensures seamless integration with your application.
- Importing the Lumigo package into your code, making its functionalities readily available for use. This step enables the tracer to effectively capture and analyze data.
In addition to the installation steps, you’ll also need to acquire your Lumigo token, which serves as a vital identifying component for connection between your application and Lumigo. To find your Lumigo token, head over to the Lumigo dashboard and navigate to the settings section located at the bottom of the left menu. Once there, access the “Tracing” tab, where you will discover your unique tracer token.
Tip: Protect your Lumigo token and avoid sharing it. Store it responsibly, ideally as an environmental variable.
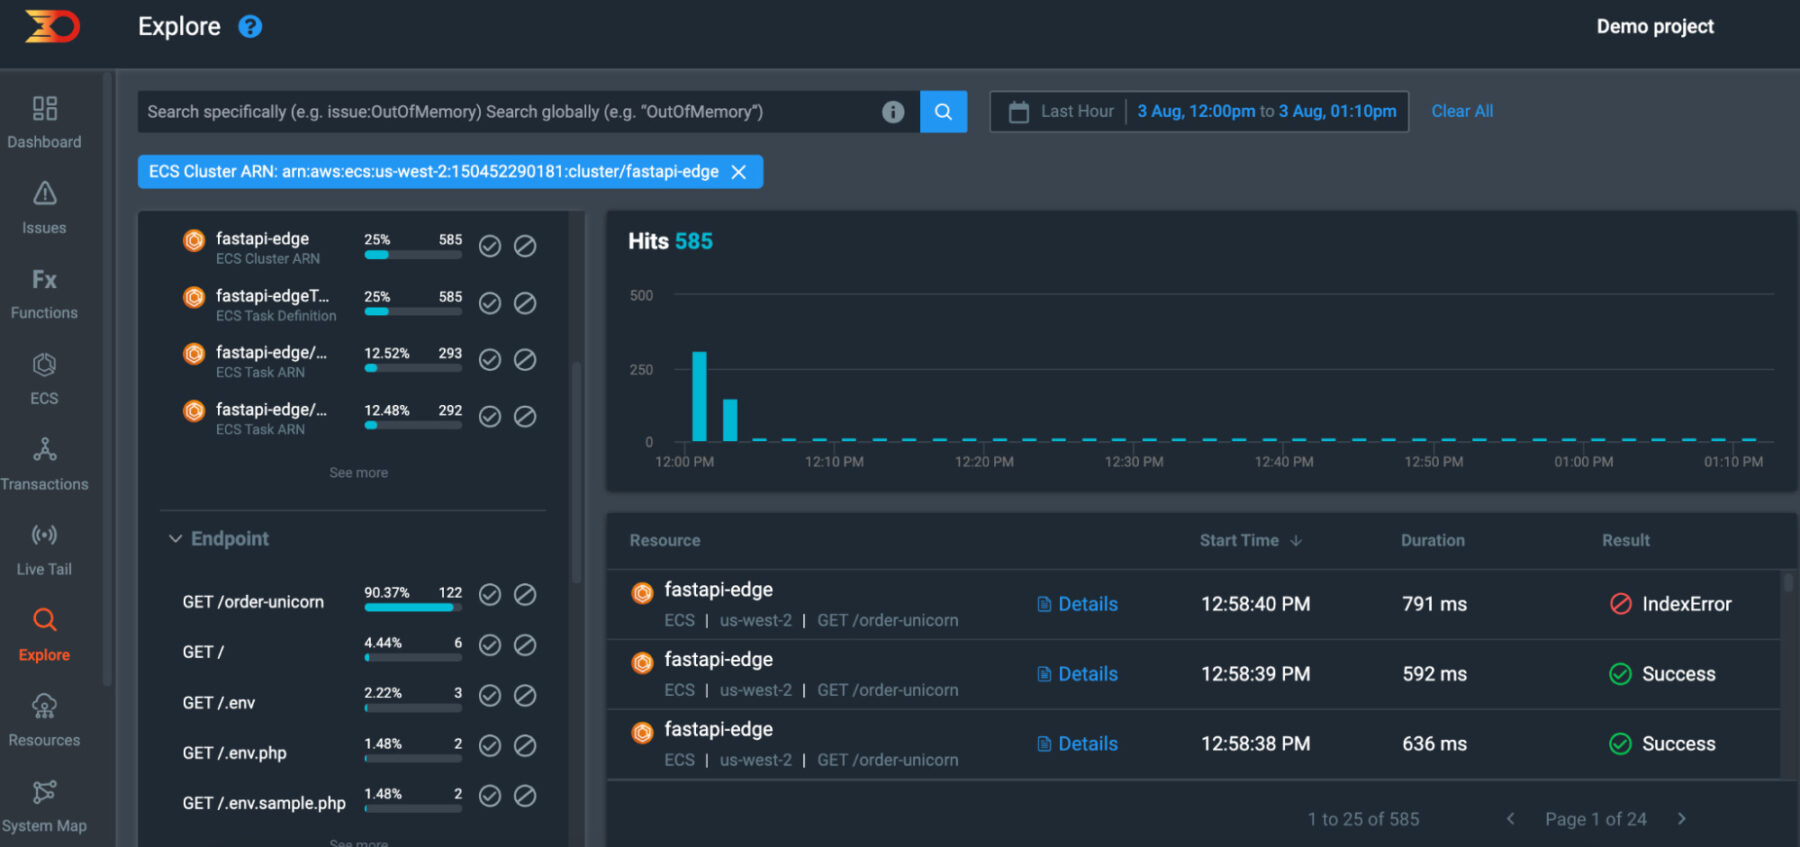
Now if you now click on the “See Tracers” button from a cluster in the ECS section, you’ll seamlessly transition to a more in-depth and filter-ready view within the Explore area. The data presented will be specifically tailored to the ECS cluster ARN you selected, enabling you to access granular insights and precisely examine the performance and behavior of that particular cluster.
It’s important to note that our tracer distributions offer robust support for multiple languages, libraries, and platforms, encompassing Java, Python, and NodeJS. Furthermore, we are fully aligned with the CNCF Open Telemetry distribution standards, enabling easy utilization of the open telemetry distributions with minimal configurations. To find out more on integration using Open Telemetry distributions check out the documentation.
Summary and Next Steps
In conclusion, we have pulled apart what a memory leak is, analyzed the consequences of having one in an application, how to add the Lumigo Tracer to identify any issues and how to read the vast amount of output generated.
Once you have identified an issue and can see where the bad code may lie, you would simply submit a fix and re-deploy your application. It is at this stage you should continue to monitor the update and see if it has resolved the problem by using the same steps outlined above or you can jump straight to the AWS console from the Lumigo dashboard to investigate further or confirm the deployment has worked.
Sign up for a free Lumigo account today to experience seamless tracing, gain insights into your application’s performance, and access powerful troubleshooting and debugging tools.

