


What are Lambda Cold Starts?
Cold starts can be a killer to Lambda performance. Lamba cold starts happen because if your Lambda is not already running, AWS needs to deploy your code and spin up a new container before the request can begin. This can mean a request takes much longer to execute, and only when the container is ready can your lambda start running.
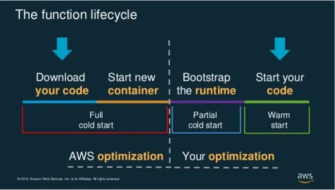
A “cold start” is the 1st request that a new Lambda worker handles. This request takes longer to process because the Lambda service needs to:
- find a space in its EC2 fleet to allocate the worker
- initialize the execution environment
- initialize your function module before it can pass the request to your handler function.
AWS needs a ready supply of containers to spin up when functions are invoked. That means that functions are kept warm for a limited amount of time (usually 30 – 45 minutes) after executing, before being spun down so that container is ready for any new function to be invoked.
Source: AWS
Cold starts in Lambda account for less than 0.25% of requests but the impact can be huge, sometimes requiring 5 seconds to execute the code. This issue is particularly relevant to applications that need to run executions in real-time, or those that rely on split-second timing.
Related content: Read our guide to AWS lambda limits.
In this article
What Affects Cold Start Duration? Our Experiment
If you want to understand cold starts better, let’s take a closer look at the main factors that cause it. It turns out that different types of requests can result in different cold start times. We designed an experiment to better understand these effects.
Type 1 vs. Type 2 Cold Starts
Michael Hart originally noticed that there are noticeable differences between two types of cold starts:
- Cold starts that happen immediately after a code change
- Other cold starts (e.g. when Lambda needs to scale up the number of workers to match traffic demand)
Perhaps there are some additional steps that need to be performed during the first cold start after a code deployment. Hence why the first cold start after a code change takes longer than the other cold starts.
In practice, most of the cold starts you will see in the wild will be of the 2nd type and it’s where we should focus on. However, I was really intrigued by this discovery and ran several experiments myself.
Experiment Design
In one such experiment, I measured the roundtrip duration for a few different functions:
- control— a hello world function with no dependencies whatsoever.
module.exports.handler = async event => {
  return {
 	statusCode: 200,
 	body: '{}'
  }
}
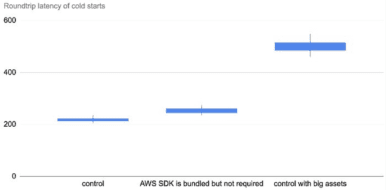
- AWS SDK is bundled but not required— the same function as control, but the deployment artifact includes the Node.js AWS SDK (9.5MB deployment artifact).
- control with big assets — the same function as control, but the deployment artifact includes two large MP3 files (60.2MB deployment artifact).
- require bundled AWS SDK— a function that requires the AWS SDK duration module initialization. This function bundles the AWS SDK as part of its deployment artifact (9.5MB).
const AWS = require('aws-sdk')module.exports.handler = async event => {
  return {
 	statusCode: 200,
 	body: '{}'
  }
}
- require AWS SDK via Layer— the same function as require bundled AWS SDK but the AWS SDK is not bundled in the deployment artifact. Instead, the AWS SDK is injected via a Lambda layer.
- require built-in AWS SDK— the same function as require bundled AWS SDK but the AWS SDK is not bundled in the deployment artifact. Instead, it’s using the AWS SDK that is included in the Lambda execution environment.
For each of these functions, I collected 200 data points for the post deploy cold starts (type 1) and 1000 data points for the other cold starts (type 2).
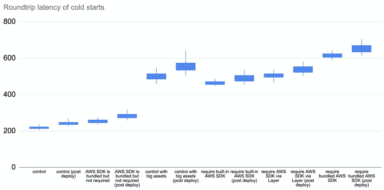
Experiment Results: What I Learned About Cold Start Behavior
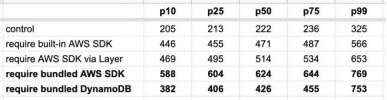
The results are as follows.
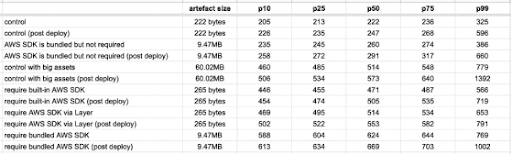
There are a few things you can learn from these data.
Type 1 (Immediate) Cold Starts Take Longer than Type 2
Type 1 cold starts (immediately after a code deployment) consistently take longer than type 2, especially as we look at the tail latencies (p99).
Deployment Artifact Size Impacts Cold Start Time
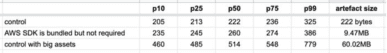
The size of the artifact has an impact on cold start even if the function does not actively require them. The following three tests all have the same function code:
module.exports.handler = async event => {
  return {
 	statusCode: 200,
 	body: '{}'
  }
}
The only difference is in the size of the deployment artifact. As you can see below, bundling the Node.js AWS SDK in the deployment artifact adds 20–60ms to the roundtrip latency for a cold start. But when that artifact gets much bigger, so too does the latency impact.
When the artifact is 60MB, this adds a whopping 250–450ms!
The “Require” Statement Increases Cold Start Time
Just what is taking the time when this line of code runs during module initialization?
const AWS = require(‘aws-sdk’)
Behind the scenes, the Node runtime must resolve the dependency and check if aws-sdk exists in any of the paths on the NODE_PATH. And when the module folder is found, it has to run the initialization logic on the aws-sdk module and resolve all of its dependencies and so on.
All these takes CPU cycles and filesystem IO calls, and that’s where we incur the latency overhead.
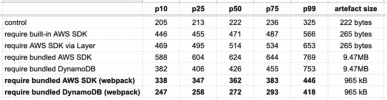
So, if your function just needs the DynamoDB client then you can save yourself a lot of cold start time by requiring ONLY the DynamoDB client.
const DynamoDB = require(‘aws-sdk/clients/dynamodb’)
Bundlers Like WebPack Dramatically Reduce Cold Start Time
By using a bundler like webpack, we can resolve all the dependencies ahead of time and shake them down to only the code that we actually need.
This creates savings in two ways:
- smaller deployment artifact
- no runtime resolution
And the result is awesome!
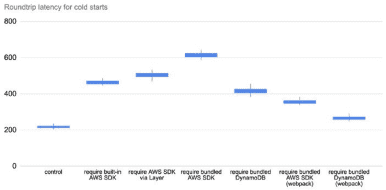
So, if you’re running Node.js and want to minimize your Lambda cold start time, the most effective thing you can do is to be mindful of what you require in your code and then apply webpack. It addresses several of the contributing factors to cold time latency simultaneously.
For the Serverless framework users out there, you can use the serverless-webpack plugin to do this for you.
Related content: Read our guide to AWS Lambda Async.
Back to Basics: What Causes Cold Starts in AWS Lambda?
Several factors contribute to cold starts in AWS Lambda. These factors can impact the duration and frequency of cold starts:
Languages
The choice of programming language can affect cold start times. Some languages, like Python and Node.js, have faster initialization times compared to languages like Java or .NET Core, which may have longer startup times due to factors like the Just-In-Time (JIT) compilation process and larger runtime environments.
Function chains
When Lambda functions invoke other Lambda functions (function chaining), cold starts may be amplified. If one function in the chain experiences a cold start, it can delay the entire chain of functions, leading to increased overall latency. Optimizing individual functions to reduce cold starts can help mitigate this issue.
Virtual Private Clouds (VPC)
When a Lambda function is connected to a VPC, it may experience longer cold start times. This is because AWS needs to set up an Elastic Network Interface (ENI) for the Lambda function to access resources within the VPC. The process of creating and attaching the ENI adds extra overhead to the initialization process, resulting in longer cold start durations.
7 Ways to Manage and Reduce Lambda Cold Starts
1. Using Provisioned Concurrency
Provisioned Concurrency is a feature of AWS Lambda that allows developers to specify the number of function instances that are always initialized and ready to respond immediately to invocations. By maintaining a specified number of pre-warmed instances, Provisioned Concurrency eliminates cold starts for those instances, ensuring consistent and predictable performance. This is useful for critical functions where latency must be minimized.
To effectively use Provisioned Concurrency, developers must estimate the required concurrency levels based on the application’s demand and usage patterns. This involves analyzing invocation metrics to determine peak times and the number of instances needed to handle the load without delays. While Provisioned Concurrency can significantly reduce latency, it also incurs additional costs, as pre-warmed instances are billed regardless of whether they are actively processing requests. Therefore, it’s important to balance performance improvements with cost considerations.
2. Develop the App with Cold Starts in Mind
Developing applications with cold starts in mind involves adopting design and architectural patterns that minimize their impact. This includes structuring applications to reduce initialization times, optimizing dependency management, and strategically using serverless resources.
One effective approach is to design stateless functions that initialize quickly and avoid unnecessary external dependencies. This can involve optimizing the function’s code to reduce its size and complexity, which in turn reduces the time required for initialization.
3. Use AOT-Compilation
Ahead-Of-Time (AOT) compilation is a technique that reduces Lambda cold start times by compiling function code into native binaries before deployment. This process eliminates the need for runtime compilation, allowing functions to start and execute more quickly. AOT-compilation is particularly beneficial for languages that are interpreted or compiled at runtime, such as Java or Python.
Implementing AOT-compilation involves using tools and frameworks that support compiling code into optimized binaries. For instance, GraalVM can be used with Java functions to compile them into standalone executables. These executables can significantly reduce startup times by removing the overhead associated with the Java Virtual Machine (JVM) startup and class loading.
4. Keep Your Functions Warm
Keeping Lambda functions warm is a strategy to prevent cold starts by periodically invoking functions to ensure they remain active. This approach can be implemented using scheduled events, such as CloudWatch Events or AWS Step Functions, to trigger invocations at regular intervals. By keeping functions warm, developers can ensure that there is always a ready instance to handle requests, thereby reducing latency.
There are several tools and services available to automate the process of keeping functions warm. For example, serverless plugins and third-party services can manage the scheduling and invocation of functions, simplifying the implementation of this strategy. However, it’s important to note that while keeping functions warm can reduce the occurrence of cold starts, it also incurs additional costs due to the invocations used to maintain warmth.
5. Reduce the Number of Packages
We’ve seen that the biggest impact on AWS Lambda cold start times is not the size of the package but the initialization time when the package is actually loaded for the first time.
The more packages you use, the longer it will take for the container to load them. Tools such as Browserify and Serverless Plugin Optimize can help you reduce the number of packages.
Related Research – Web Frameworks Implication on Serverless Cold Start Performance in NodeJS
6. Use Node.js, Python or Golang
If you write Lambda functions in Node.js, Python or Golang, you can optimize cold start durations to an acceptable range (<500ms) with minimal effort. That means that even when cold starts happen the response time is still within the application’s SLA.
In one experiment, Nathan Malishev found that Python, Node.js and Go took much less time to initialize than Java or .NET, with Python performing at least twice as quickly compared to Java, depending on memory allocation.
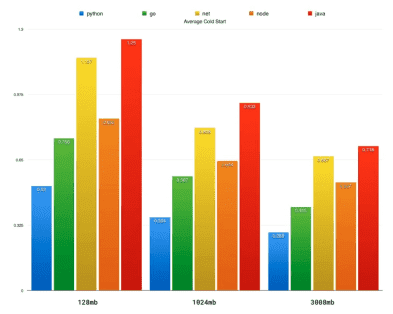
Source: Nathan Malishev
7. Monitor to Identify How Cold Starts are Affecting Your Application
Even if you apply provisioned concurrency and the other methods above, cold starts can happen. It is important to monitor your applications and identify how cold starts affect performance. Cold starts increase latency for some requests, and you need to identify which requests are affected and whether they impact your end users.
Both CloudWatch Logs and X-Ray can help you to identify where and when cold starts are occurring in your application, although it requires some active process of deduction on your part. A serverless-focused monitoring platform like Lumigo makes it much easier to monitor how cold starts are affecting your application.
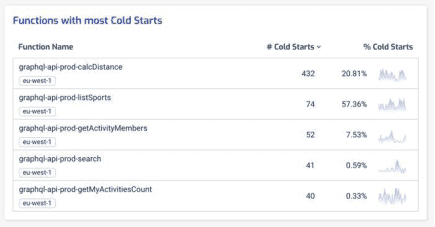
In the Lumigo dashboard, you can see at a glance which functions have the most cold starts. When you see functions with a high percentage of cold starts, such as the graphql-api-prod-listSports function below (with 57.36% of its invocations being cold starts), these are functions that you need to pay special attention to!
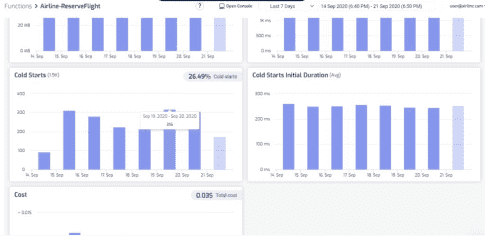
You can drill into each of these functions further and see how bad these cold starts are in terms of duration. After all, if the cold start duration is short then the cold starts have a much smaller impact on our user experience when they happen. The worst-case scenario is when the cold start duration is long and cold starts happen frequently!
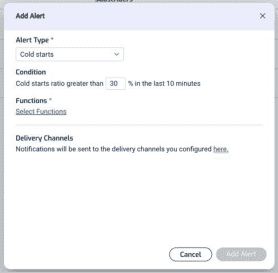
Furthermore, you can set up alerts in Lumigo so you can be notified when your functions experience a high percentage of cold starts. This is a great way to keep an eye on those user-facing functions where you’re concerned about end-to-end latency.
Get Lumigo and Identify, Fix and Prevent Cold Starts
Lumigo is a serverless monitoring platform that lets developers effortlessly find Lambda cold starts, understand their impact, and fix them.
Beyond cold starts, Lumigo can help you:
- Find and fix issues in seconds with visual debugging – Lumigo builds a virtual stack trace of all services participating in the transaction. Everything is displayed in a visual map that can be searched and filtered.
- Automatic distributed tracing – with one click and no manual code changes, Lumigo visualizes your entire environment, including your Lambdas, other AWS services, and every API call and external SaaS service.
- Identify and remove performance bottlenecks – see the end-to-end execution duration of each service, and which services run sequentially and in parallel. Lumigo automatically identifies your worst latency offenders, including AWS Lambda cold starts.
- Serverless-specific smart alerts – using machine learning, Lumigo’s predictive analytics identifies and alerts on issues before they impact application performance or costs, including alerts about AWS Lambda cold starts.
Get a free account with Lumigo and let us help you eliminate Lambda cold starts today.