


RabbitMQ is a popular open-source message broker that facilitates communication between different components of a distributed system. Monitoring a RabbitMQ instance is crucial to ensure its health, performance, and reliability. Monitoring allows you to identify and address potential issues before they escalate, ensuring smooth communication between various parts of your application.
This write-up outlines the key steps to effectively monitor a RabbitMQ instance, especially under heavy loads that simulate a performance test.
Understanding RabbitMQ Troubleshooting
When managing message-driven applications, understanding the debugging process is crucial. RabbitMQ, as one of the leading message brokers, has its intricacies and potential pitfalls when it comes to identifying and resolving issues. Debugging RabbitMQ involves monitoring the message flow, examining queue states, and ensuring proper connection and channel operations.
Challenges like lost messages, lagging consumers, and blocked connections serve as indicators, emphasizing the need to delve into the detailed metrics that RabbitMQ provides. Whether you’re a developer or a system administrator, understanding these metrics is vital. They offer a clear lens into the broker’s operations, revealing areas of optimization and potential pitfalls, ensuring a smooth and efficient RabbitMQ experience.
RabbitMQ Metrics For Optimal Monitoring
The heart of RabbitMQ’s efficiency lies in its intricate metrics that shed light on the inner workings and performance of the queuing system. These metrics serve as vital indicators, painting a comprehensive picture of system health, throughput, latency, and other key operational aspects. While some metrics offer a glance at real-time message flow and processing speed, others delve into deeper diagnostics, such as resource consumption and potential bottlenecks.
Here’s an overview of all the metrics you need to know when monitoring RabbitMQ
1. Queue Metrics:
- Queue Depth: The number of messages in a queue. Monitoring this helps prevent backlogs and ensures timely message processing.
- Message Rates: The rate at which messages are being published and consumed. Sudden spikes or drops can indicate issues.
- Consumer Count: The number of active consumers on a queue. A high consumer count might lead to resource contention.
2. Connection Metrics:
- Connection Count: The number of active connections to the RabbitMQ server. Too many connections can strain resources.
- Connection Throughput: The rate of connections being opened and closed. Rapid fluctuations might suggest connection issues.
3. Channel Metrics:
- Channel Count: The number of open channels. High channel counts can impact performance.
- Channel Consumption Rates: Monitor the rate at which messages are being consumed from each channel.
4. Resource Utilization:
- CPU Usage: Monitor CPU utilization to ensure the RabbitMQ server is not overloaded.
- File Descriptors: Monitor the usage of file descriptors to prevent resource exhaustion.
- Queue and Exchange Counts: Monitor the number of queues and exchanges per virtual host.
5. Users and Permissions:
- User Activity: Keep track of user logins and activity to detect unauthorized access attempts.
- Permissions Changes: Monitor changes to user permissions to ensure security.
6. Memory Usage:
- Erlang Memory Usage: Monitor the Erlang VM memory usage to prevent running out of memory, which can lead to crashes.
- RabbitMQ Memory Usage: Keep track of RabbitMQ’s memory usage, including memory used by queues, messages, and internal processes.
7. Disk Space:
- Disk Usage: Monitor disk space used by RabbitMQ for message storage. Running out of disk space can cause message loss.
8. Message Redelivery and Acknowledgment Metrics:
- Redelivery Rate: The rate at which messages are being redelivered. High redelivery rates might indicate consumer issues.
- Acknowledgment Rates: Monitor message acknowledgment rates to ensure messages are processed successfully.
9. Cluster Metrics (If Using Clustering):
- Node Health: Monitor the health and availability of nodes in the RabbitMQ cluster.
- Cluster Topology Changes: Be alerted to changes in the cluster topology, such as nodes joining or leaving.
10. Network Metrics:
- Network Throughput: Monitor incoming and outgoing network traffic to identify potential bottlenecks.
Debugging RabbitMQ with Built-In Tools
RabbitMQ boasts a suite of inherent tools, meticulously designed to aid in debugging its operations. The versatility is evident, from tools that trace message routes and log errors, to specialized features like the Firehose Tracer. With RabbitMQ tracing, the intricate pathways messages travel through become discernible, invaluable for diagnosing delivery issues. Complementing this, RabbitMQ logs offer granular insights into messages, connections, and potential hitches. The visual aficionados aren’t left out either: the RabbitMQ Management UI offers a bird’s eye view of queues, messages, and connections. Meanwhile, the CLI serves the command-line enthusiasts, granting hands-on diagnostics.
The Firehose Tracer is a RabbitMQ plugin that allows you to track messages through RabbitMQ. This can be helpful, particularly for debugging problems with message delivery. The Firehose Tracer works by publishing a copy of every message that is sent or delivered to a special exchange called amq.rabbitmq.trace. This exchange can be consumed by a separate application that can then store the messages or display them in a web UI.
To enable the Firehose Tracer, you need to add the rabbitmq_tracing plugin to your RabbitMQ server. You can do this by running the following command:
rabbitmq-plugins enable rabbitmq_tracing
Once the plugin is enabled, you need to create a queue that is bound to the amq.rabbitmq.trace exchange. You can do this by running the following command:
rabbitmqctl queue_declare -q firehose -exchange amq.rabbitmq.trace
Now, whenever a message is sent or delivered, a copy of the message will be published to the firehose queue. You can then consume the messages from this queue using a separate application.
Here is an example of how to consume the messages from the firehose queue using Python:
import pika

connection = pika.BlockingConnection(pika.ConnectionParameters(host='localhost'))

channel = connection.channel()

channel.queue_declare(queue='firehose')

def callback(ch, method, properties, body):
print(body)

channel.basic_consume(queue='firehose', on_message_callback=callback)

channel.start_consuming()
It’s important to note that as comprehensive as these tools are, there’s a crucial perspective to underscore. While RabbitMQ’s built-in mechanisms shine a light on its inner workings, they reveal only a portion of the broader application landscape with your deployment. When applications span across myriad services, these tools, though insightful for RabbitMQ, may not provide a holistic view of the entire application’s complexities and interactions. Hence, it’s vital to incorporate broader debugging strategies to achieve a complete and effective diagnostic overview.
Debugging RabbitMQ with Lumigo
Debugging RabbitMQ with Lumigo provides a comprehensive view of your applications deployment, creating end-to-end traces that facilitate rapid issue identification. This capability is especially valuable for pinpointing errors that may not originate directly from RabbitMQ, but inherently occur outside the application in a variety of managed services.
To begin, you’ll need to register for a free Lumigo account and deploy one of our containerized distributions or the Lumigo Kubernetes operator. Once this is done, using the Lumigo container distribution in a no-code mode (considered the most efficient approach) is as straightforward as executing the following steps:
- Install the Lumigo OpenTelemetry package into your application, for example in python using the command `pip install lumigo_opentelemetry`.
- Set the necessary environment variables to configure the token, app service name and also to automatically start tracing as part of your deployment:
LUMIGO_TRACER_TOKEN=<token>
OTEL_SERVICE_NAME=<service name>
AUTOWRAPT_BOOTSTRAP=lumigo_opentelemetry
Alternatively instead of setting the AUTOWRAPT_BOOTSTRAP env var, you can manually activate the tracer within your app by calling the Lumigo distribution in your code and by just configuring the `lumigo_tracer_token` and `otel_service_name` as environment variables.
Here’s an example using our previous python deployment:
import pika
import lumigo_opentelemetry
connection = pika.BlockingConnection(pika.ConnectionParameters(host=’localhost’))
channel = connection.channel()
channel.queue_declare(queue=’firehose’)
def callback(ch, method, properties, body):
    print(body)
channel.basic_consume(queue=’firehose’, on_message_callback=callback)
channel.start_consuming()
For kubernetes this process is, dare I say, even easier…. Yes you read that correctly!
Install the lumigo kubernetes operator via helm
helm repo add lumigo https://lumigo-io.github.io/lumigo-kubernetes-operator
helm install lumigo lumigo/lumigo-operator –namespace lumigo-system –create-namespace –set cluster.name=<cluster_name>
Then set the secret and define a namespace to trace, and let our kubernetes operator do the rest. It will automatically detect apps that you deploy to the traced namespace, and use the appropriate containerized distribution to trace Python, Java and Node applications.
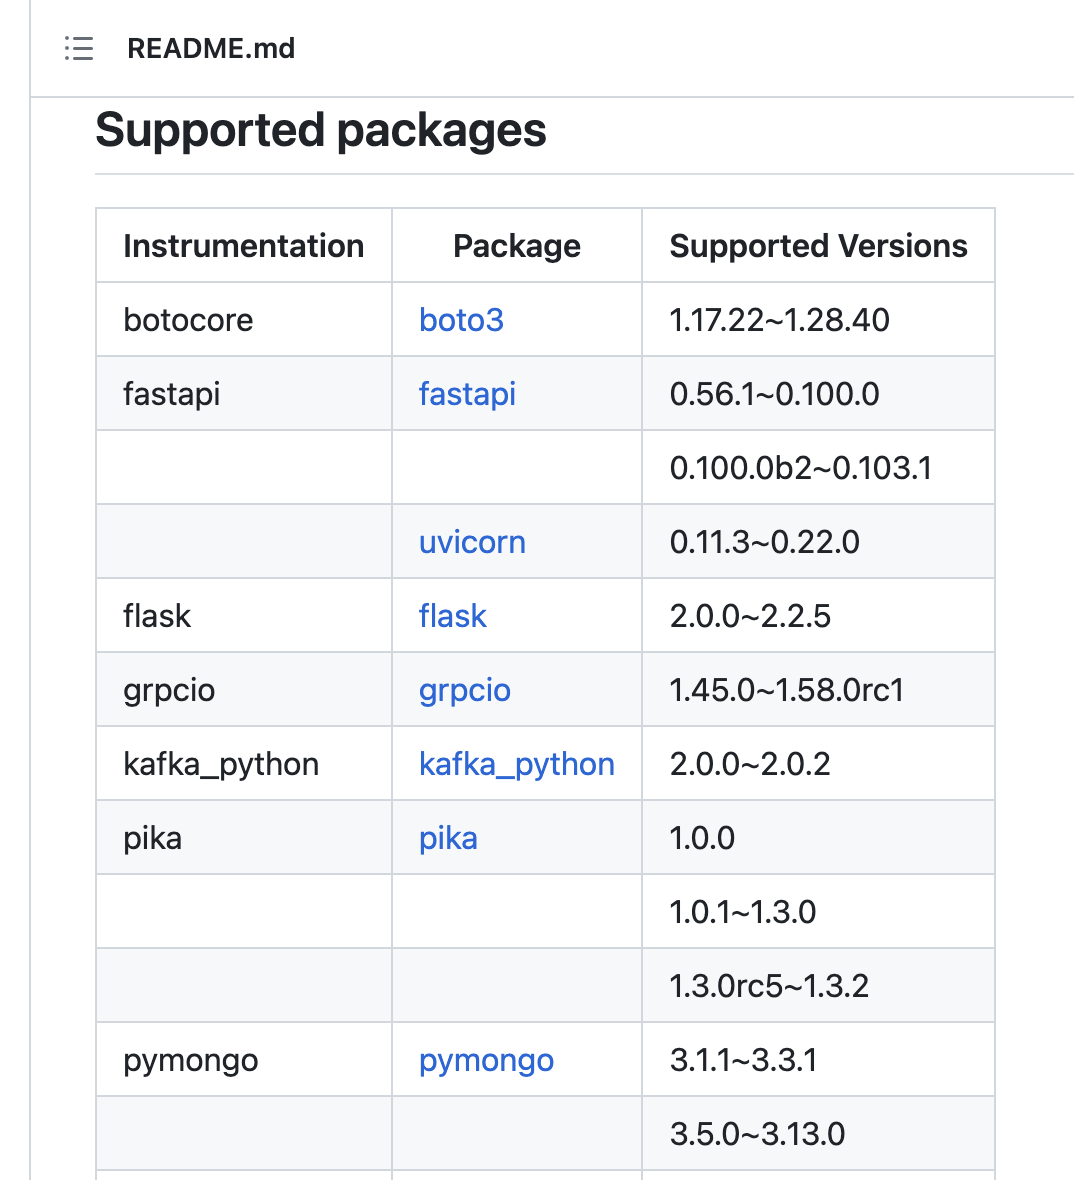
It’s worth noting that Lumigo container distributions offer enhanced support for popular language libraries. In the case of the Lumigo Python distribution, it includes support for the pika library, which significantly enhances the depth and richness of trace data collected from monitored application deployments within Lumigo.
Hopping Towards Better RabbitMQ Monitoring
Effectively monitoring RabbitMQ is essential for maintaining the health and reliability of your distributed systems. Understanding the metrics provided by RabbitMQ is the first step in troubleshooting and optimizing its performance. With insights into queue, connection, channel, resource utilization, user activity, memory usage, disk space, network, and log analysis metrics, you can proactively address issues before they disrupt your application. While RabbitMQ offers robust built-in tools for debugging, it’s important to recognize that they provide only a partial view of your application’s complexity. For a comprehensive diagnostic overview, consider incorporating broader debugging strategies.
To supercharge your RabbitMQ debugging efforts, give Lumigo a try. Sign up for a free Lumigo account, deploy one of our containerized distributions or use the Lumigo Kubernetes operator, and experience seamless end-to-end tracing for rapid issue identification. Whether you’re a developer or a system administrator, Our auto-instrumentation offers a valuable toolset to ensure the smooth operation to detect issues within your RabbitMQ-based applications.