Mar 15 2024

As software systems become more complex, navigating their inner workings has become increasingly difficult due to the evolution of more advanced architectures. While distributed systems, such as microservices and cloud-native architectures, offer benefits in scalability and agility, they also make it more challenging to pinpoint and resolve system issues. Traditional methods for tracking errors are often insufficient in these multifaceted environments. As a result, understanding and diagnosing problems can feel like searching for a needle in a haystack. It’s no longer enough to ensure the seamless operation of a single application; instead, there is a need for a comprehensive view that encompasses the entire network of interacting services.
This is where the OpenTelemetry project has helped change the telemetry data collection process, taking a more holistic and unified approach to observe the behavior of interconnected system components with a more standardized way to extract insights, from tracing individual requests to aggregating logs and metrics. This creates a clearer understanding of how requests and data move through the complex services web. This has also brought a fundamental change within the wider tech industry with a rapidly growing adoption of opentelemetry and a universal approach to understanding application deployments.
Understanding OpenTelemetry
OpenTelemetry traces its origins back to the convergence of two open-source projects: OpenCensus from Google and OpenTracing from the Cloud Native Computing Foundation (CNCF). This merging of minds and technology was driven by a shared vision to set a standard for instrumenting applications and collecting telemetry data such as traces, metrics, and logs. The goal was to provide an integrated set of APIs, libraries, agents, and instrumentation that would work seamlessly across different platforms and languages. By doing so, OpenTelemetry aimed to simplify observability in modern software applications, making monitoring, debugging, and optimising performance across distributed systems easier.

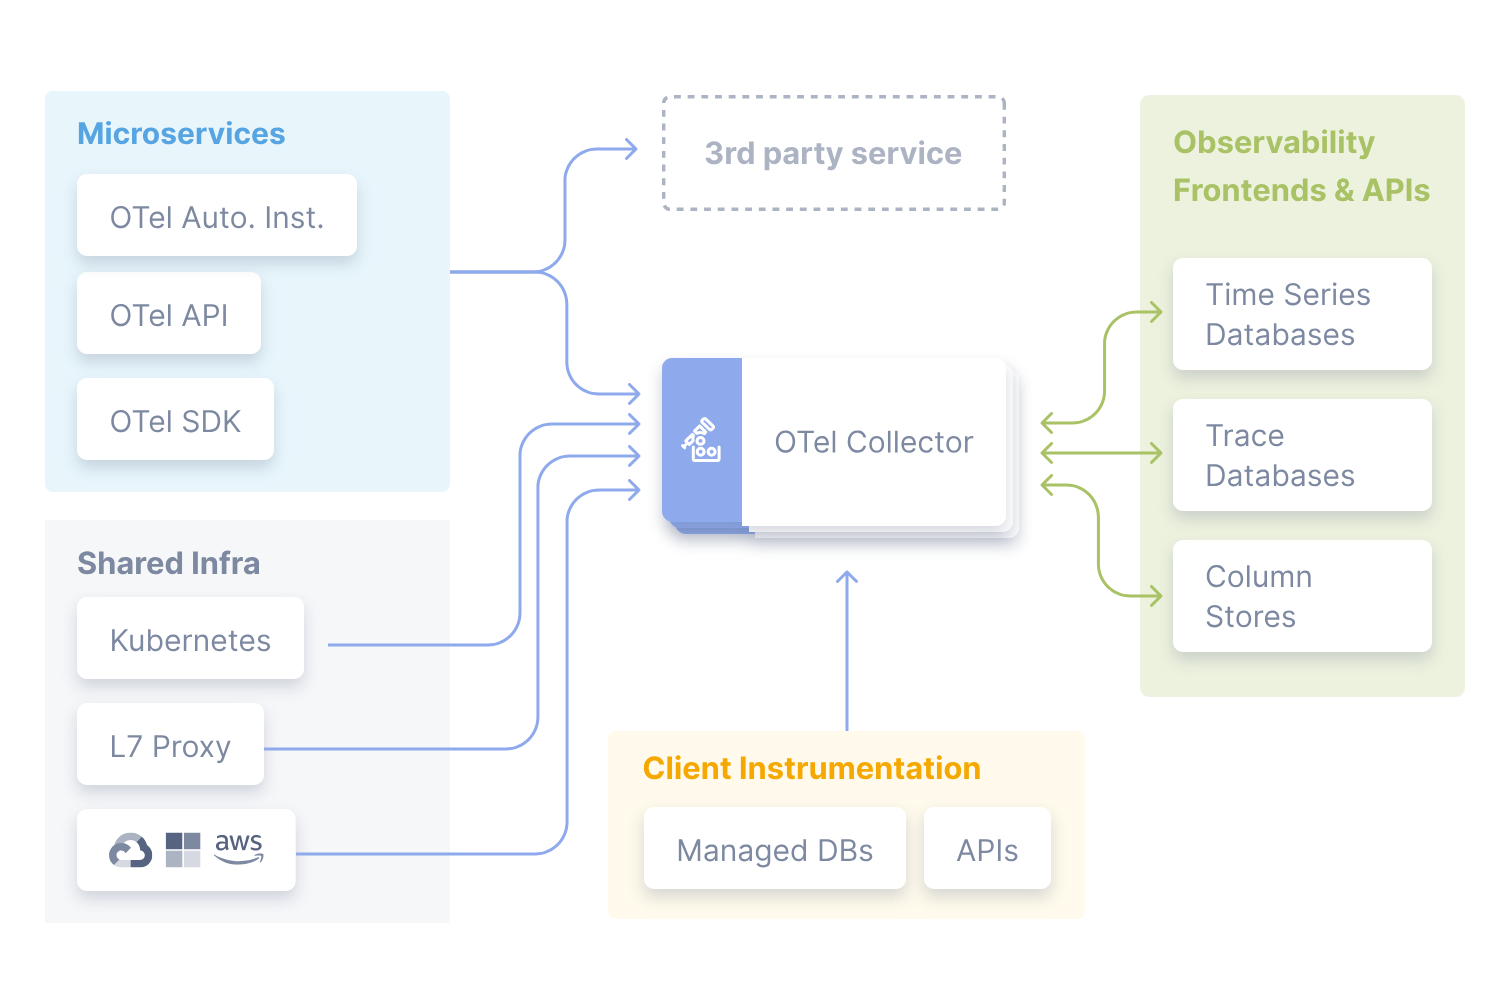
At its core, OpenTelemetry provides a unified framework that captures telemetry data from your applications and services. It consists of three main components: the API, the SDK, and the Collector. The API defines the interfaces and data types used for tracking application behavior and telemetry, enabling the integration of telemetry collection directly into code. The SDK is an implementation of the API, the collection and export of data, allowing for customization and configuration to suit different operational needs. The Collector, often deployed as a separate service, receives processes and exports telemetry data to various backend monitoring tools and services. This modular architecture allows OpenTelemetry to offer a flexible and extensible approach to observability, catering to the evolving needs of software architectures.
Let’s take a look at how it works
Getting set up
This will walk you through setting up a basic Node.js application that uses OpenTelemetry to trace application operations and exports these traces to a monitoring service using the OpenTelemetry Protocol (OTLP) with an authorization header specifically tailored for Lumigo.
Before we get underway, you will need a few things:
– Node.js installed in your development environment
– A Lumigo account and a Lumigo token
First, Create a new directory for your project and navigate into it:
mkdir nodejs-opentelemetry-demo & cd nodejs-opentelemetry-demo
Initialize a new Node.js project:
npm init -y
Then install the necessary OpenTelemetry packages by running:
npm install @opentelemetry/api @opentelemetry/sdk-trace-base @opentelemetry/exporter-trace-otlp-http @opentelemetry/resources @opentelemetry/semantic-conventions
Now create a file named app.js in the project root directory and copy over the following code:
// app.js
const { trace } = require('@opentelemetry/api');
const { Resource } = require('@opentelemetry/resources');
const { BasicTracerProvider, SimpleSpanProcessor } = require('@opentelemetry/sdk-trace-base');
const { OTLPTraceExporter } = require('@opentelemetry/exporter-trace-otlp-http');
const { SemanticResourceAttributes } = require('@opentelemetry/semantic-conventions');

// Replace '<Your_Token_Here>' with your actual Lumigo authorization token
const lumigoToken = "<Your_Token_Here>";

// Ensure the environment variable for OTLP endpoint is set
process.env.OTEL_EXPORTER_OTLP_ENDPOINT = "https://ga-otlp.lumigo-tracer-edge.golumigo.com";

// Create a tracer provider with a custom service name for your application
const tracerProvider = new BasicTracerProvider({
  resource: new Resource({
    [SemanticResourceAttributes.SERVICE_NAME]: "your-service-name",
  }),
});

// Configure the OTLP exporter with Lumigo's endpoint and the authorization token
const otlpExporter = new OTLPTraceExporter({
  headers: {
    "Authorization": `LumigoToken ${lumigoToken}`,
  },
});

// Add a SimpleSpanProcessor to the TracerProvider using the OTLP exporter
tracerProvider.addSpanProcessor(new SimpleSpanProcessor(otlpExporter));

// Set the global tracer provider
trace.setGlobalTracerProvider(tracerProvider);

// Retrieve the tracer
const tracer = trace.getTracer("example-tracer");

// Application logic that generates a span
const main = () => {
  const span = tracer.startSpan("example-span");

  // Simulate some work
  setTimeout(() => {
    console.log("This is a simple span example being exported to Lumigo");

    // End the span and export it to the configured backend
    span.end();

    // Ensure to shut down properly to flush and export all remaining spans
    tracerProvider.shutdown().then(() => console.log('Tracing terminated'));
  }, 1000);
};

main();
In this code, replace '<Your_Token_Here>' with your actual Lumigo authorization token and set "your-service-name" to a name that represents your app or you can run it using the name above. This code basically simulates an application operation, tracing it as example-span. The span is then exported to Lumigo via the OTLP exporter configured with your lumigo token from the prerequisites. This simple code snippet application can be used as an example of using powerful OpenTelemetry open-source libraries to instrument your applications via an OTLP endpoint.
Lastly, Run the demo app using this command in the project root from terminal:
node app.js
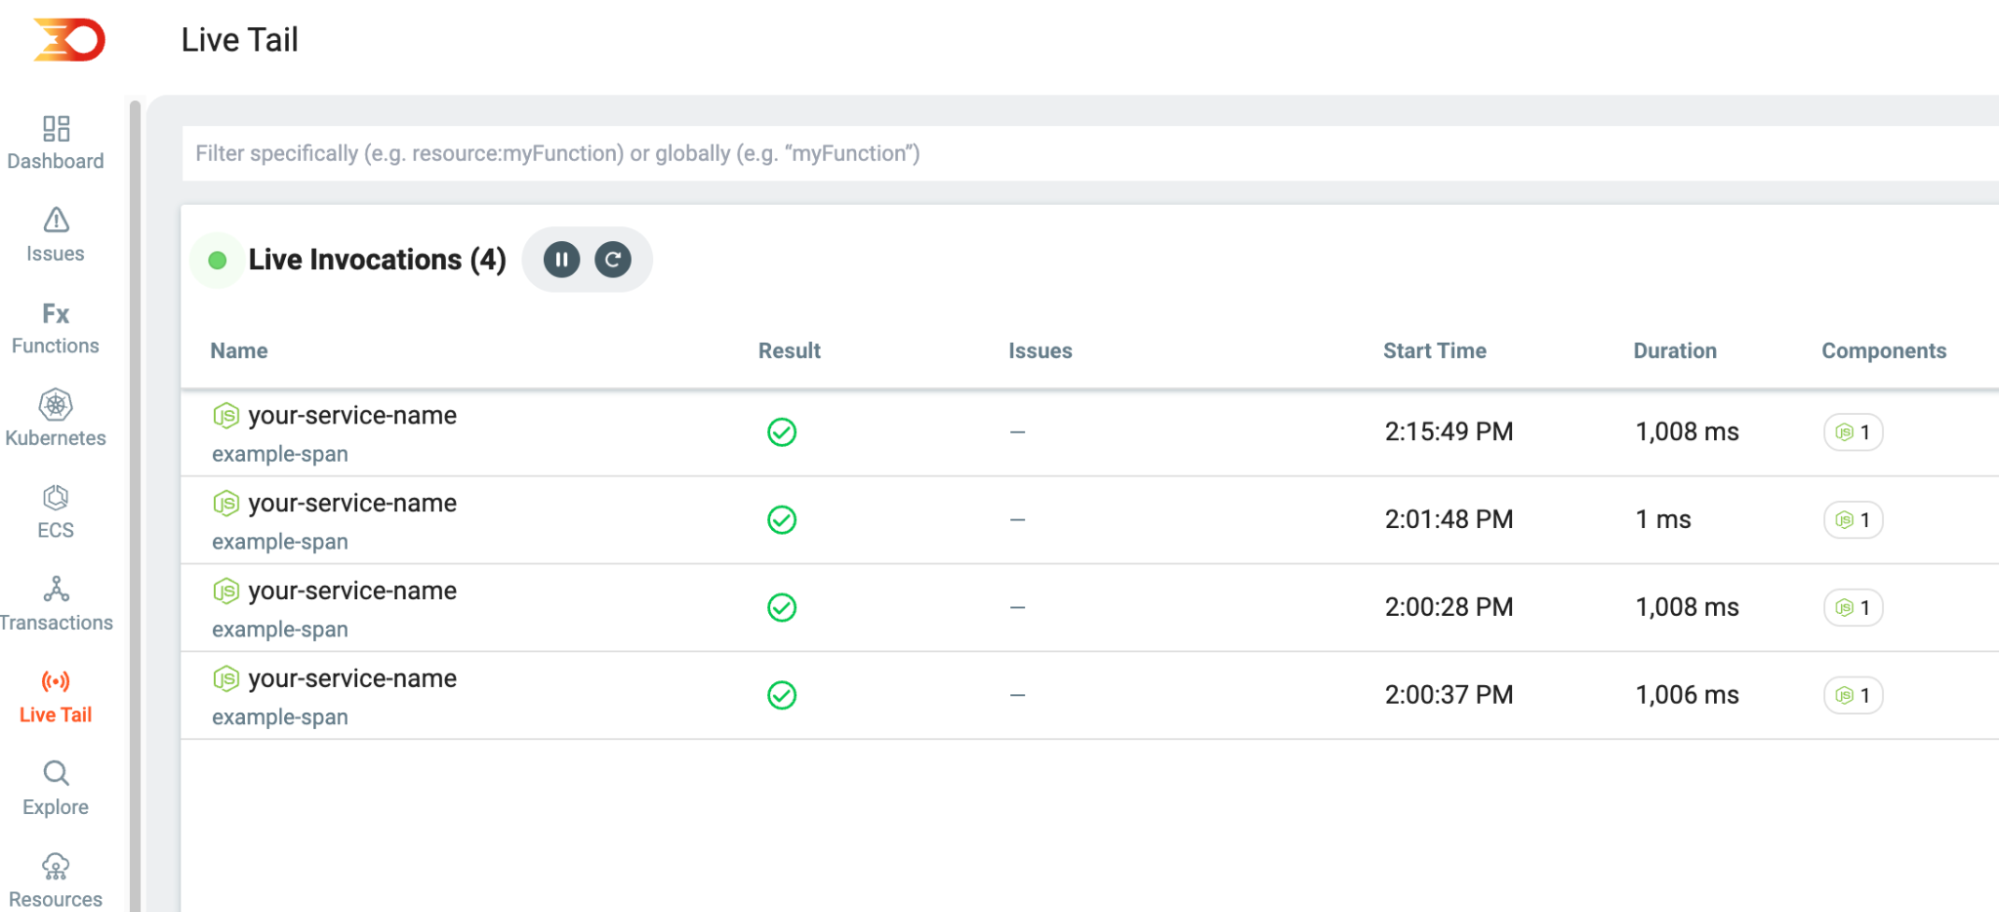
Run the app a few times to send over a few traces, then log into your Lumigo dashboard. You should begin seeing telemetry data from your NodeJS application within the live innovations tab. Explore the various features Lumigo offers, such as tracing, metrics visualization, and alerting, to gain insights into your application’s performance.

This basic setup is a good starting point for integrating OpenTelemetry into your applications utilizing the Open-Source libraries from the OpenTelemetry project. This also brings multiple opportunities to explore additional OpenTelemetry features, such as custom attributes, events, and more complex span relationships.
Sign up and test out your apps
Instrumenting your NodeJS application with Lumigo’s OTLP endpoint provides a powerful way to monitor and debug your application using the open-source OpenTelemetry libraries. If you want an even easier way to trace your applications and deployments, sign up for Lumigo check out some of the ways it can help in auto-instrumenting your NodeJS apps with no-code changes required.
Remember, this demo is just the beginning. Explore further by instrumenting different aspects of your application, experimenting with various OpenTelemetry exporters, and leveraging the full suite of features offered by Lumigo. Happy coding!

