


As Kubernetes adoption surges across the industry, AWS EKS stands out as a robust solution that eases the journey from initial setup to efficient scaling. This fully managed Kubernetes service is revolutionizing how businesses handle containerized applications, offering agility, scalability, and resilience.
However, a successful EKS deployment isn’t just about orchestration; it’s intrinsically tied to robust monitoring and tracing. While AWS offers CloudWatch as its built-in solution for monitoring, it’s essential to note that, like all tools, it has its nuances. While CloudWatch can provide valuable insights, it may not always offer an immediate or lucid perspective on potential issues. It’s crucial to recognize these intricacies, ensuring an all-rounded approach to maintaining EKS deployments at their peak performance.
Understanding EKS and Cloudwatch
EKS control plane logging stands out as an indispensable tool, offering both audit and diagnostic logs right from the Amazon EKS control plane. Funneled directly to CloudWatch Logs, these logs are instrumental in fortifying the security and performance of your clusters. Designed for versatility, Amazon EKS allows users to cherry-pick the log types they deem essential, bundling these logs as log streams into a unified group for every EKS cluster within CloudWatch.
At the heart of this flexibility is the option for users to toggle between different log types for both new and existing EKS clusters. Whether using the AWS Management Console, the AWS CLI, or the Amazon EKS API, you can enable or disable each log type specific to a cluster. Once activated, logs should flow from the EKS cluster into CloudWatch Logs situated in the same account.
However, it’s crucial to be mindful of the associated costs: alongside the standard Amazon EKS pricing for running each cluster, you’ll incur charges for CloudWatch Logs data ingestion, storage, and any additional AWS resources, such as EC2 instances or EBS volumes, that form part of your cluster.
Enabling Cloudwatch Logs for New EKS Deployments
With your CLI at the ready, it’s time to enable the control plane logging on a newly created cluster. Now, let’s proceed to create the new EKS cluster with logging enabled. The following command assumes you’ve set up the necessary VPC, subnets, and other prerequisites for EKS:
aws eks create-cluster \
    –name your-new-cluster-name \
    –region region-code \
    –role-arn your-role-arn \
    –resources-vpc-config subnetIds=subnet-id1,subnet-id2,…,securityGroupIds=sg-id1,sg-id2,… \
    –logging ‘{“clusterLogging”:[{“types”:[“api”,”controllerManager”],”enabled”:true}]}’
Remember to replace placeholders (`region-code`, `your-new-cluster-name`, `your-role-arn`, and the `subnet` and `securityGroup` IDs) with your specific deployment values.
After running this command, AWS will start creating your EKS cluster, and you’ll receive an output similar to:
{
    “cluster”: {
        “name”: “your-new-cluster-name”,
        “arn”: “arn:aws:eks:region-code:account-id:cluster/your-new-cluster-name”,
        “status”: “CREATING”,
        …
    }
}
You can then track the creation status on that cluster by using:
aws eks describe-cluster –name your-new-cluster-name –query “cluster.status”
Once the cluster’s status turns to “ACTIVE”, it indicates that your cluster is ready with CloudWatch logging enabled.
Enabling Cloudwatch logs for Existing EKS Deployments
If you’ve already got a cluster or two running feel free to use those for this next part, otherwise let’s extend the logging capabilities from our `create-cluster` above. Let’s begin by getting a list of clusters to make sure that the cluster name is correct when we enable (or extend) logging:
aws eks list-clusters
This should return a list of available clusters associated with your account. Remember, if you need to see clusters from a particular AWS profile, you can use the –profile [profile name] flag to specify a stored local profile.
Next we are going to run the `update-cluster-config` command to ensure all available log types – API server, audit, authenticator, controller manager, and scheduler – are sent to CloudWatch Logs.
Note: In the create-cluster example above, we only enabled api and controllerManager logs going into Cloudwatch. This update-cluster-config will extend that and update with the full logging capabilities of the integration:
aws eks update-cluster-config \
    –region region-code \
    –name your-cluster-name \
    –logging ‘{“clusterLogging”:[{“types”:[“api”,”audit”,”authenticator”,”controllerManager”,”scheduler”],”enabled”:true}]}’
Replace region-code with your AWS region code and your-cluster-name with your EKS cluster name.
Upon running the command, you’ll receive output resembling:
{
    “update”: {
        “id”: “idxx-xx-xxxx-xxxx-xxxx-xxxxxxxxxx”,
        “status”: “InProgress”,
        “type”: “LoggingUpdate”,
        …
    }
}
Monitoring the Update
Track the update’s progress by utilizing the update ID provided in the previous output:
aws eks describe-update \
    –region region-code \
    –name your-cluster-name \
    –update-id sample-id-xxxx-xxxx-xxxx-xxxxxxxxxx
Once the update completes, the status should reflect as “Successful”.
Accessing the Logs on CloudWatch
While the AWS Command Line Interface (CLI) offers precision and scriptability for those familiar with its syntax, it’s worth noting that CloudWatch’s console brings a graphical edge when it comes to viewing aggregated telemetry data. The console’s ability to visually represent collated log data can provide rapid insights.
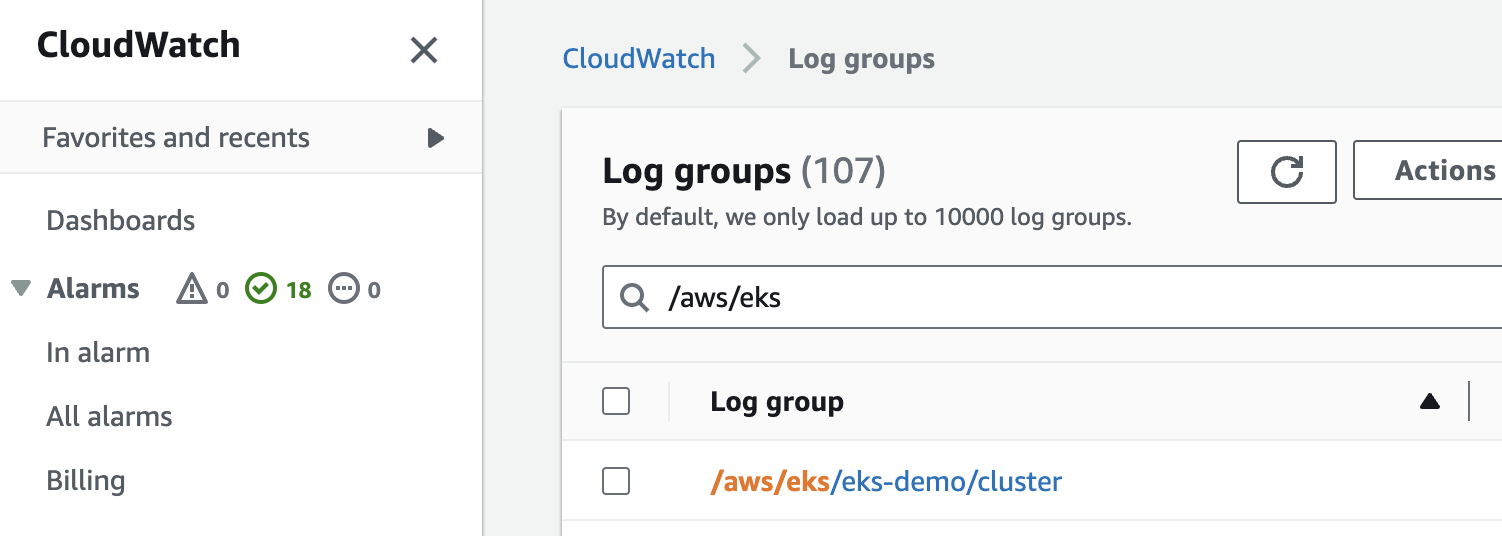
To locate your logs, simply navigate to the CloudWatch service in the AWS Management Console, and click on “Log groups” in the left-hand navigation pane. Filter or search for log groups prefixed with `/aws/eks`, followed by your cluster’s name, to find the specific logs associated with your EKS cluster.
However, in this section, we’ll focus on log access using the AWS CLI to access your EKS control plane logs stored in CloudWatch.
- List Available Log Groups:
To get started, first list the available log groups. This helps you identify the group associated with your EKS cluster:
aws logs describe-log-groups –query ‘logGroups[*].logGroupName’
- Identify Your EKS Cluster Log Group:
The log group associated with your EKS cluster will have a naming convention like `/aws/eks/your-cluster-name/cluster`. Replace `your-cluster-name` with the actual name of your EKS cluster.
- List Log Streams Within the Log Group:
Within the chosen log group, you’ll find multiple log streams. To list them:
aws logs describe-log-streams –log-group-name /aws/eks/your-cluster-name/cluster
- Fetch Specific Log Events:
After identifying the particular log stream you want to explore, retrieve its logs using the following command, replacing `your-log-stream-name` with the actual stream name from step 3
aws logs get-log-events –log-group-name /aws/eks/your-cluster-name/cluster –log-stream-name your-log-stream-name
Navigating the Sea of Logs
Logs, while comprehensive, can often be overwhelming due to their volume. But, with the right tools, you can transform this tide of data into actionable insights. Lumigo’s Kubernetes operator is your ultimate surfboard in the sea of log data, cutting through the noise and providing clarity. Its integration into Kubernetes turns verbose logs into a coherent narrative, making issue detection and debugging a sea breeze.
In this sprawling ocean of information, Lumigo ensures you’re not just collecting logs but truly understanding them. Ready to surf those logs with ease and clarity? Sign up for a free Lumigo account and take our Kubernetes operator for a cruise.