


Serverless backends have different monitoring challenges when compared with traditional applications, mostly due to the distributed and proprietary nature of serverless. Making monitoring and debugging efficient for serverless requires a unique set of tools and techniques. In this article, we’ll discuss the challenges of debugging serverless backends and how to utilize third party tools to improve the monitoring process.
Challenges in Monitoring and Debugging Methods
You might be familiar with debugging serverless applications via CloudWatch, which is a common tool for monitoring and debugging small applications, but as applications grows, it becomes ineffective. Let’s look at some of the challenges of monitoring and debugging modern cloud applications:
- Developers require deeper visibility than the basic matrices and graphs that CloudWatch provides.
- Limited ability to monitor across all services in a centralized place.
- Can’t customize the metrics dashboard
- The metrics dashboard can’t be customized, Monitoring through CloudWatch is time-consuming
- You have to know which service caused the issue in order to find the logs accurately
- Real-time updates are not given by default
- Hard to track data movements
As a result, several platforms have emerged to bridge these gaps. Let’s look at how to utilize them in combination with the tools provided by AWS for effective monitoring and debugging.
1. Identifying Cold Starts
Cold starts are one of the most common performance bottlenecks in serverless applications. Since Lambda functions run on demand, it takes a few seconds to spin up, causing this delay.
You can avoid cold starts by using Lambda pings or provision concurrency, but this isn’t a cost-effective approach if we use them for all the Lambda functions. Therefore, we need to prioritize and reduce their impact by identifying the most critical ones with high cold start times.
Using AWS CloudWatch logs to find cold starts
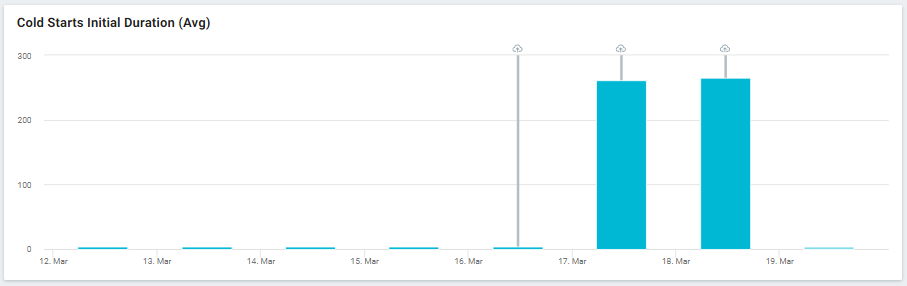
AWS CloudFront logs only provide the duration of the cold start. However, you can find the cold start duration from the Init Duration parameter in the logs.
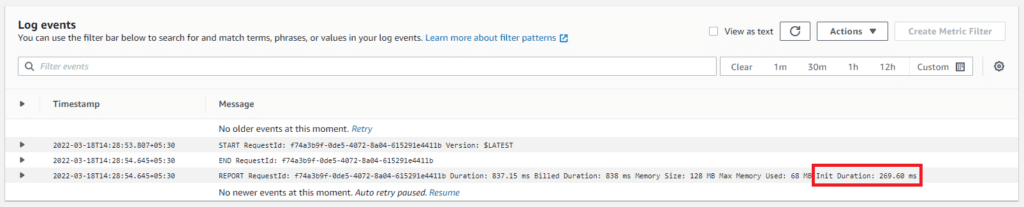
However, CloudWatch does not provide additional information or graphs to compare and contrast all the invocations. Therefore, you have to do all the calculations manually.
Using Lumigo to find cold starts
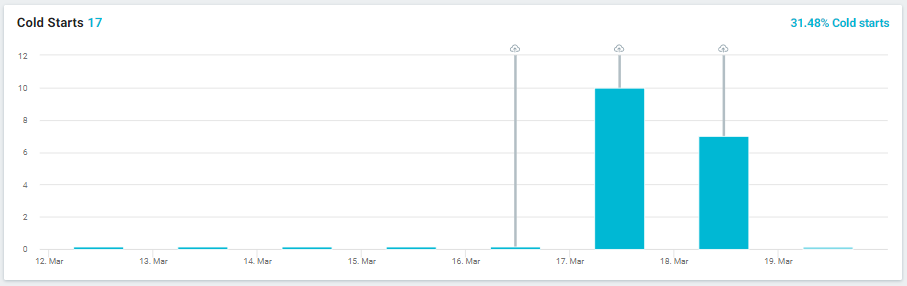
Lumigo provides a centralized view for developers to quickly monitor key metrics with attractive user interfaces. For example, you can find a separate table named “Functions with the Most Cold Starts”. This table contains the cold start details about all traced functions, including the number of cold starts and cold start percentages. You can also click on the Lambda function name and get more detailed graphs on that function’s cold starts.
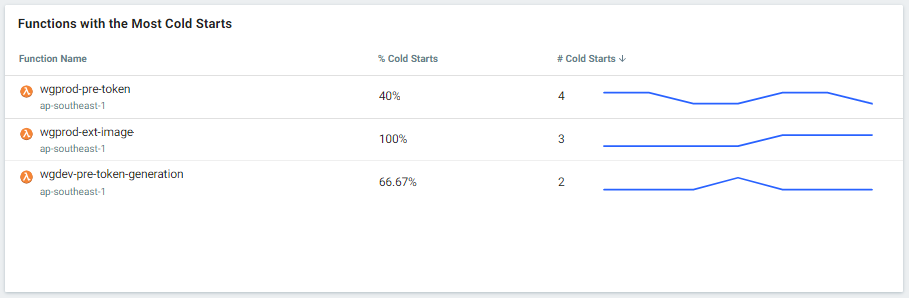
Also, you can click on the Lambda function name and get more detailed graphs on that function’s cold starts.
2. Using Live Logs for Serverless Debugging
Real-time logs are another essential part of debugging serverless applications but it is one of the biggest challenges developers face in traditional monitoring tools. Typically, they have to come up with a custom implementation to enable real-time logs.
For example, using CloudWatch logs for real-time monitoring is ineffective since we have to know the log group, and there can be delays in log updates. Developers must manually configure AWS CLI live tail or use utility libraries like qwas, cwtail to monitor real-time logs.
If you are using frameworks like Pulumi or serverless, you can use the built-in features of those frameworks to monitor real-time logs. For example, you can continuously monitor AWS CloudWatch tailing logs with Pulumi by running pulumi logs -f command.
Lumigo supports monitoring real-time logs with Live Tail and showcases all the Lambda invocations in real-time with event details, environment variables, execution tags, and log entries.
The user interface is descriptive enough to identify errors and issues quickly, and you can pause, start or clear the Live Tail logs as you need.
3. Distributed Tracing
Distributed tracing is tracking and observing service requests that pass through multiple services. It is crucial for serverless backend monitoring since serverless backends are combined with multiple services like Lambda, API Gateway, DynamoDB, etc.
Using AWS X-Ray for distributed tracing
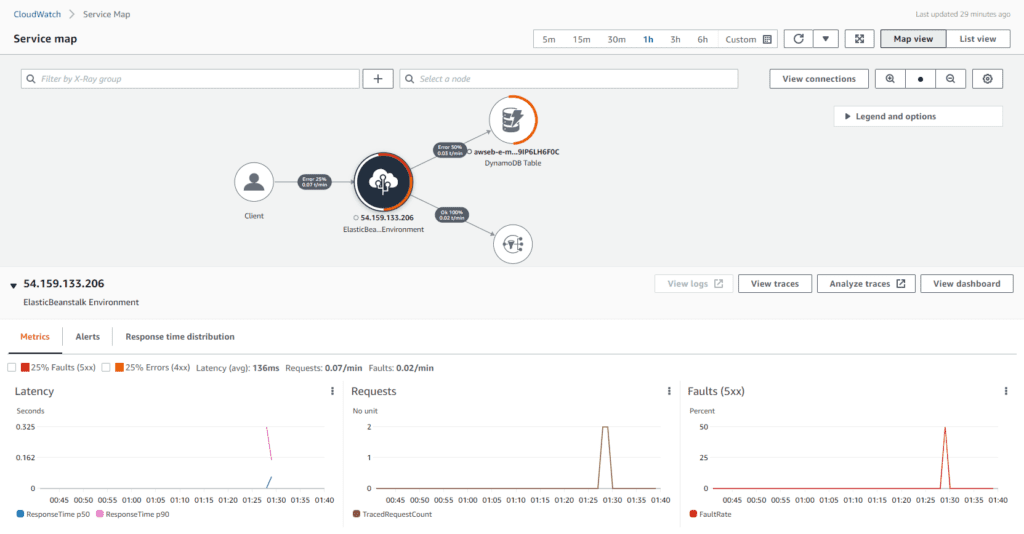
AWS X-Ray allows developers to analyze and debug production-level applications with multiple services. It provides a graphical overview of the services used in the application, and you can monitor how a request travels from one service to another. X-Ray supports both production and development environments, and it is instrumental in pinpointing the errors between multiple services.
The image below shows a service map of a sample application. As you can see, it contains a huge amount of information that can be used for troubleshooting purposes. In addition, you can click on the different services on the map to get details about each service separately.
AWS X-Ray also provides trace requests as they travel between services. If there is an error, you can investigate these traces separately to identify the root cause.
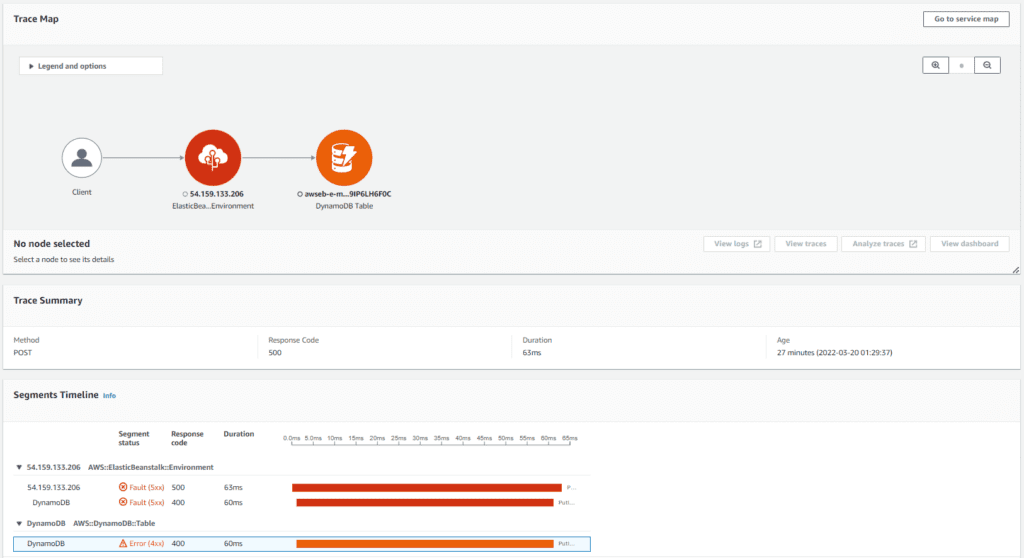
Overall, AWS X-Ray provides a large amount of information, and it is essential to be aware of its features to get the maximum out of it.
Using Lumigo for distributed tracing
Lumigo tracks the data flow through your resources and generates insightful visualizations You can view it from the System Map tab, which offers several filtering options to identify resources with issues.
You can also monitor the individual transaction details from the Transactions tab which lists all the Lambda invocations. You can select invocations one by one to get a detailed view with graphs, timelines, and logs similar to AWS X-Ray.
4. Error Alerts
Error alerts are another important part of a debugging system that helps developers identify errors in production environments. The information provided in these alerts can save a significant amount of debugging time.
AWS CloudWatch Alarms
AWS CloudWatch has an inbuilt alarm system that creates alerts based on the log details. You can set up CloudWatch alarms by navigating to the Alarms section in the CloudWatch console. First, you need to specify the metrics and conditions that must be satisfied to trigger the alert. You can select the metrics based on resource, function name, or metric name. In the following example, “Errors” is the metric based on the function name, and the alarm will be triggered whenever the error count is greater than 1.
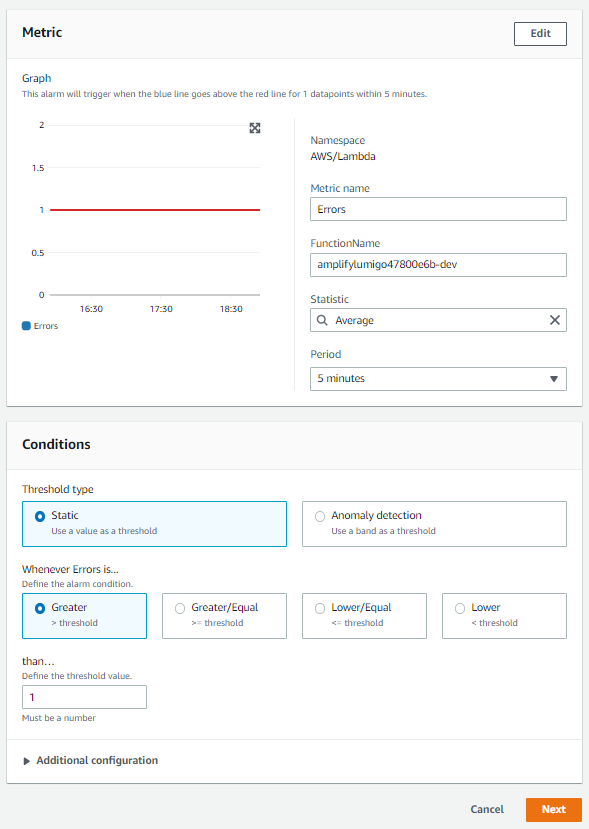
After that, you need to create a new notification and include the email addresses to receive alerts. Overall, CloudWatch alerts do a pretty good job of informing users when an error occurs in their application but the alert creation process can be a bit challenging if you do not have a good understanding of CloudWatch.
Lumigo Alerts
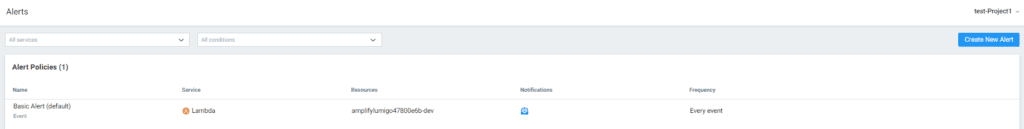
Like CloudWatch, Lumigo provides a separate tab named Alerts to display all available alert policies.
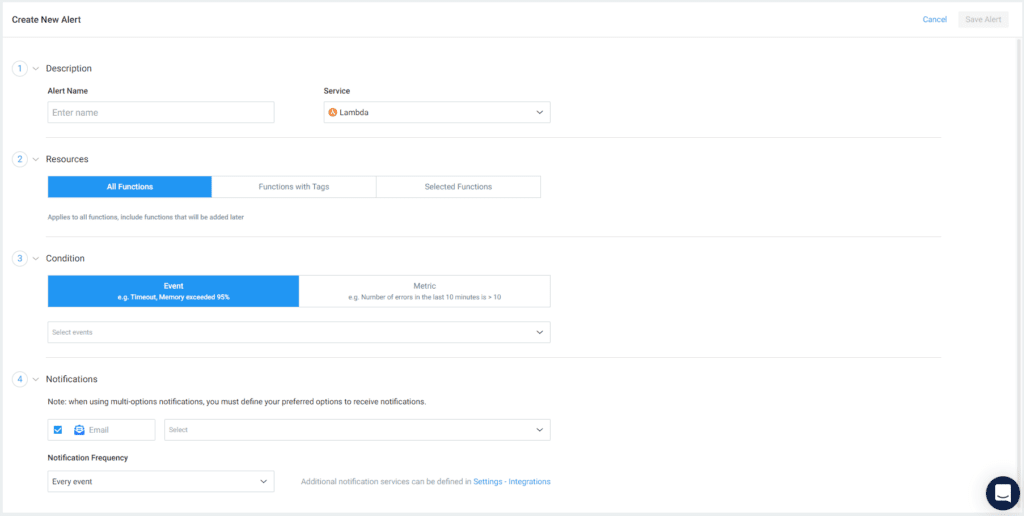
You can start creating new alert policies by clicking the Create New Alert button, and the process is way easier than creating CloudWatch alerts. The alert creating window has four separate sections, and you can choose the configuration you need from those sections within seconds.
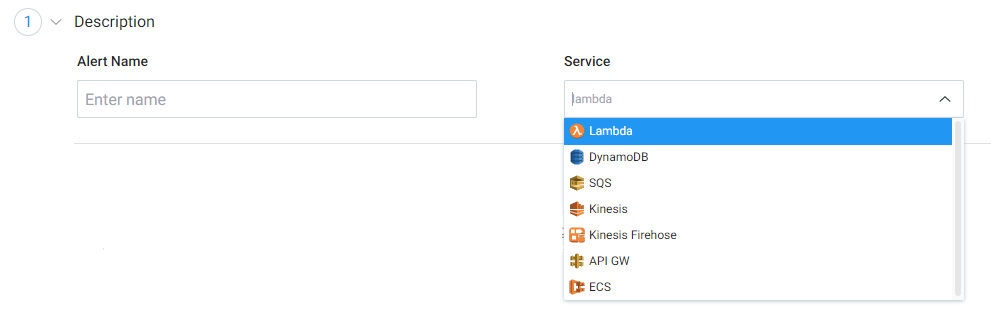
Description
Under the Description section, you need to enter an alert policy name and choose the service from the dropdown. Lumigo alerts support 7 AWS services, including Lambda, DynamoDB, SQS, Kinesis, API Gateway, and ECS.
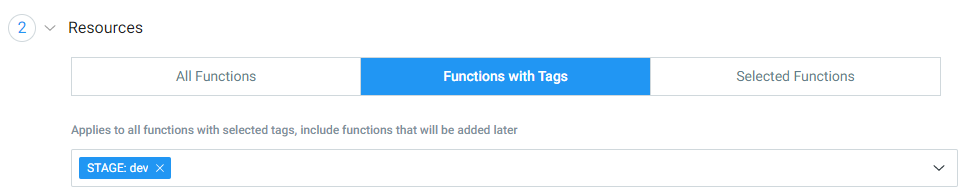
Resources
Here, you need to select the resource to set the alert. Options in this section can change based on the service you select in the Description section. For example, if you choose Lambda, you can select all functions, functions with specific tags, or a set of selected functions.
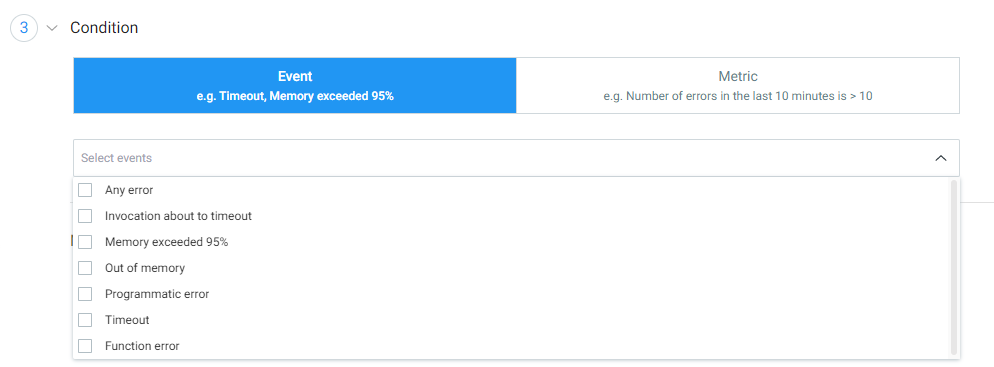
Conditions
In the Condition section, you can select the events and metrics which the alerts trigger. Again, the options in this section change based on the service you select. For example, if you choose Lambda, you can configure both events and metrics but if you choose DynamoDB, you will only be able to configure metrics.
Notifications
The Notification section allows you to select the notification type and frequency of notification.
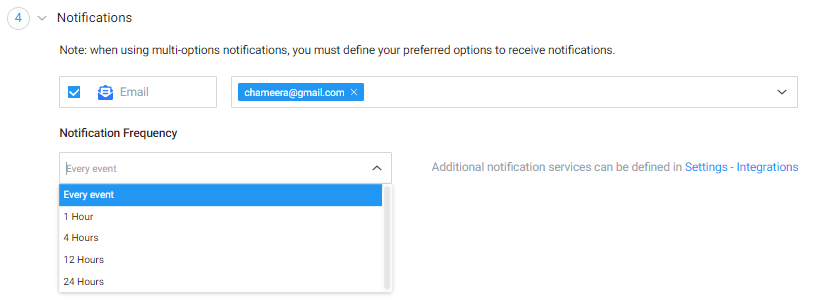
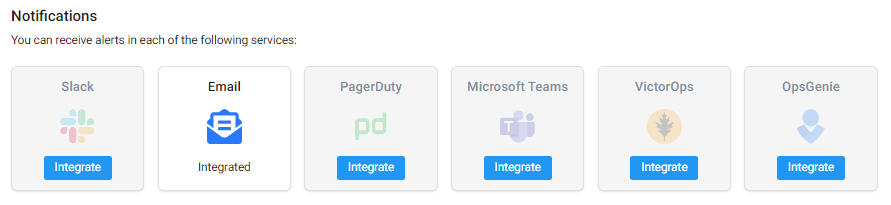
In addition to the email notifications, you can integrate tools like Slack, Teams with Lumigo to receive alerts more conveniently.
In order to improve the quality and reliability of our applications, it’s essential that we, as developers, are aware of the different methods of monitoring and debugging serverless applications. In this article, you learned about the challenges in traditional monitoring and debugging of serverless backends and how different tools can help resolve them. Most of these tools have modern UIs and highlight critical information allowing developers to notice issues quickly so, I hope you have found this article helpful. Thank you for reading!