


At Lumigo, we keep improving the coverage and quality of our distributed tracing instrumentation to give you, through Lumigo’s transactions, the most accurate and intuitive representation of how your distributed system behaves.
In this blog, we cover a recent development for the Amazon SQS instrumentation in Lumigo’s OpenTelemetry distro for Python, providing a seamless experience for a scenario that otherwise would result in confusing, broken transactions and lost insights.
The not-so-basics of distributed tracing
Distributed tracing is a form of monitoring that consists of collecting data about how specific requests are served by a distributed system. With distributed tracing you can see which requests are triggered “on cascade”, which requests fail, how failure spreads and how latency accumulates in the distributed system.
Consider the following Webshop API example:
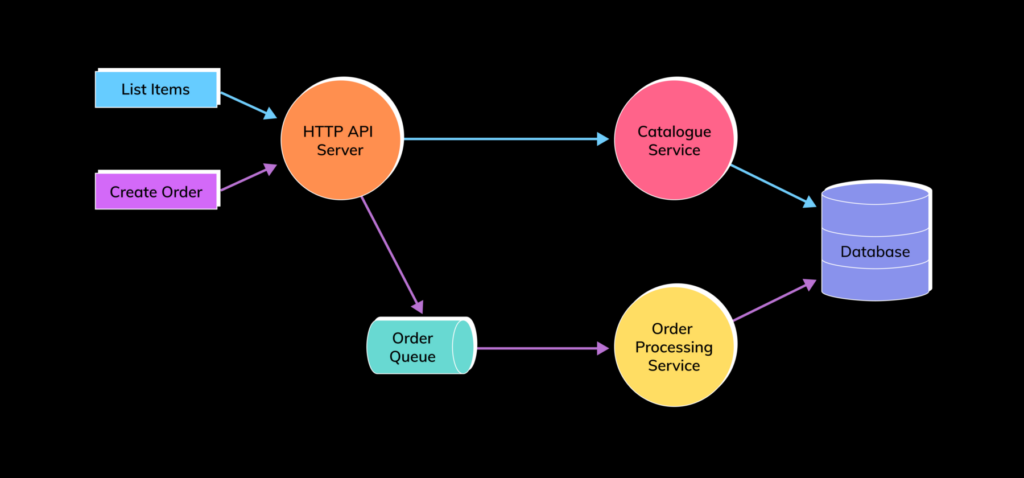
In the Webshop API system, due to the flow of requests, failures in the “catalogue service” may ripple backwards to the HTTP API server, and back to the end user. Issues with the database may affect either or both flows. The flows of the Webshop API are captured as traces: given one invocation of the “list items” or “orders queue” APIs. Those initial requests, and all that occur as a result of the flow, belong in the same trace.
From the perspective of data structures, a trace is a directed graph (very often a tree) of spans. Each span documents a request or some aspect of the inner processing of a system; the serving of an HTTP request, the querying of a database, the invocation of an Object-Relational Mapper library, etc.
Anatomy of a span
Consider this snippet:
import boto3

client = boto3.client("sqs", region_name="eu-central-1")
response = client.receive_message(
    QueueUrl="OrdersQueue.Url",
    MaxNumberOfMessages=1,
)
A Python snippet showing the retrieval of a message from SQS using the boto3.client.receive_message method.
When you execute this code, and the code is traced by an OpenTelemetry Python tracer using the opentelemetry-instrumentation-botocore instrumentation, it will generate a span with this kind of structure. (This example is not in the otlpjson format that can be sent to an ingestion endpoint that supports the OpenTelemetry Protocol (OTLP), but rather the less verbose output of the opentelemetry.sdk.trace.export.ConsoleSpanExporter.)
{
  "name": "SQS.ReceiveMessage",
  "context": {
	"trace_id": "0xe50f1efb6551bc9e1d6ed65ea8359439",
	"span_id": "0x2d36033a1a1cf491",
	"trace_state": "[]"
  },
  "kind": "SpanKind.CLIENT",
  "start_time": "2022-11-10T16:23:27.598884Z",
  "end_time": "2022-11-10T16:23:27.605149Z",
  "parent_id": "0x02e0a4aa99619bd5",
  "status": {
	"status_code": "UNSET"
  },
  "attributes": {
	"rpc.system": "aws-api",
	"rpc.service": "SQS",
	"rpc.method": "ReceiveMessage",
	"aws.region": "eu-central-1",
	"aws.request_id": "NZD4BK0R8CZBBMEXURDCM2JL3WUGBDKYH11G21DGJ00Y9WQNNAXJ",
	"aws.resource.name": "OrdersQueue",
	"aws.service": "sqs",
	"messaging.destination": "OrdersQueue",
	"messaging.system": "aws.sqs",
	"retry_attempts": 0,
	"messaging.message_id": "e851d27c-ded4-577f-3f9f-89c667e7834b"
  },
  "events": [],
  "links": [],
  "resource": {
	"telemetry.sdk.language": "python",
	"telemetry.sdk.name": "opentelemetry",
	"telemetry.sdk.version": "1.9.1"
  }
}
A JSON representation of the span representing the retrieval of a message from an SQS queue using Python’s boto3.
There’s a lot of data there, but when we look closely, a few things stand out:
 "context": {
	"trace_id": "0xe50f1efb6551bc9e1d6ed65ea8359439",
	"span_id": "0x2d36033a1a1cf491",
	"trace_state": "[]"
  }
The JSON snippet that documents the trace context in which this span has been created.
The “context” key contains the trace context, that is, the information used by the tracer to keep track of which trace it is recording (“trace_id”), and what the current span is (“span_id”). The trace identifier is going to be the same across all spans in the same trace. But each span has a distinct span identifier.
 "start_time": "2022-11-10T16:23:27.598884Z",
  "end_time": "2022-11-10T16:23:27.605149Z",
The JSON snippet that documents the start and end time of the span.
Spans have a temporal nature: they have a start and end time. Subtracting the start time from the end time (usually via an Epoch-based representation in milliseconds or nanoseconds), yields the span’s duration. In comparison, logs and events commonly have just the timestamp at which they occur.
"attributes": {
	"rpc.system": "aws-api",
	"rpc.service": "SQS",
	"rpc.method": "ReceiveMessage",
	"aws.region": "eu-central-1",
	"aws.request_id": "NZD4BK0R8CZBBMEXURDCM2JL3WUGBDKYH11G21DGJ00Y9WQNNAXJ",
	"aws.resource.name": "OrdersQueue",
	"aws.service": "sqs",
	"messaging.destination": "OrdersQueue",
	"messaging.system": "aws.sqs",
	"retry_attempts": 0,
	"messaging.message_id": "e851d27c-ded4-577f-3f9f-89c667e7834b"
  },
The JSON snippet that lists the span’s attributes, which describe what SQS call was executed.
Spans carry metadata (called attributes in OpenTelemetry) describing what the action consists of. In our SQS-centric case, the “rpc.service” and “rpc.method” describe that it is a call towards Amazon SQS, and the operation is “ReceiveMessage”. The “messaging.destination” attribute states that the queue from which the messages are fetched is called “OrdersQueue”, and the unique identifier of the one message that has been fetched is “e851d27c-ded4-577f-3f9f-89c667e7834b”.
"parent_id": "0x02e0a4aa99619bd5",
The JSON snippet that lists the parent of this span.
By far the trickiest and most fascinating aspect of spans are the relations they have with one another. In the example above, the “SQS.ReceiveMessage” span points to its parent span via the “parent_id” attribute, which contains the span identifier representing a not-shown (for reasons of brevity) “HTTP Server” span. “Send order message” operation is child to the “HTTP server” span that represents the serving of the “create order” HTTP request.
Indeed, using the “parent_id” on the various spans inside a trace, one can establish the trace’s graph-like structure:
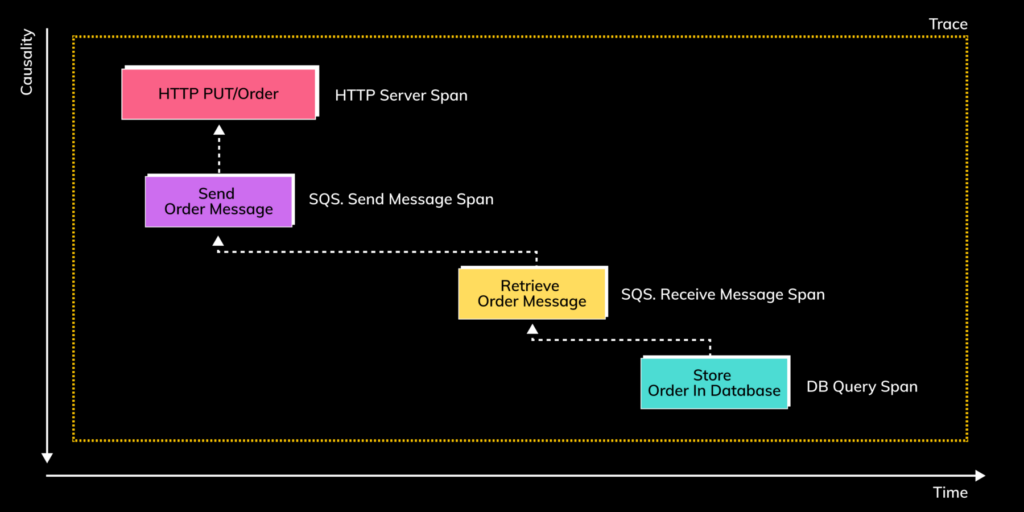
A “timeline” view of a trace of the “create order” flow, in which each rectangle is a span that is collected, and the arrows connecting the spans are the parent-child relations that represent causality. The direction of the vertical axis, which represents causality, is inverted (the arrow points down): the operation represented by the parent span causes the operations represented by the span’s children. But for technical reasons, the relations are implemented to point from the child to the parent.
Indeed, the accuracy of span relations make or break the user experience of the distributed tracing system. If, to set the stage for the rest of the blog post, the “DB.Query” span representing the storing of the order in the database cannot be correctly related with the “SQS.ReceiveMessage” span (that is, the “parent_id” of the “DB.Query” span is null, as opposed to being the “span_id” of “SQS.ReceiveMessage” span), you end up with two, separate traces:
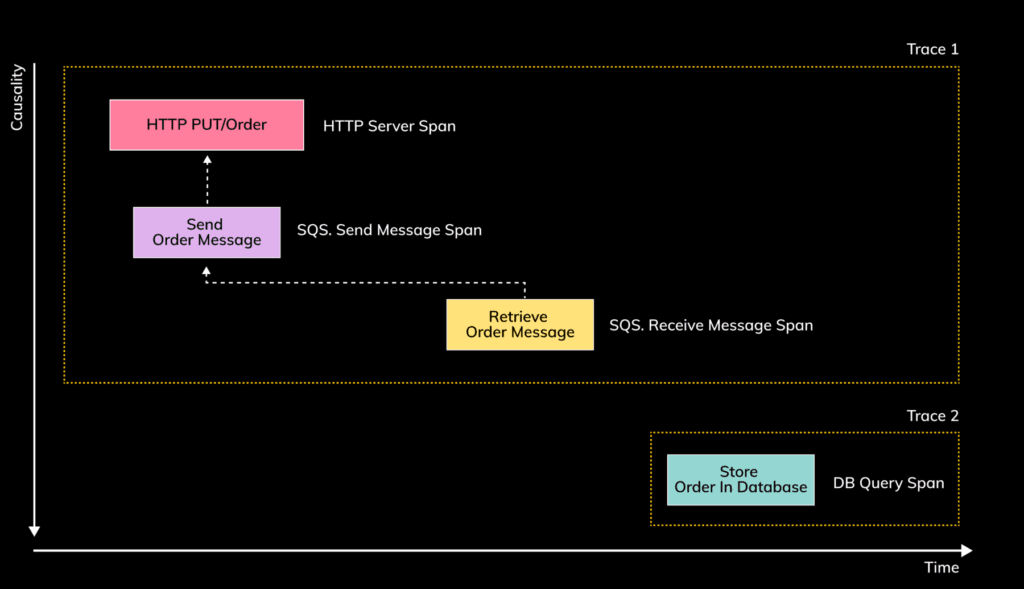
The two traces resulting from the “Create order” flow, but assuming that the causality between the “SQS.ReceiveMessage” and “DB.Query” spans cannot be captured by the distributed-tracing system.
In this case, due to the missing correlation between the “SQS.ReceiveMessage” and “DB.Query” spans, failures resulting from storing the order in the database cannot be correlated with the the retrieval of the message and, transitively, with the original end-user request to create the order. Such gaps really undermine the value of a distributed tracing system. Without knowing which orders have been lost with the failed query, and which users have been impacted, it is really hard to understand the impact of the failure and quickly put remedial actions in place. And it is not only about errors. Without the link between when the message has been queued, and when its processing failed, one cannot assess the latency with which the order has been processed. (Although, for the past ten years we all have been hearing that “slow is the new down”, a take I very much agree with, so we should treat high latency every bit as seriously as failures.)
Instrumentation in a nutshell
The structure of the trace as defined by the relations among its spans is fundamental to the usefulness of the trace. But how do spans and their relations get recorded? That happens through instrumentation.
Instrumentation is additional logic, either manually coded, or more often automatically injected by a tracer like the OpenTelemetry SDKs or Lumigo’s Lambda tracers into your application. At its most fundamental level, the overwhelming majority of instrumentations out there are based on some form of aspect-oriented programming: the instrumentation hooks into something, executing logic before or after specific methods are called to create and end the spans, and add on them the attributes that provide the span with a semantic.
import boto3
import json
from flask import request, Flask
client = boto3.client('sqs', region_name=aws_region)

app = Flask(__name__)

# Before the hello_world method, the "HTTP GET /api/greetings" span is
# started and various attributes like user-agent of the client, HTTP
# method, HTTP request headers and HTTP path are collected.
@app.route('/api/orders', methods=['PUT'])
def create_order():
   # context: "HTTP PUT /api/orders" span
   client.send_message(
     # create "SQS.SendMessage" span, with "HTTP PUT /api/orders" span
     # as parent
     QueueUrl="OrdersQueue.Url",
     MessageBody=json.dumps(request.get_json()), # Validate your inputs!
     # end "SQS.SendMessage" span before returning from client.send_message
   )

   return 'Order received!'
# After the hello_world completes, more attributes like status_code and
# response headers are recorded, and then the "HTTP PUT /api/orders" span
# ended. An ended span can no longer be modified, and is ready to be sent
# for processing downstream.

if __name__ == '__main__':
   app.run(host='0.0.0.0')
The listing of a simplistic Python Flask + boto3 application, showing an HTTP API that accepts orders via PUT methods on the “/api/orders” path, and sends the content of the order as a message in an SQS queue. The code listing uses comments to explain what is happening at the level of distributed tracing, where spans are started and ended, and their parent-child relations.
The example above shows a simplistic implementation of the HTTP API of our running example mixing Flask and boto3. When creating a new span, the current open span is its parent. This is a so-called synchronous-tracing scenario, and it is very common. For example, most HTTP and gRPC instrumentations work like this. So, if you keep a stack (as in the data structure, a.k.a. a first-in-first-out queue), adding newly-created spans on top of the stack as they are created, and removing the spans from the stack when ended, that will generally yield parent-child relations that capture the intuition of the end user.
Things get much more interesting when we deal with asynchronous tracing.
Messaging instrumentations in all their beauty and abject terror
To the distributed-tracing engineer, asynchronous instrumentations have perhaps no more feared impersonification than messaging instrumentations, and specifically, the instrumentation for message consumption APIs. That may be surprising, because in the previous section we have seen that the production of messages fits so neatly into the synchronous tracing scenario. Consider the following snippet:
from boto3 import client as Boto3Client
from pymongo import MongoClient
import os

client = Boto3Client("sqs", region_name="eu-central-1")

# context: none
response = client.receive_message( # create SQS.ReceiveMessage span
    QueueUrl="OrdersQueue.Url",
    MaxNumberOfMessages=1,
)

# context: none again!
if messages := response.get("Messages"):
  message = messages[0]

  # context: still none
  db = MongoClient(os.environ["MongoUrl"]).orders
  db.items.insert_one({ # create parent-less MongoDB span, start new trace
    "Order": message["Body"]
  })
A snippet combining boto3 and pymongo to store into a MongoDB database the content of an order retrieved as an SQS message.
Intuitively, one would say that the span created from the retrieval of the SQS message is the parent of the span documenting the MongoDB query, right? But unfortunately, that is not how it actually can work! The problem is the following: by the time the “client.receive_message” call is completed, the “SQS.ReceiveMessage” span has already ended, and it is no longer the active span! And any action “downstream” in the code path to the message reception, while intuitively the consequence of the message reception, will generate spans that are unrelated to the span describing the reception of the message (and, depending on the overall code, might even be an entirely different, unrelated trace!)
At this point, you may wonder: “If the problem is that the span of the reception of the message is off the stack, maybe we don’t remove it from there?” Ah, but this is a cure generally far worse than the sickness, as we just introduced a trace-context leak. Consider the following code:
from boto3 import client as Boto3Client
from pymongo import MongoClient
import os

client = Boto3Client("sqs", region_name="eu-central-1")
db = MongoClient(os.environ["MongoUrl"]).orders

# context: none
while True:
  # Iteration 1: context: none; create SQS.ReceiveMessage.1 span
  # Iteration 2:
  #  context: SQS.ReceiveMessage.1;
  #  create SQS.ReceiveMessage.2 span child of SQS.ReceiveMessage.1
  # Iteration n:
  #  context: SQS.ReceiveMessage.n-1;
  #  create SQS.ReceiveMessage.n span child of SQS.ReceiveMessage.n-1
  response = client.receive_message(
    QueueUrl="OrdersQueue.Url",
    MaxNumberOfMessages=1,
  )

  # Iteration 1: context: SQS.ReceiveMessage.1
  # Iteration 2: context: SQS.ReceiveMessage.2
  # Iteration n: context: SQS.ReceiveMessage.n
  if messages := response.get("Messages"):
    message = messages[0]

    # Iteration 1:
    #  context: SQS.ReceiveMessage.1;
    #  create span Mongo.Insert span child of SQS.ReceiveMessage.1
    # Iteration 2:
    #  context: SQS.ReceiveMessage.2;
    #  create span Mongo.Insert span child of SQS.ReceiveMessage.2
    # Iteration n:
    #  context: SQS.ReceiveMessage.n;
    #  create span Mongo.Insert span child of SQS.ReceiveMessage.n
    db.items.insert_one({
      "Order": message["Body"]
    })
How a trace-context leak leads to incorrect parent-child relations among conceptually unrelated spans. Debugging these kinds of confusing traces in large codebases is an… experience.
Due to the trace context leak, subsequent, intuitively unrelated message receptions are now related via parent-child relations. So, every order processed by this code will look like it belongs in the same trace as the very first order the code processes. Such traces grow uncontrollably and are very hard to query precisely and understand; they should be avoided at all costs.
The fine art of safe scopes
Let us sum up what we have seen so far. On the one hand, having spans not related to one another when they should, breaks tracing. On the other hand, having spans related to one another when they should not, especially due to trace-context leaks, breaks tracing way, way worse.
Trace-context in asynchronous instrumentations is a finicky thing because, very often, the code to instrument lacks clear boundaries for what makes a sensible, or even feasible scope for retaining and then disposing of the trace context of the message reception. Let us look at the previous snippet again, minus the context comments, and let’s see if we can identify some viable scopes:
from boto3 import client as Boto3Client
from pymongo import MongoClient
import os

client = Boto3Client("sqs", region_name="eu-central-1")
db = MongoClient(os.environ["MongoUrl"]).orders
while True:  # "while" block start
  response = client.receive_message(
    QueueUrl="OrdersQueue.Url",
    MaxNumberOfMessages=1,
  )
  if messages := response.get("Messages"):  # "if" block start
    message = messages[0]

    db.items.insert_one({
      "Order": message["Body"]
    })
    # "if" block end
  # "while" block end
Same snippet as before, but with annotations about where Python blocks related to the “while” and “if” constructs begin and end.
We are looking for places in the code where it seems safe to restore the trace context of the “SQS.ReceiveMessage” span, and then remove it when the scope is done. When we examine the snippet above, there are two interesting options for a scope stand out:
- The body of the “while” construct
- The body of the “if” construct
If we could somehow detect when a Python block ends, both in the case of the “while” and the “if”, we would remove the trace-context of the “SQS.ReceiveMessage” span and be safe for the next iteration. Alas, this is not something that instrumentation written in Python is known to be able to achieve. Some instrumentations in languages like Java and .NET, thanks to being applied at the level of bytecode re-instrumentation, can be made to detect iterations in some situations, but even then, optimizations like JIT, loop unrolling and a whole lot of very low-level details, make these instrumentations dangerously prone to trace-context leaks.
Restoring the trace context of the “SQS.ReceiveMessage” span when the “messages” are accessed is relatively simple: if we instrumented the `__getitem__` magic method on the “messages” list to restore the trace-context, that would do it. In reality is a little trickier than this: one cannot actually instrument the built-in “list” type — or “dict”, for what matters — but it is easy enough to replace the “messages” list with a data structure that extends “list” and has a `__getitem__` method that does what we need: all we need to do is to edit the dictionary returned by `client.receive_message` and switch the original “messages” list with one of our liking.
So, what other options do we have? Well, Python has the “with” construct! That has a scope like “while” and “if”, and it invokes methods called `__enter__` and `__exit__` magic methods on the object it uses as context-manager (this is the Python “context”, not the distributed-tracing one):
while True:
  response = client.receive_message(
    QueueUrl="OrdersQueue.Url",
    MaxNumberOfMessages=1,
  )
  with messages := response.get("Messages"):  # call context-manager
                                              # __entry__ on “messages”
    message = messages[0]

    db.items.insert_one({
      "Order": message["Body"]
    })
    # call context-manager __exit__ on “messages”
This is precisely what we would need right? Well, there’s a big problem: the built-in list of Python does not actually implement `__enter__` and `__exit__`, so you cannot use them in a “with” scope:
% python3

>>> with [] as messages:
...   print("Hurrah!")
...
Traceback (most recent call last):
  File "<stdin>", line 1, in <module>
AttributeError: __enter__
Why we cannot have nice things: the Python Read-Eval-Print loop (REPL) shows us that lists in Python are not valid context managers.
Technically, the instrumentation could add the `__enter__` and `__exit__` magic methods to the “messages”list, but it would lead to one of the worst types of lock-in imaginable: instrumentation that breaks your application when it is not there!
A trace of hope
But not all hope is lost! There is something that we can instrument in the built-in list that is both safe to use as hooks to restore trace-context and that lends itself well to the intuition of consuming a list of messages: the iterator, realized via the `__iter__` magic method. This approach exists, albeit in a somewhat convoluted fashion, in the `boto3sqs` instrumentation in the upstream OpenTelemetry Python contrib repository and is itself inspired by the `kafka-python` instrumentation (although, the overall approach of using iteration as scope has existed in a form or another across various distributed-tracing systems and programming languages, for at least a decade).
With some simplification around how a specific is span is kept as trace-context to be restored during the iteration, we could ensure the “SQS.ReceiveMessage” is the current trace-context during an iteration over “messages” by making the following the implementation of `__iter__` in the “messages” list:
def __iter__(self) -> Generator:
  # Try / finally ensures that we do not leak trace context
  # `break` or `return` that cuts short an iteration
  try:
    _traceContext._restore(span)  # Restore `span` as trace context
    index = 0
    while index < len(self):
      yield self[index]
      index = index + 1
  finally:
    _traceContext._remove(span)  # Remove `span` from trace context
Iterators save the day! The __iter__ method is both a safe scope, and a fitting construct to use when processing messages.
Indeed, if we could instrument the `__iter__` method of `list`, that would work! There is one last hitch, but it is easy to overcode: the built-in `list` is, well, built-in, so it does not actually have a `__iter__` method we can instrument. But replacing the original list with a wrapper that does have an `__iter__` method that deals correctly with the trace-context is a very low-risk change in an application and the wrapping is easy to do with hooks around the `Client.receive_message` function itself (in reality, the way the code of boto3 is written, it is practical to do a little lower than the API surface, but bear with me).
Let’s see our handiwork it in action:
# context: None
for message in client.receive_message(
    QueueUrl="OrdersQueue.Url",
    MaxNumberOfMessages=1,
  ).get("messages", []):
    # context: SQS.ReceiveMessage
    db.items.insert_one({ # create span Mongo.Insert.x span
                          # child of SQS.ReceiveMessage
      "Order": message["Body"]
    })
# context: None
How managing the trace context inside a list iterator leads to an intuitive trace.
So there you go: we found a safe, clean way to cover pretty common coding patterns for consuming SQS messages that capture the intuition of what the trace should look like:
Conclusions
First of all: congratulations for having gotten to the bottom of a very long and very technical blog about how distributed-tracing instrumentations work!
In this blog post, we have covered a lot of things: what is distributed tracing and how it helps understanding what happens in your distributed system. We have looked at the data structures, traces and spans, that are the foundation for distributed tracing. We have looked at instrumentation, which performs the collection of traces and spans. We have rejoiced in the simplicity of tracing synchronous code. We have gone down the rabbit hole of tracing asynchronous code and faced the perils of trace-context leaks. And then we emerged victorious by instrumenting the magic method in Python underpins how iterations work, providing a safe solution that will work for many applications out of the box. What a journey, I hope you enjoyed it!
And now, feel free to go and enjoy our hard work by tracing your containerized Python applications using the Lumigo OpenTelemetry Distro for Python. The instrumentation will work for you also with backends other than Lumigo. But if you want to try it with Lumigo, and do not have an account yet, there is a generous trial and free tier waiting for you!