


Amazon CloudWatch monitors metrics of your Amazon Web Services (AWS) resources in real time and can trigger alarms when a metric goes above or below certain thresholds. Typically, Amazon CloudWatch sends out alarms by posting a message to an SNS (Amazon Simple Notification Service) topic, which distributes the message via several mediums, including email, SMS, and Lambda functions.
Setting a CloudWatch alarm can be complex. Instead, you could read this blog post and set up multiple CloudWatch Metrics Alerts in Lumigo in less time than it takes to read Amazon’s documentation page for CloudWatch alarms.
With Lumigo, it takes just a few clicks to set up one alert, or multiple alerts, simultaneously, as opposed to one-by-one in CloudWatch. Lumigo’s built-in integrations send notifications to your workflow tools without any need to integrate CloudWatch with them manually.
In this post, we’ll create an Amazon Lambda “Hello World!” function that sometimes gets broken by an error squirrel (it throws an error message of “Squirrel!”) and we’ll set up a rule to run it periodically. Then we’ll create a Lumigo CloudWatch Metric Alert for the CloudWatch metric that measures errors over time to let us know when that error rate exceeds a specific threshold.
Make the ‘Hello Squirrel!’ Lambda

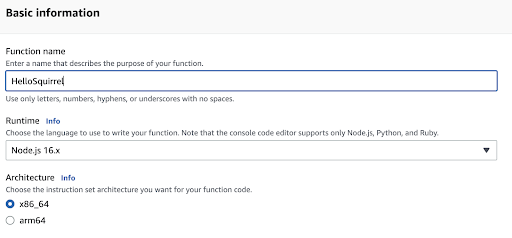
Let’s create a Lambda function called “HelloSquirrel.” Step one is to create a function with the name and leave the default settings.
When the Lambda has been created, update the body of the code to:
exports.handler = async (event) => {

  // Set the threshold for switching from World to Squirrel
  const world = 90;

  // Generate a random number between 0 and 99
  let my_rand = Math.floor( Math.random() * 99.99 );

  //if the threshold is exceeded, throw a custom error
  if ( my_rand > world ) {
    throw 'Squirrel!';
  }

  //No error? Then let's say hello.
  const response = {
    statusCode: 200,
    body: JSON.stringify("Hello World!")
  };

  return response;
};
Deploy your changes and test your function. It should throw an error or “Squirrel!” about one out of every eleven times on average. Of course, you could have no squirrels in thirty tries or two squirrels in ten. It can take a lot of instances for an average to match the odds.
If you want more squirrels, lower the value of world and deploy the updated Lambda.
Here’s what it looks like in the CloudWatch logs when an error squirrel breaks your Lambda.
2022-10-26T23:55:05.975Z	14ce4a0e-1e65-4562-be9b-07a8cbc5f62a	ERROR	Invoke Error 	{
    "errorType": "Error",
    "errorMessage": "Squirrel!",
    "stack": [
        "Error: Squirrel!",
        "    at processTicksAndRejections (node:internal/process/task_queues:96:5)"
    ]
}
Generating worlds and squirrels with AWS EventBridge
Let’s create an EventBridge rule that triggers our Lambda on a regular schedule. By modifying this rule and/or the value of world in our Lambda, we can change the approximate number of squirrels breaking our Lambda in a given time period.
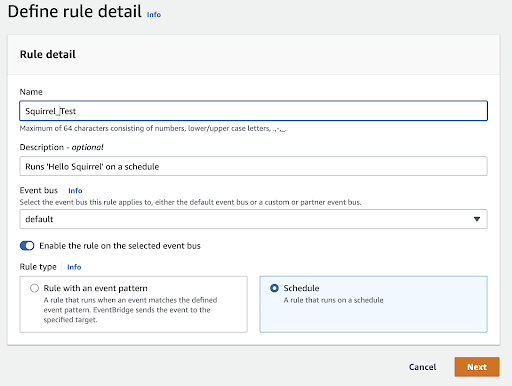
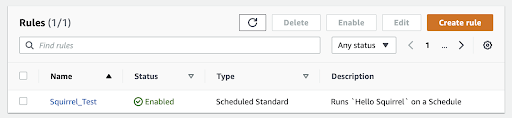
The rule is named “Squirrel_Test.” It’s described, enabled on the default bus, and set to run on a schedule.
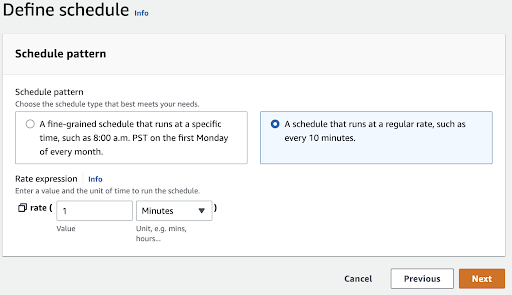
Next, define the schedule to run at a regular rate of every minute. We’ll get 60 runs in an hour and some results before too long. Keep in mind this runs your Lambda function 1,440 times a day, so we’ll change the interval or remove the rule altogether at the end of the demo to avoid racking up a bill over time.
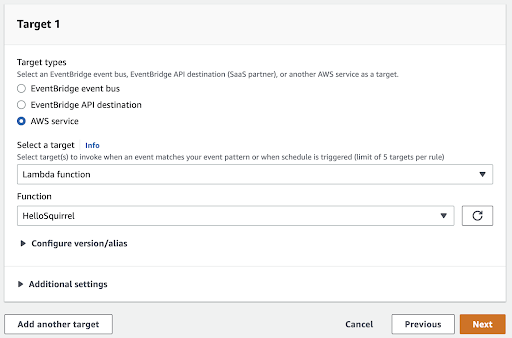
Remember, your rule needs to be in the same region as your Lambda. Select “Lambda function” as the target, then select the “HelloSquirrel” function and move to the next step. We’ll skip creating tags since it’s not needed for this demo. Then move on again.
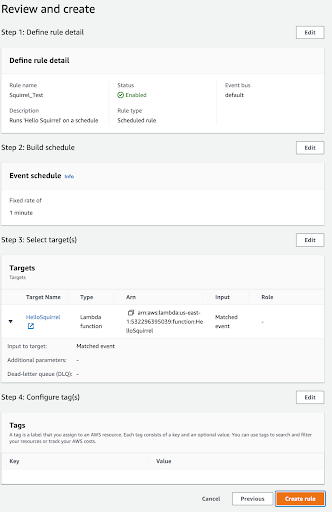
Everything looks good, so let’s Create the rule.
Create your CloudWatch Metric Alert
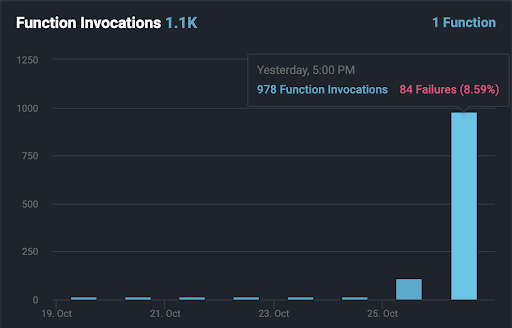
Remember how we said the squirrel would appear on average about 1 in 11 times (9.09%), but it would take some time for that to play out because of randomness and the law of averages? In 978 calls over a period of about 16 hours from our first test of the Lambda, we picked up an 8.59% error rate. Here’s a panel from our Lumigo dashboard, showing those stats.
If we go into CloudWatch Metrics for our Lambda in the AWS Console, we see a graph of the error rate and it’s very close to what was expected. Bounce over to the CloudWatch Metrics for our Lambda and the graph is a little spiky, but that’s also expected.
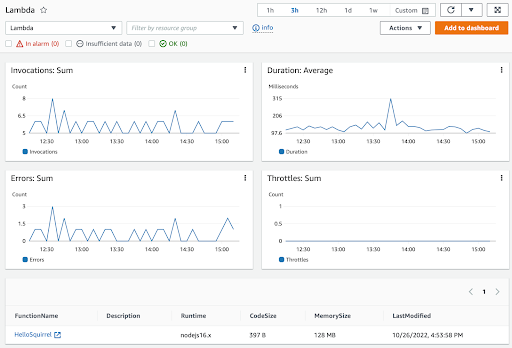
In production, we want an error rate of zero. But let’s say we’re in private beta, testing a new feature, and expect 1 in 11 invocations to fail. We still want to know when the error rate spikes outside what’s expected.
In the Lumigo interface , select Alerts from the column on the left. On the Alerts page, select Create New Alert. Here’s the filled-out CloudWatch Metric Alert screen.
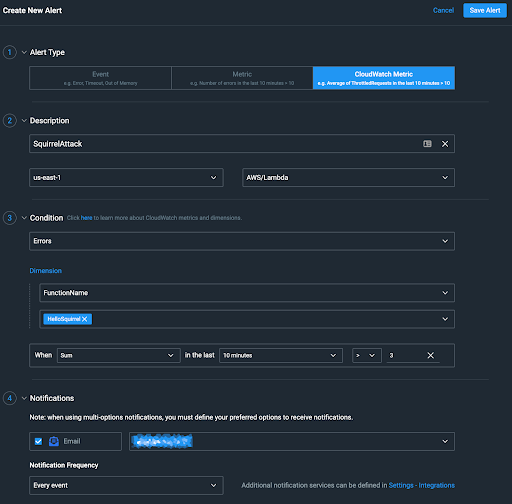
Section 1: We chose CloudWatch Metric.
Section 2: We named the alert SquirrelAttack, chose us-east-1 as the region, and chose AWS/Lambda as the namespace.
Section 3: This is the main part. We chose Errors as the metric and FunctionName as the dimension. Those selections caused the drop-down below FunctionName to be populated with the Lambda functions running in our account on us-east-1.
Then we specified the metric state for which to watch: When the Sum of errors in the last 10 minutes is greater than (>) three.
If randomness were perfectly distributed, it wouldn’t be random, but we should be able to expect 5.45 squirrels per hour. We’re likely to get one or two squirrels in a ten-minute period. Four errors in ten minutes could mean the error squirrels are getting more daring.
Section 4: We selected Email as the method of notification and added an email address as the person to notify. The alert you’re about to see enabled is real. Only the email address has been pixelated to protect the innocent (points if you caught the “Dragnet” reference).
We’ll save the Alert. It will take a minute or two, and now the alert is active.
I’m tellin’ y’all it’s a sabotage
We are not only plagued by periodic error squirrels. There’s an even more dangerous type of squirrel… sabotage squirrels. One of these squirrels somehow hacked our Lambda function and changed the value for world to 80, then deployed the new code, doubling the odds of error squirrels breaking our function.
That means the odds of seeing 4 squirrels in 10 minutes is now about the same as seeing 2 in 10 minutes prior to the sabotage. The alert condition is likely to trigger within an hour or less. Thanks to the magic of blogs, you don’t have to wait.
![]()
The first alert came in 12 minutes later, followed another 10 minutes later by an alert that everything was back to within operating parameters.
Open the alert email, and it looks like this:
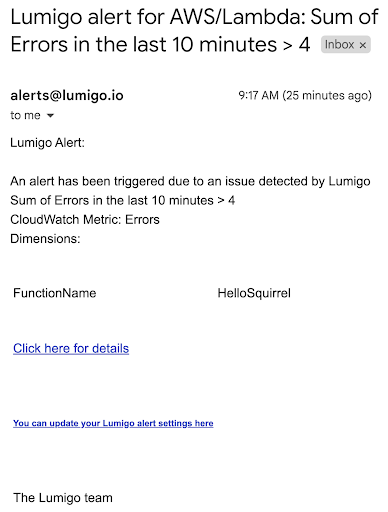
Select Click here for details and we go to an alert summary in our Lumigo dashboard.
![]()
Hover over the alert, and it presents an option to assign the alert to a member of our team for investigation.
Before we say our goodbyes and you saunter off to battle your own error squirrels, we’ll disable that EventBridge rule to stop running the Lambda every minute. The kind of developer who cleans up after their experiments is the kind of developer who wins friends and influences roadmaps.
Scribo itaque summatim: I write, therefore I summarize
According to Google Translate, that’s correct Latin and not another error squirrel. Or is it?
In this article, we learned how to create a Lambda that was vulnerable to error squirrels, then set a CloudWatch Metric Alert in Lumigo to send an alert email when the error squirrels got too aggressive. Now it’s your turn. Set up a CloudWatch Metric Alert in your Lumigo account and help defeat the error squirrels in your environments.