


Modern applications are designed to leverage cloud native technologies like serverless and containers to run at an unprecedented scale, moving the focus away from machines to the actual service. Lumigo’s observability platform was purpose-built for these evolving cloud environments, and we’ve been delivering the most advanced automated distributed tracing for serverless applications since 2019. Today, we’re excited to announce that our platform will extend to monitoring containers to support our current and future customers as they scale in the cloud.
Making observability table stakes for cloud native
As the saying goes, slow is the new broken. End-user experience makes or breaks products, and observability is often the weakest link in cloud-native applications. Monitoring alone has quickly become largely unproductive and noisy, with too many logs and metrics for developers to piece together to effectively diagnose and remediate issues that are spread across multiple components before they impact customers.
Although serverless and containers have different challenges when it comes to observability—containers are harder to collect data from, while serverless transactions are harder to process—we built the Lumigo platform from the ground up to contend with these highly distributed environments, and we want to make observability table stakes for cloud native development. With this new extension, first to Amazon ECS and EKS, and soon to support Kubernetes, Lumigo’s end-to-end observability covers the full spectrum of cloud services used in modern applications, from AWS Lambda and containers to the services that have become core parts of our applications, like DynamoDB, S3, Twilio, and more.
The problem with third parties
Lumigo recognized early on that regardless of the microservice technology you choose, one hallmark of these highly distributed environments is that they are rarely entirely built from scratch. The cloud-native ecosystem has opened up a world of possibilities with third-party and managed services that enrich applications with ready-made software. However, they make already complex environments more opaque and harder to fix when things don’t go as planned. Without the ability to alter the code in production on the fly, change the API or deploy an agent to it (as best practice in traditional monitoring), engineering teams are left in the dark trying to troubleshoot disconnected pieces of their applications. Monitoring techniques that worked well with one or two services talking to another, leaves a lot to be desired when a single user request can trigger dozens of interactions across services, as is the case with most modern cloud applications today.
Lumigo developed advanced distributed tracing capabilities that connect the dots between every service in every request to help developers understand how the different parts of their application interact with each other. When a request or transaction fails, you not only see the impacted service, but the entire transaction in one visual map so you can easily understand the root cause, limit impact and prevent future failures. Lumigo sees through the black boxes of third parties and automatically correlates metrics and logs using unique identifiers to bring applications together instead of developers spending hours of manual effort on debugging.
Challenges with container monitoring
Whether you choose containers or serverless, or a combination of both, depends on the unique needs of your application. The two models are increasingly complementary and running them in tandem can bring the best of both worlds. However, you’re facing challenges either way if you don’t have proper monitoring and debugging tools. When using containers, due to multiple requests being generally processed in parallel, it takes more work to collect the data needed for effective debugging, and users are also responsible for managing and monitoring the underlying infrastructure.
Amazon ECS and EKS, along with AWS Fargate, are managed container-orchestration services that make it significantly easier to deploy and run containers. They integrate with other AWS and cloud-native services, providing an easy-to-use solution for running containerized workloads in the cloud.
Running applications as a collection of microservices, each handled by a cluster of containers in ECS, allows you to manage, deploy, isolate, and replace each service individually. This power and flexibility, however, does not come without a cost to ease of oversight. Amazon ECS comprises many moving parts like clusters, services, tasks and task definitions that are usually updated frequently by their developers. The inherent distribution of containerized applications increases the complexity of troubleshooting issues with ECS, and makes it necessary to understand at a glance how each piece communicates with others needs.
Monitoring container applications with Lumigo
Lumigo provides deep visibility into applications and infrastructure with all the relevant information on each component, enabling you to easily monitor and troubleshoot container applications. We’ll answer three key questions to cover the top features that Lumigo provides for monitoring applications running on Amazon ECS.
How easily can you correlate metrics, logs, events, and traces?
With Lumigo, correlation happens automatically and is delivered in the platform’s transaction view to provide a fine-grained look into requests as they flow across your system. By using unique identifiers like message IDs instead of agents, Lumigo is able to trace interactions between components that communicate synchronously (e.g., over HTTP) and asynchronously (e.g., Kafka or other messaging queues). When a request fails, you not only see the impacted service but the entire transaction in one visual map. The transaction view also includes the graph and timeline of the transactions alongside the logs, requests, and responses. This capability is out-of-the-box and is free (up to 150K traced requests).
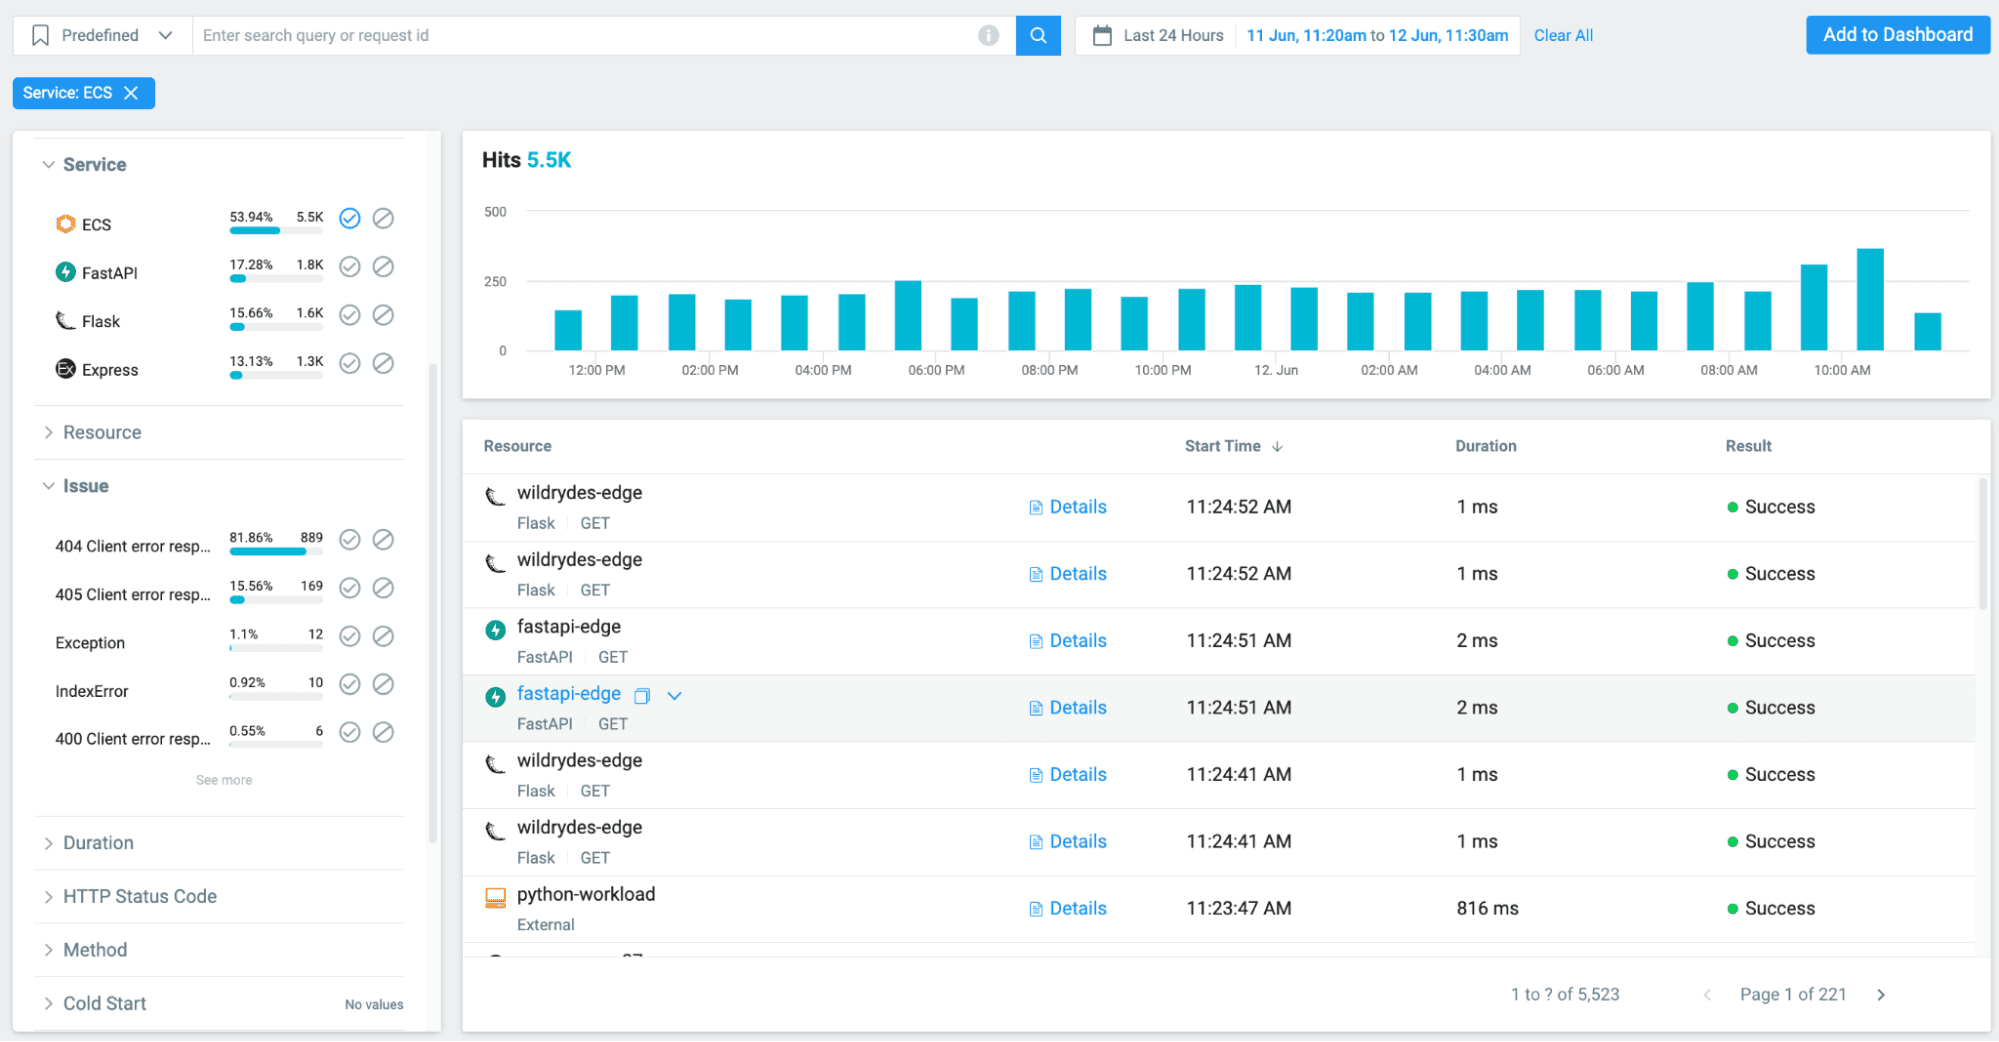
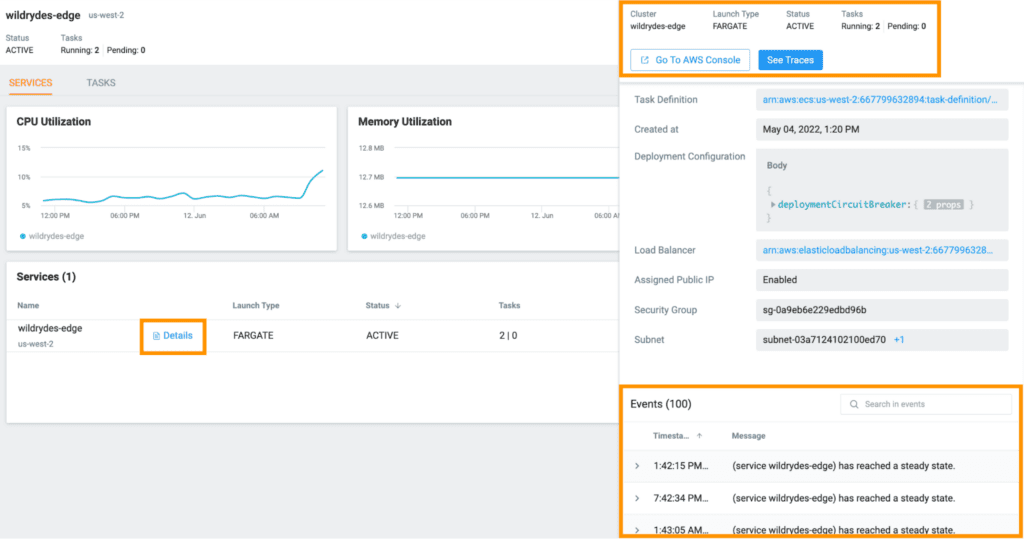
With a dedicated dashboard for ECS, you can see the corresponding traced requests of your services running in your ECS clusters, allowing you to use Lumigo Explore to further search your data and associate requests with the ECS metrics.
Can you see how your application performs and drill down into the underlying infrastructure?
In serverless applications, the need to manage infrastructure is removed, but with containers it’s a critical aspect of cloud operations. To ensure the health of your ECS infrastructure and that containers are running as expected, it is recommended to monitor a few key metrics provided by AWS like CPU/Memory Utilization, and Task Count and Status. Lumigo allows you to easily monitor your ECS clusters and the underlying services and tasks in real-time by leveraging its out-of-the-box dashboards and turn-key integrations with AWS to collect and generate key metrics.
All the key metrics you need to monitor your clusters and instances are displayed, and with easy access to corresponding traces, developers can quickly determine if issues are rooted in infrastructure or the application code.
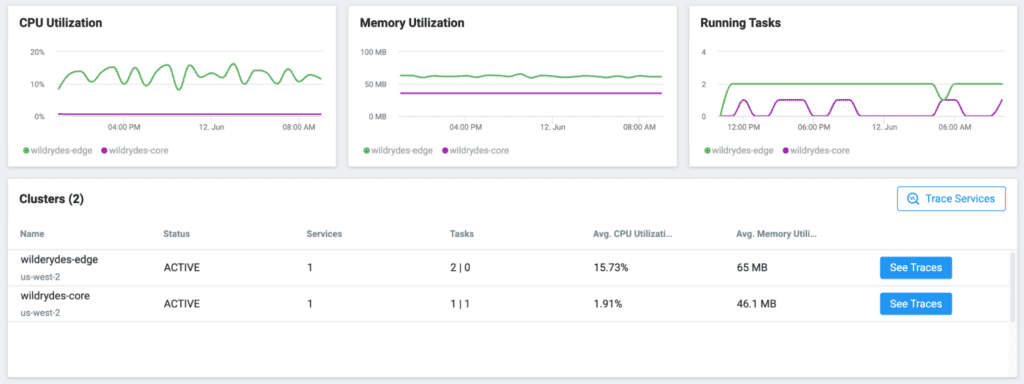
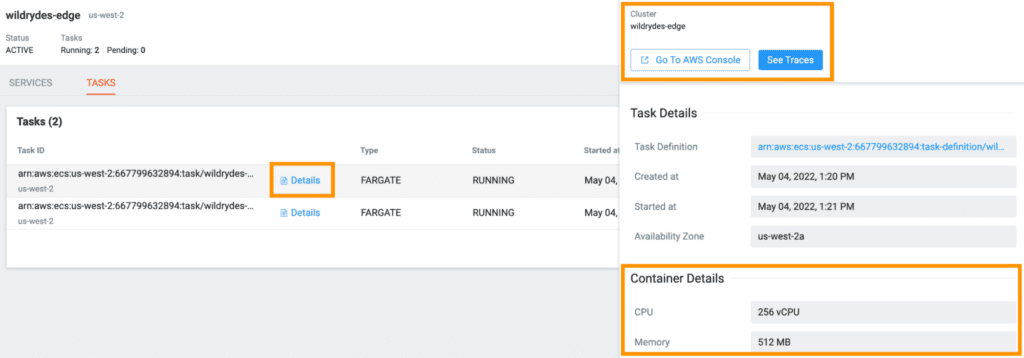
View tasks and their respective status, launch type, resource limits, and the corresponding traces.
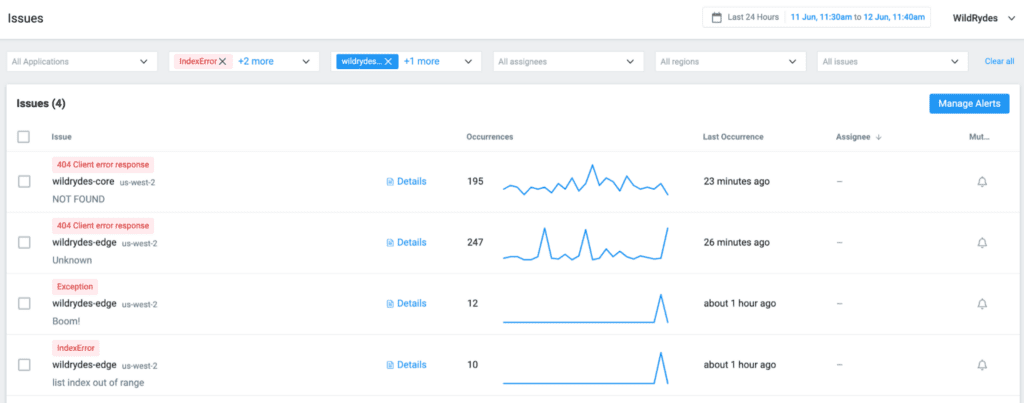
How easy is it to set up alerts?
You can set up alerts and be notified in real-time as issues arise and view all of your current issues with your applications on the issues page. Lumigo has a number of built-in alerts (using industry-recognized defaults) for auto-traced functions so you don’t have to manually configure them yourself. But you still have the option to disable alerts and create news one.
Here are a few of the alerts that Lumigo offers:
- Threshold exceeded: errors, cold start, CPU and Memory utilization, CloudWatch metrics, etc.
- Insights: function about to timeout, function memory exceeded 95%, etc.
- Events: errors, custom application error, timeout, etc.
Get Started with Lumigo
Lumigo’s no-code instrumentation together with out of the box dashboards and alerts allow users to monitor and debug applications without spending time configuring the platform.
Free to sign up and free forever–up to 1M requests–Lumigo is agentless, self-serve and offers one-click, five-minute onboarding. Sign up now.