


Ten years ago, Amazon found that every 100ms of latency would cost them roughly 1% in sales. This is a pretty clear statement on the importance of user experience! It’s especially true in today’s ultra-competitive market where the cost of switching (to another provider) for consumers is lower than ever.
And one of the most common performance issues in serverless architectures is related to elevated latencies from services we depend on. This is a reflection of the fact that we are increasingly relying on other services to fulfil undifferentiating aspects of our applications.
For example, why run our own database clusters when we can rent them and pay for only what we use with on-demand DynamoDB tables? Similarly, if “search” is not a key differentiate for our business, then why build our own when we can use services such as Algolia and ElasticSearch?
On the one hand, it allows us to focus on things that are business differentiators and achieve far greater feature velocities. On the other hand, we are incorporating an ever-increasing number of services into our application. As a result, we need to take greater care in monitoring these integration points and build resilience against their failure modes.
You will see some patterns for making serverless application more resilient against common failure modes such as elevated latency or error rates in this video. This post will instead focus on how to monitor and detect latency issues that arise when our Lambda functions need to talk to other services.
In general, we need to have both a macro and micro view of the latency for every integration point. That is, every time our function needs to make a request (HTTP or otherwise) to another service.
- macro: answers the question “how well is this service performing?” by looking at its percentile (e.g. p95 or p99) latency values from our calling function’s perspective.
- micro: answers the question “how well did this service perform for this request?” and help us debug performance issues of individual transactions.
Both views are important. The macro view tells us when there are systemic issues happening. The micro view tells us why a particular user had a bad experience, or why an invocation timed out.
But how can we collect the telemetry data we need?
Log latency manually
The easiest and the most naive way would be to log a message after every IO operation, like this.
const start = Date.now()
await doSomething()
const end = Date.now()
const latency = end - start
console.log(`doSomething took ${latency}ms`)
As we look through the logs, these messages give us the micro view of what happened during an invocation. For example, how long did that DynamoDB PutItem operation took? Or how long did the Stripe API call took?
To build up the macro view, we need to aggregate them somehow. Luckily, we can create CloudWatch metric filters to turn them into custom metrics. However, this is clumsy and laborious, as we need to create a metric filter for every custom metric we want to track. And we have to do this for every single Lambda function since every function gets its own log group.
Also, this approach tends to fail just as we need it the most. When a function times out because an IO operation took too long, we are left blind…
To compensate, we can add more log messages for when each operation started. For example.
const start = Date.now()
console.log('starting doSomething')
await doSomething()
const end = Date.now()
const latency = end - start
console.log(`doSomething took ${latency}ms`)
However, we can only track latencies for IO operations that are initiated by our code using this approach. Many libraries and wrappers (such as middy middlewares) can often initiate IO operations too. We don’t have visibility into how long those operations take.
Overall, this approach requires too much maintenance and would not scale as our application becomes more complex.
Use Embedded Metric Format (EMF)
In November 2019, CloudWatch launched support for Embedded Metric Format (EMF). With EMF, we can write logs messages like this, and CloudWatch would automatically convert them into custom metrics!
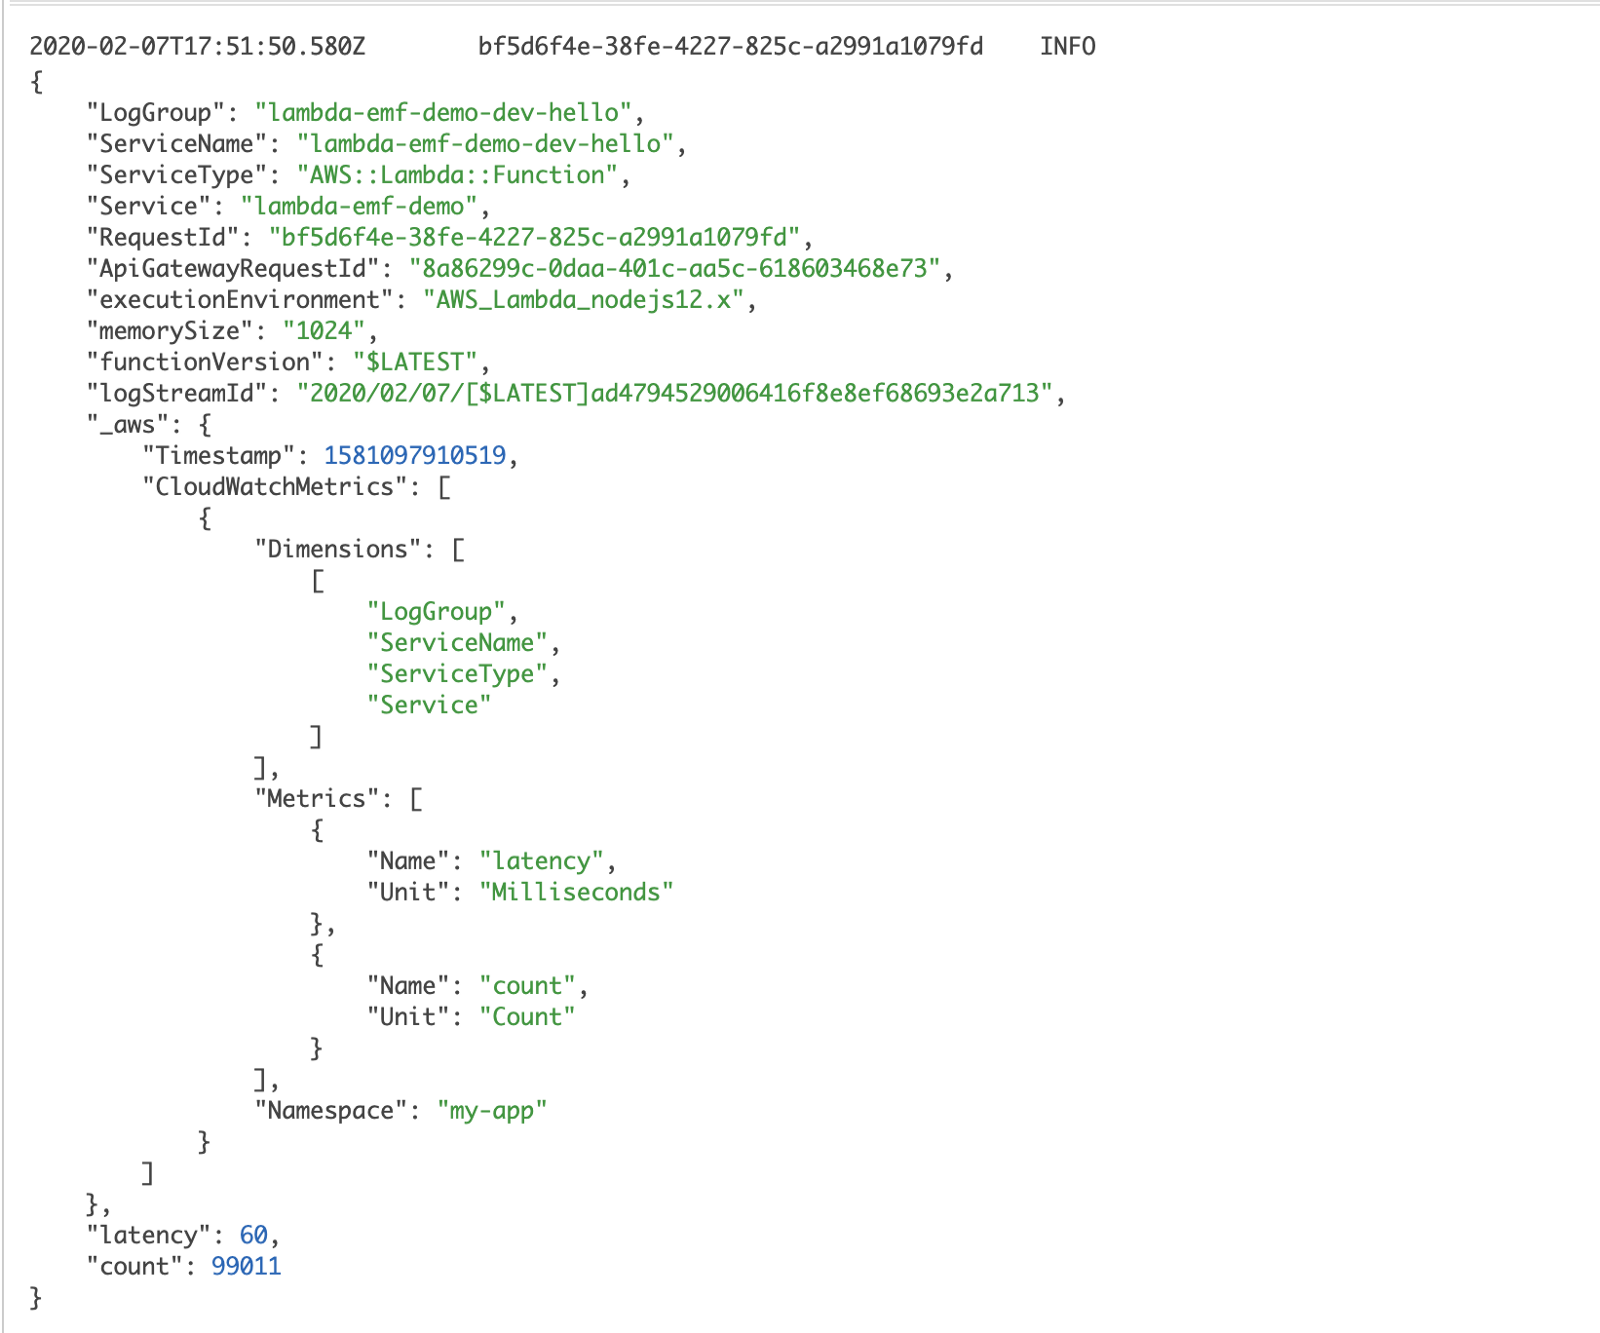
This solves the maintenance overhead of having to create and manage metric filters. It’s not limited to Lambda either, we can also use EMF from ECS and EC2 instances too.
This is a big win and really simplifies the process of recording custom metrics from our Lambda functions! It doesn’t add any latency to our function as we don’t need to call CloudWatch ourselves during the invocation. Logs are pushed to CloudWatch Logs asynchronously, and the EMF messages are converted to metrics by CloudWatch.
However, the EMF format is rather verbose compared to statsd. This can have a non-trivial cost implication when used at scale, as CloudWatch Logs charges $0.50 per GB of data ingested. Also, the official EMF SDK buffers metrics and only flushes them at the end of the invocation. This means we’re prone to data loss when we experience errors that can terminate the current process. For example, out of memory exceptions, or indeed, timeouts. In these cases, we will lose our custom metrics.
A bigger problem with this approach is that it still requires a lot of manual instrumentation. Perhaps even more so than those naive log messages. It’s hard work and requires strong developer discipline to succeed. Unfortunately, as humans, we’re prone to forgetfulness and the tendency to cut corners.
Intercept HTTP requests
Both approaches above lack the full coverage of all HTTP operations because we can only instrument the requests that are initiated by our code. They both require manual instrumentation and do not scale well as our application grows.
A more scalable solution would be to instrument the low-level HTTP module directly. This is possible in most languages runtimes. Indeed, it is how commercial vendors auto-instrument our application for their APM (Application Performance Monitoring) tools.
The challenge with this approach is that it requires a lot of domain knowledge to make the traces easily understood. For example, when we perform a DynamoDB GetItem with the AWS SDk, that translates to a POST request to dynamodb.us-east-1.amazonaws.com. To represent this as a DynamoDB GetItem request, and to add the TableName as a dimension in our metrics, the instrumentation logic needs to know how to interpret the HTTP request.
Most teams simply do not possess the required depth of knowledge to make this approach work in a meaningful way.
Using AWS X-Ray
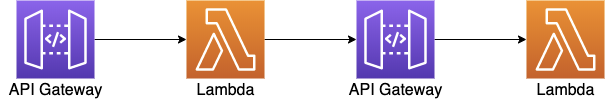
Up until now, the approaches we have discussed only look at one function at a time. As our application becomes more complex, we would often find Lambda functions chained together in transactions.
This can be through API-to-API calls in a microservices environment.
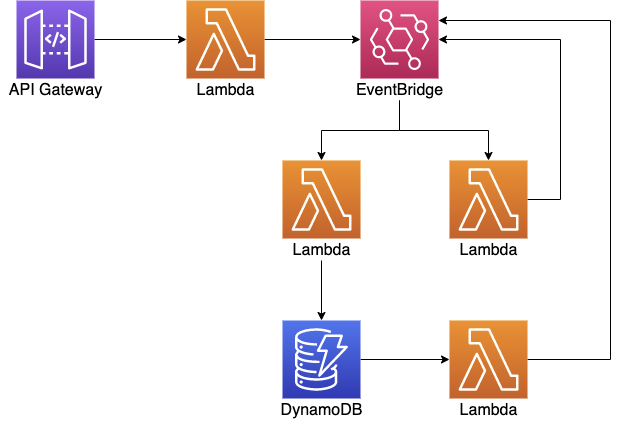
Functions can also be linked together in an event-driven architecture where they are triggered by a variety of event sources such as EventBridge, SNS, SQS, Kinesis and DynamoDB streams.
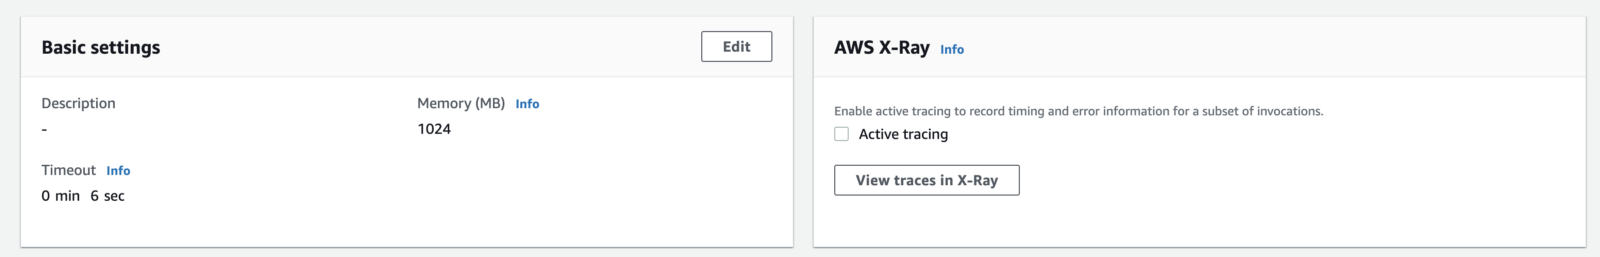
AWS X-Ray is a distributed tracing that we can integrate directly with API Gateway and Lambda.
We can enable X-Ray tracing in the Lambda console for a function:
And in the stage configuration in the API Gateway console:
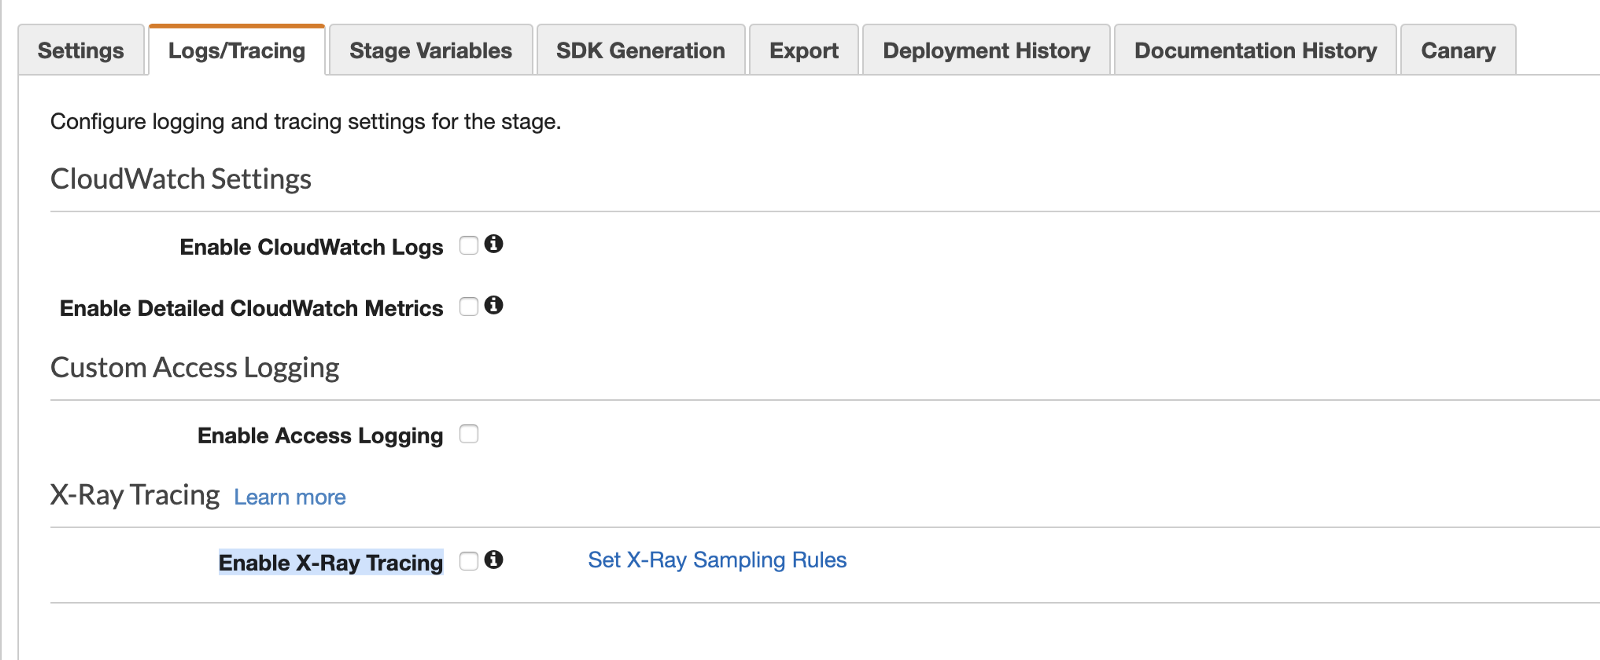
Once enabled, both API Gateway and Lambda services would collect and emit traces to X-Ray asynchronously, without adding to our function’s execution time.
However, the information we get out-of-the-box is limited. If our Lambda function talks to other services then we won’t see those operations in the traces. To help us debug performance issues in our functions, we need visibility into those IO operations and their latencies.
To trace the latency for AWS services, the X-Ray SDK lets us auto-instrument the AWS SDK (or a specific client) with a single line.
const XRay = require('aws-xray-sdk-core')
const AWS = AWSXRay.captureAWS(require('aws-sdk'))
Doing so lets us see how long those AWS requests take. For example, in the image below, we can see that the request to EventBridge took 53ms.
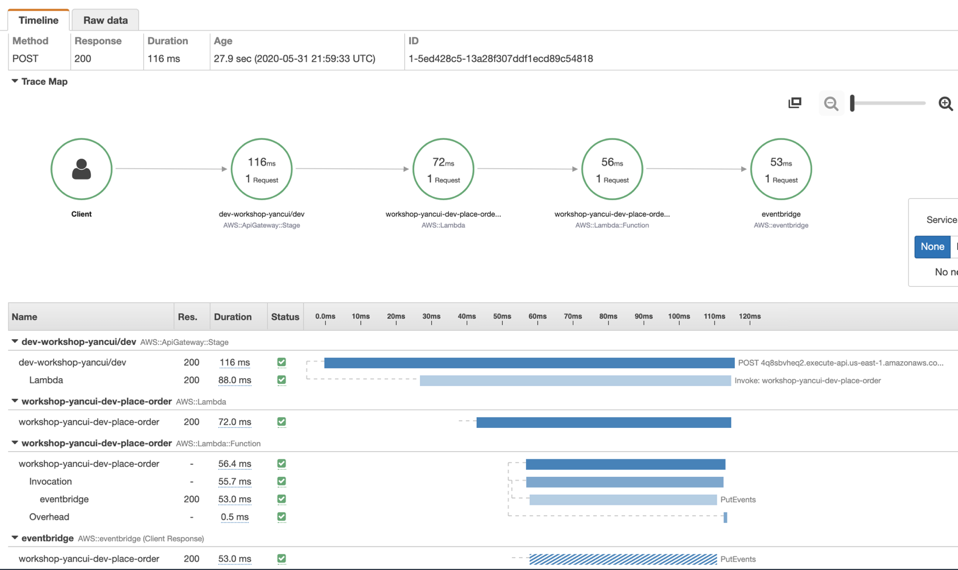
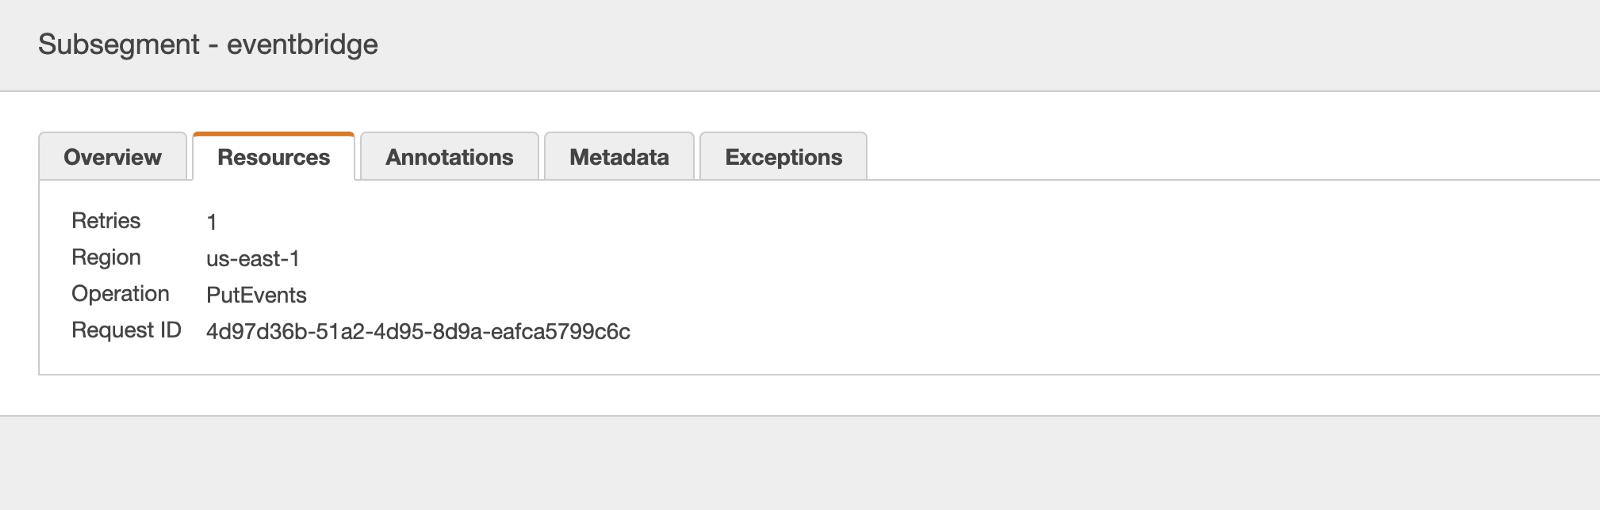
Clicking on the eventBridge segment allows us to see some additional information, such as the operation and the region. Importantly, we can see the number of automatic retries the AWS SDK had performed. Which can often be the reason why we see higher latency from AWS services.
What if we have API functions that call out to other APIs in our system?

Rather than seeing two unconnected invocations, it’ll be great if we can see them in the same trace. To do that, we can instrument the low-level HTTP or HTTPs module in Node.js with one line of code.
const AWSXRay = require('aws-xray-sdk-core')
AWSXRay.captureHTTPsGlobal(require('https'))
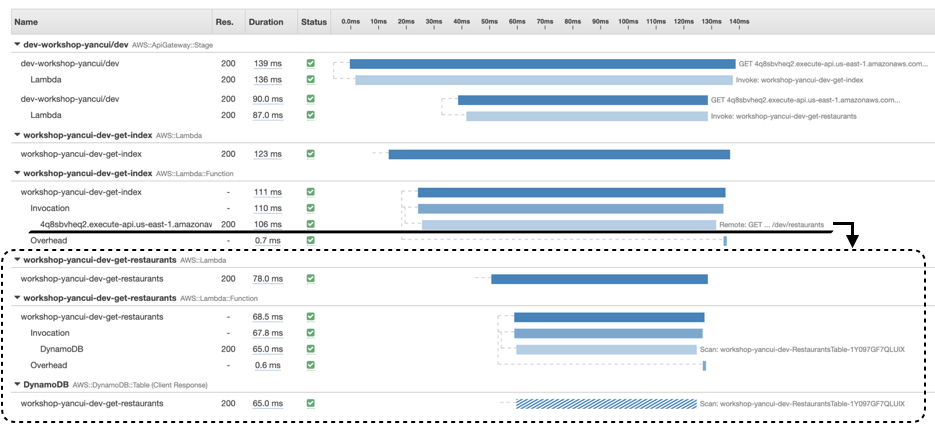
With this change, the X-Ray SDK would add the trace headers in the outbound HTTP request. And the receiving API and Lambda function would add their traces to the calling function’s trace. This allows us to see in one trace what happened inside the second function, and get end-to-end visibility.
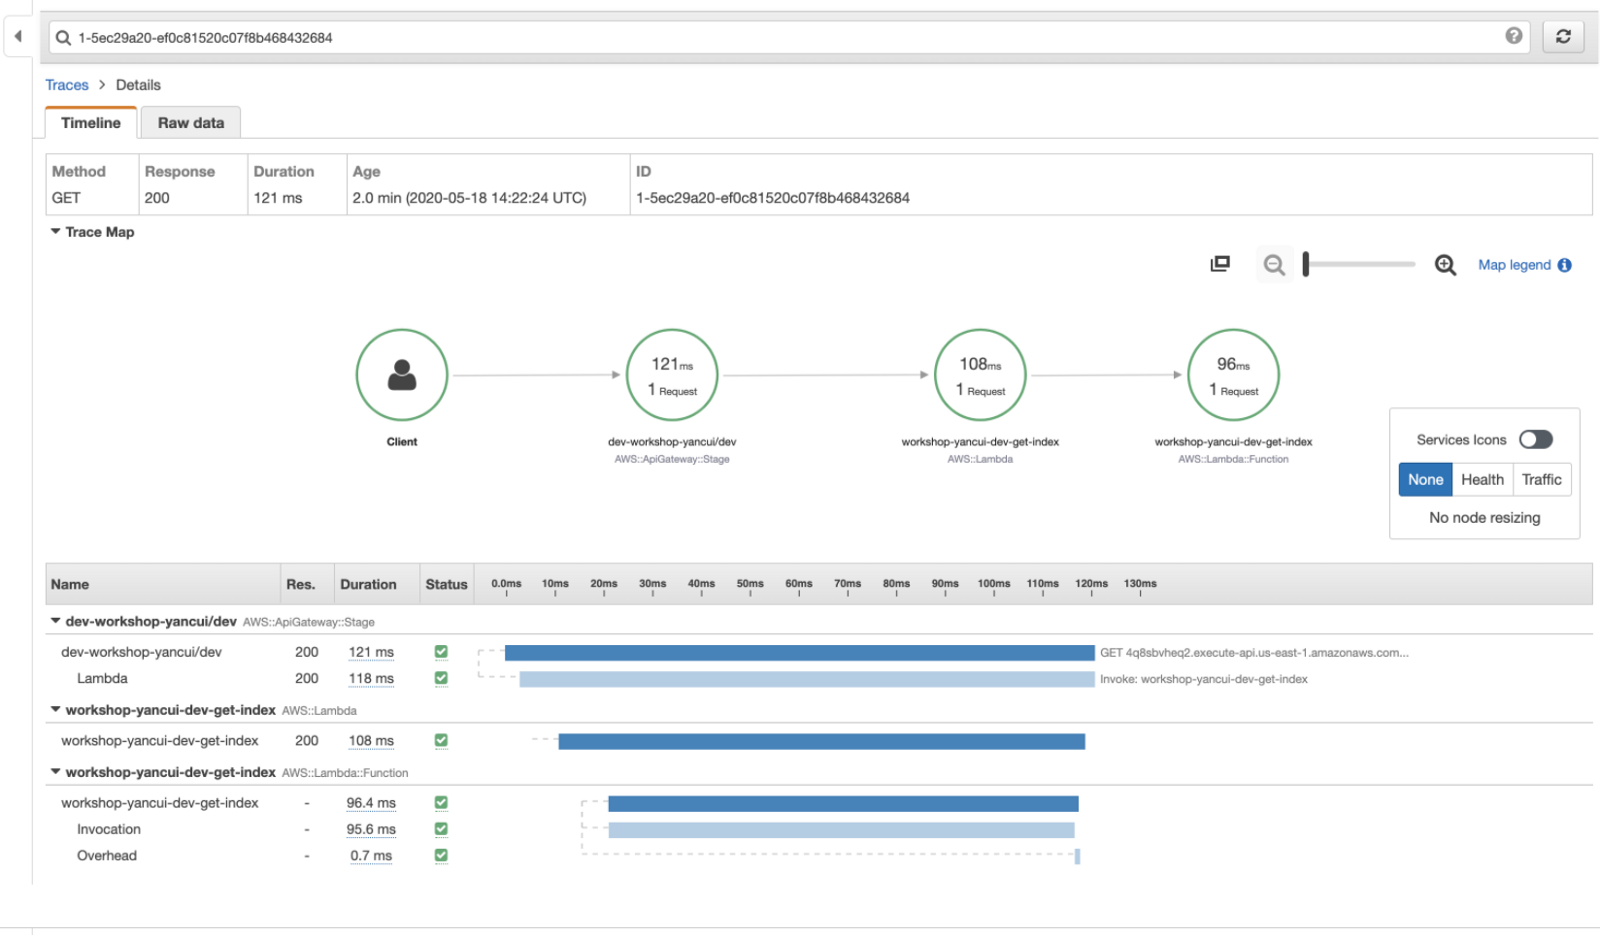
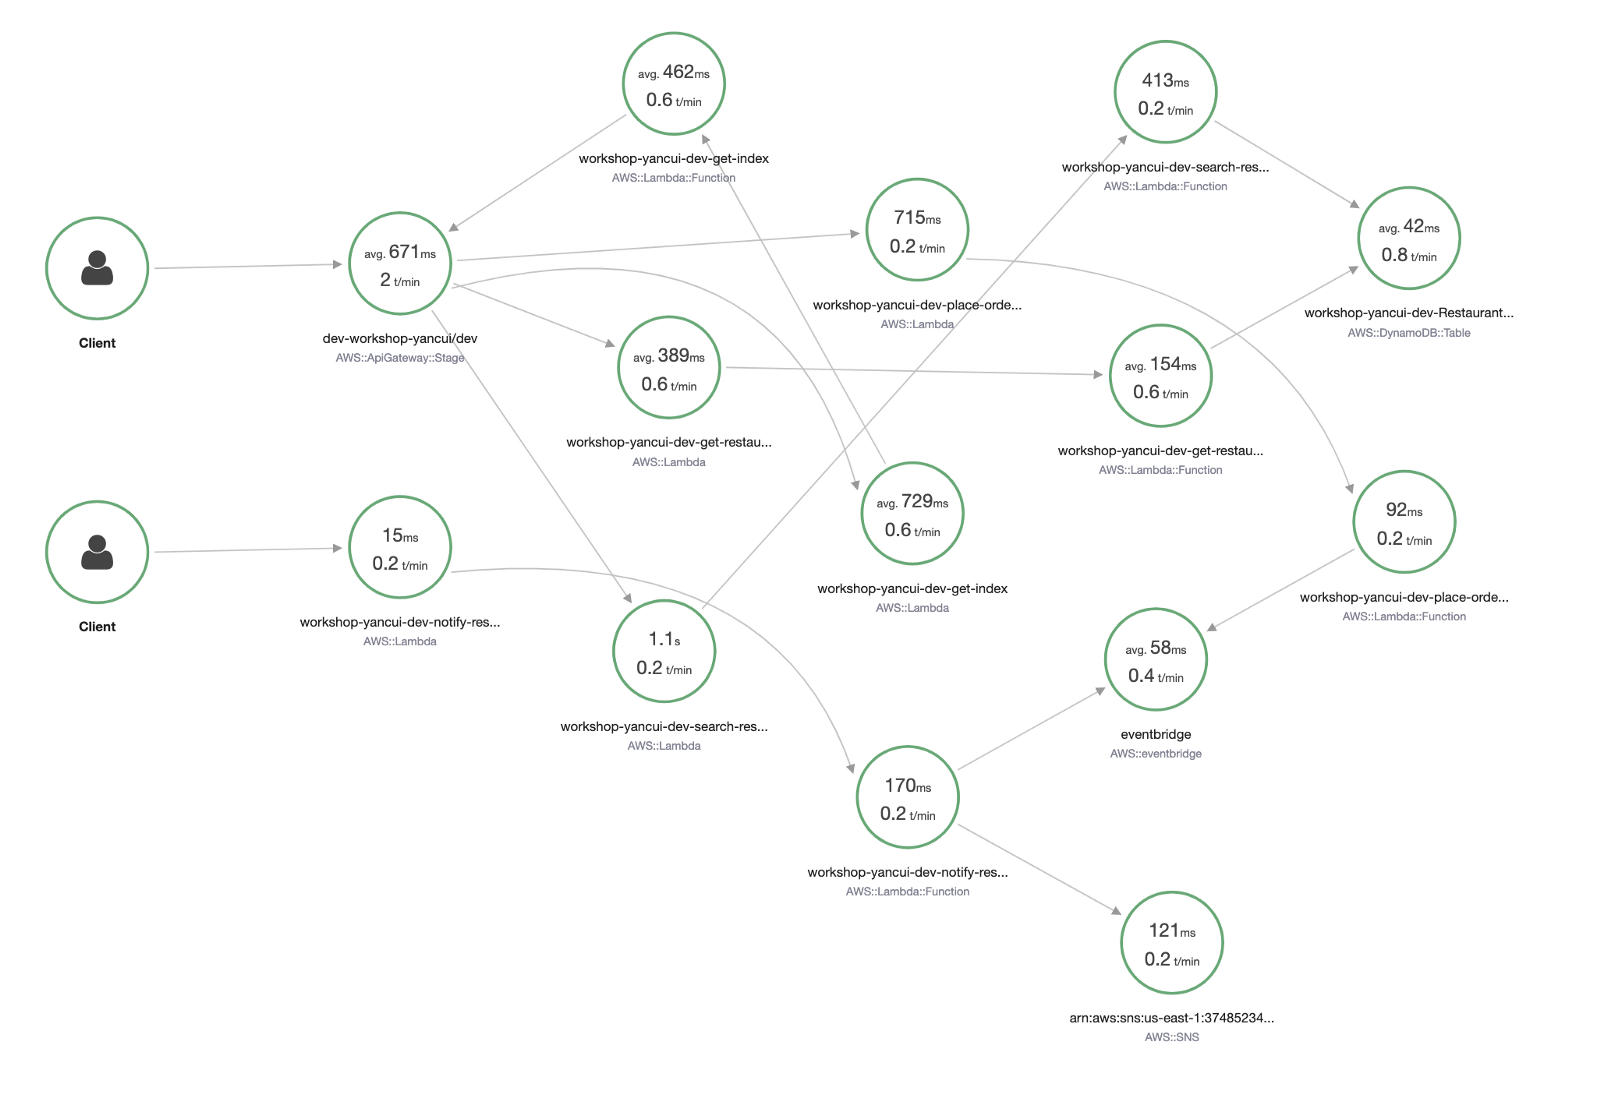
In the Service Map view in the X-Ray console, we see a high-level view of how the different components are connected. We can see the average latency and requests per minute (in the selected time window) for each of these services.
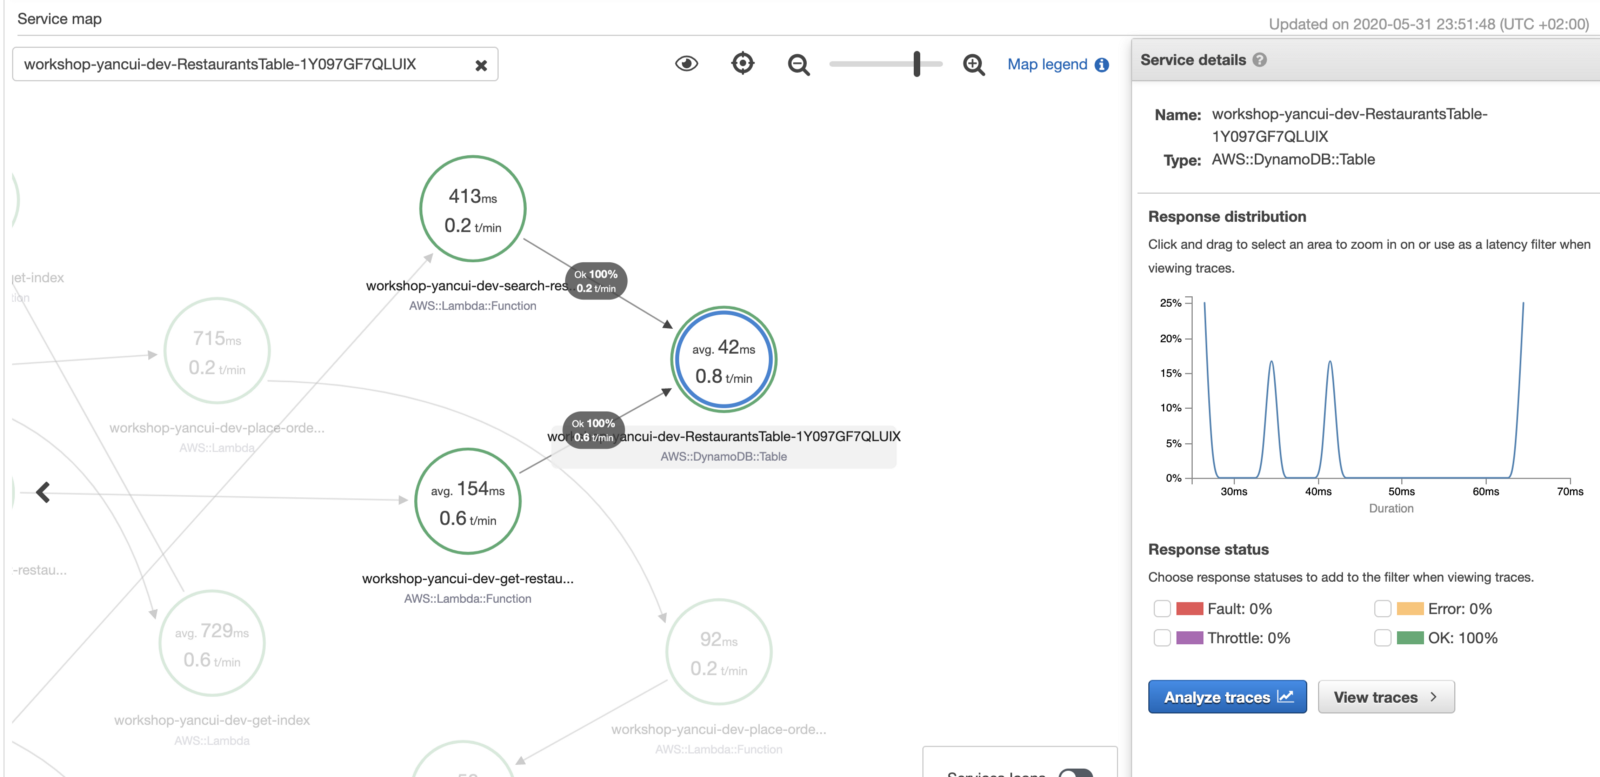
Clicking on one of the icons reveals more information, such as the latency distribution, and percentage of success and error responses.
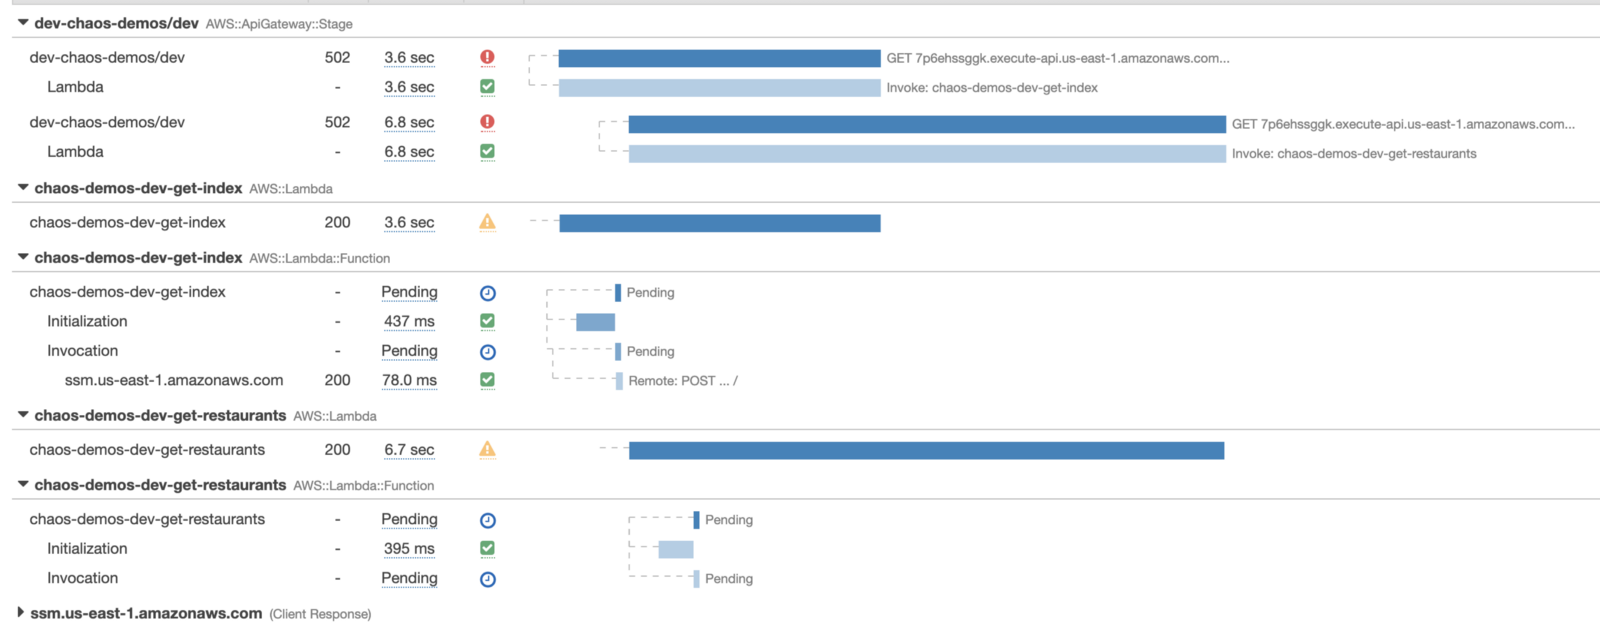
Compared to the manual tracing we had before, this is a big step up. It’s even able to handle timeouts (notice where it says Pending)! In this case, we can see that we have misaligned timeouts where the calling function (chaos-demo-dev-get-index) has a shorter timeout than the function it’s calling (chaos-demo-dev-get-restaurants).
However, X-Ray is not without its own shortcomings.
X-Ray doesn’t support many asynchronous event sources, such as DynamoDB and Kinesis Streams, or S3 notifications. When a transaction passes through these event sources, X-Ray is not able to connect the Lambda invocations together. So we would see two separate traces instead of one. Also, X-Ray’s default sampling rate is very conservative (5% of requests over 1 req/s), so in practice, we almost never have all the fragments of a transaction.
Also, X-Ray doesn’t collect sufficient information about these operations to help us debug problems effectively. While it tells us how long something took, it doesn’t collect the request and response bodies of these operations. The fact that the logs for our functions are not accessible from the traces view means we have to jump back and forth between X-Ray and CloudWatch to collect all the clues and build up a mental picture of what happened during a transaction.
All in all, X-Ray is a great service and covers a lot of our basic needs when it comes to debugging performance issues in a serverless architecture. But it often falls short when our system becomes more complex and our needs evolve.
Using 3rd-party services
While AWS is great at meeting basic customer needs cheaply, specialist vendors such as Lumigo is great at taking the developer experience to the next level and offers a more polished and complete solution.
Integrating with Lumigo requires no manual instrumentation. For the Serverless framework, there is even the serverless-lumigo plugin that can streamline the process to:
- install the
serverless-lumigoplugin - configure the Lumigo token
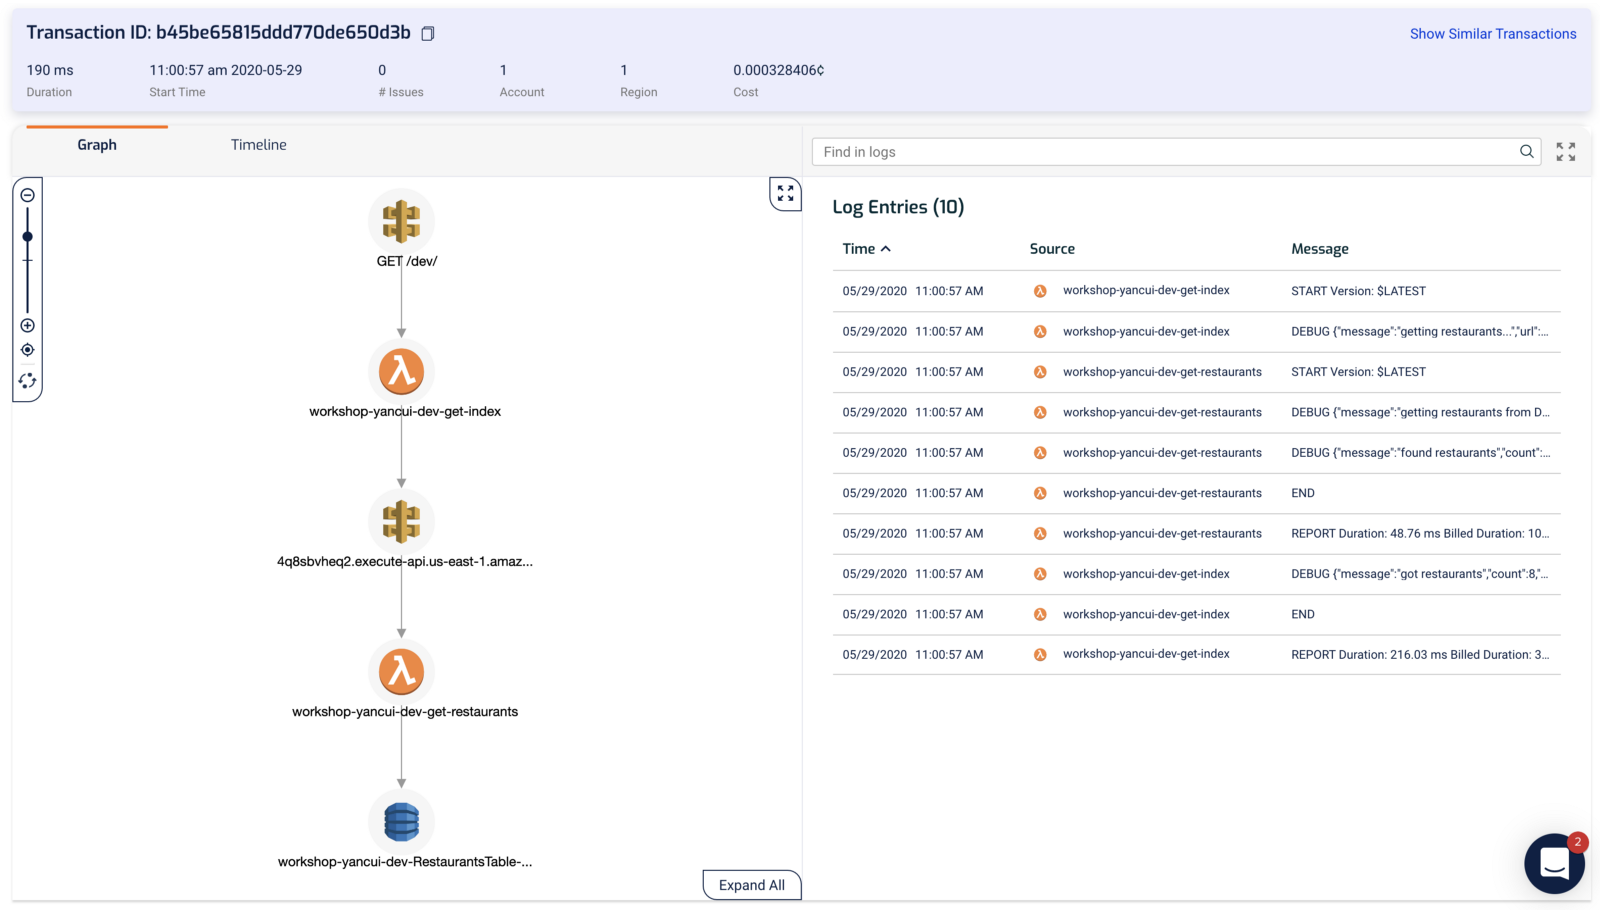
Once configured, our functions would be auto-instrumented and traced by the Lumigo tracer (which instruments the HTTP module as described above). We can see the components a transaction spans over, as well as the relevant Lambda logs side-by-side. All the information we need in one screen, without needing to go back-and-forth between different screens to hunt for clues!
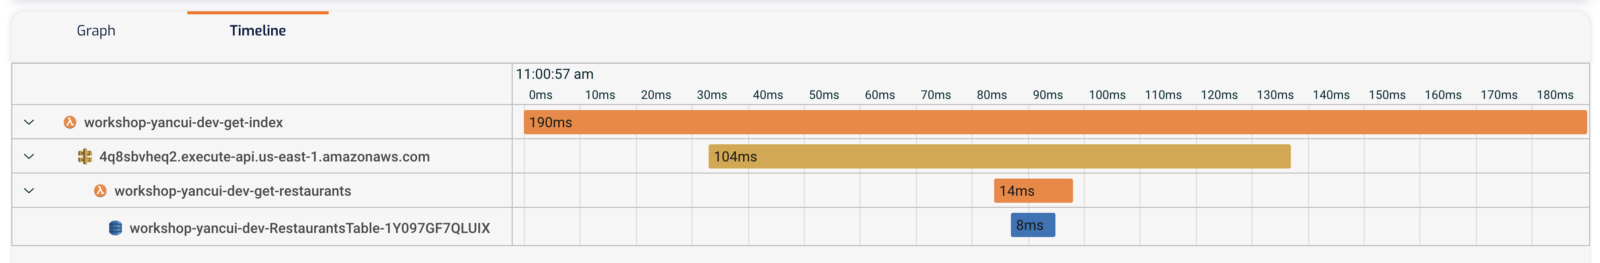
Similar to X-Ray, we can see a burndown of where the execution time is spent in the Timeline view.
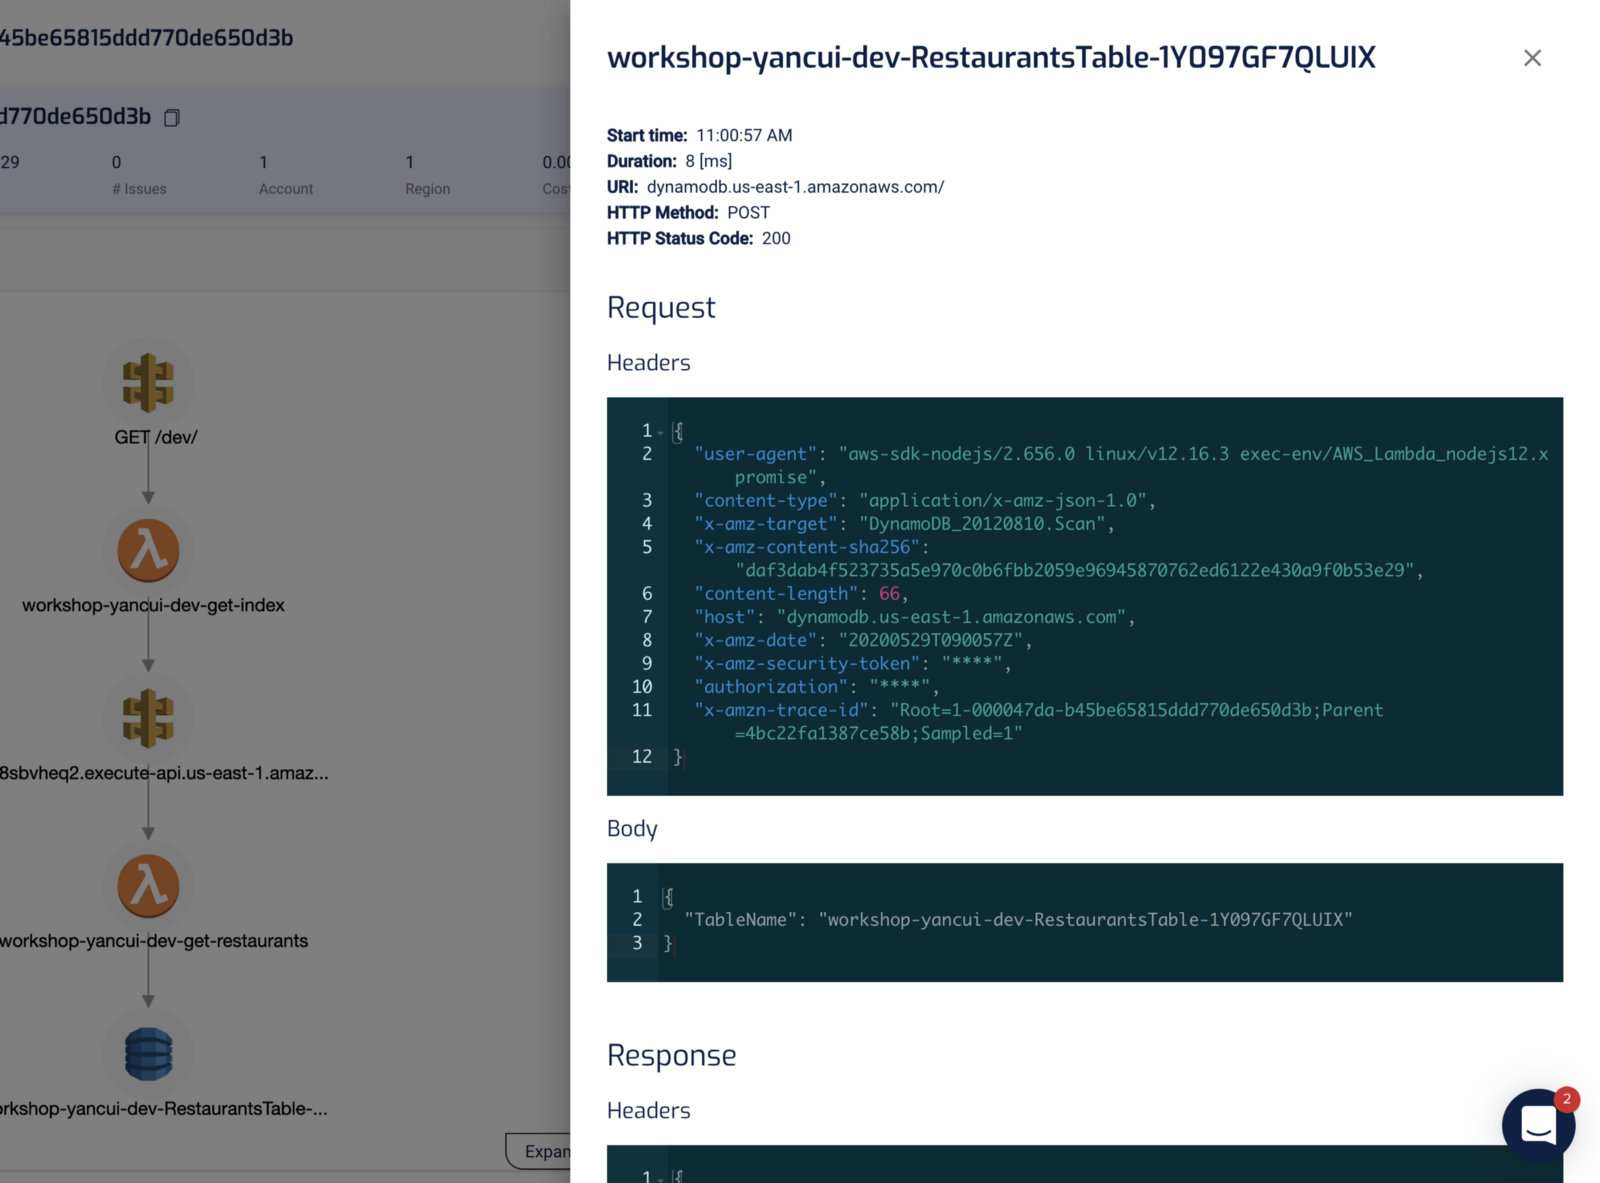
Clicking on one of the components in either the Graph or Timeline view shows us diagnostic information about that operation.
For DynamoDB, we see the request and response. No need to guess what actually happened or to add additional logging in our application. We have all the relevant information about the operation at our fingertips.
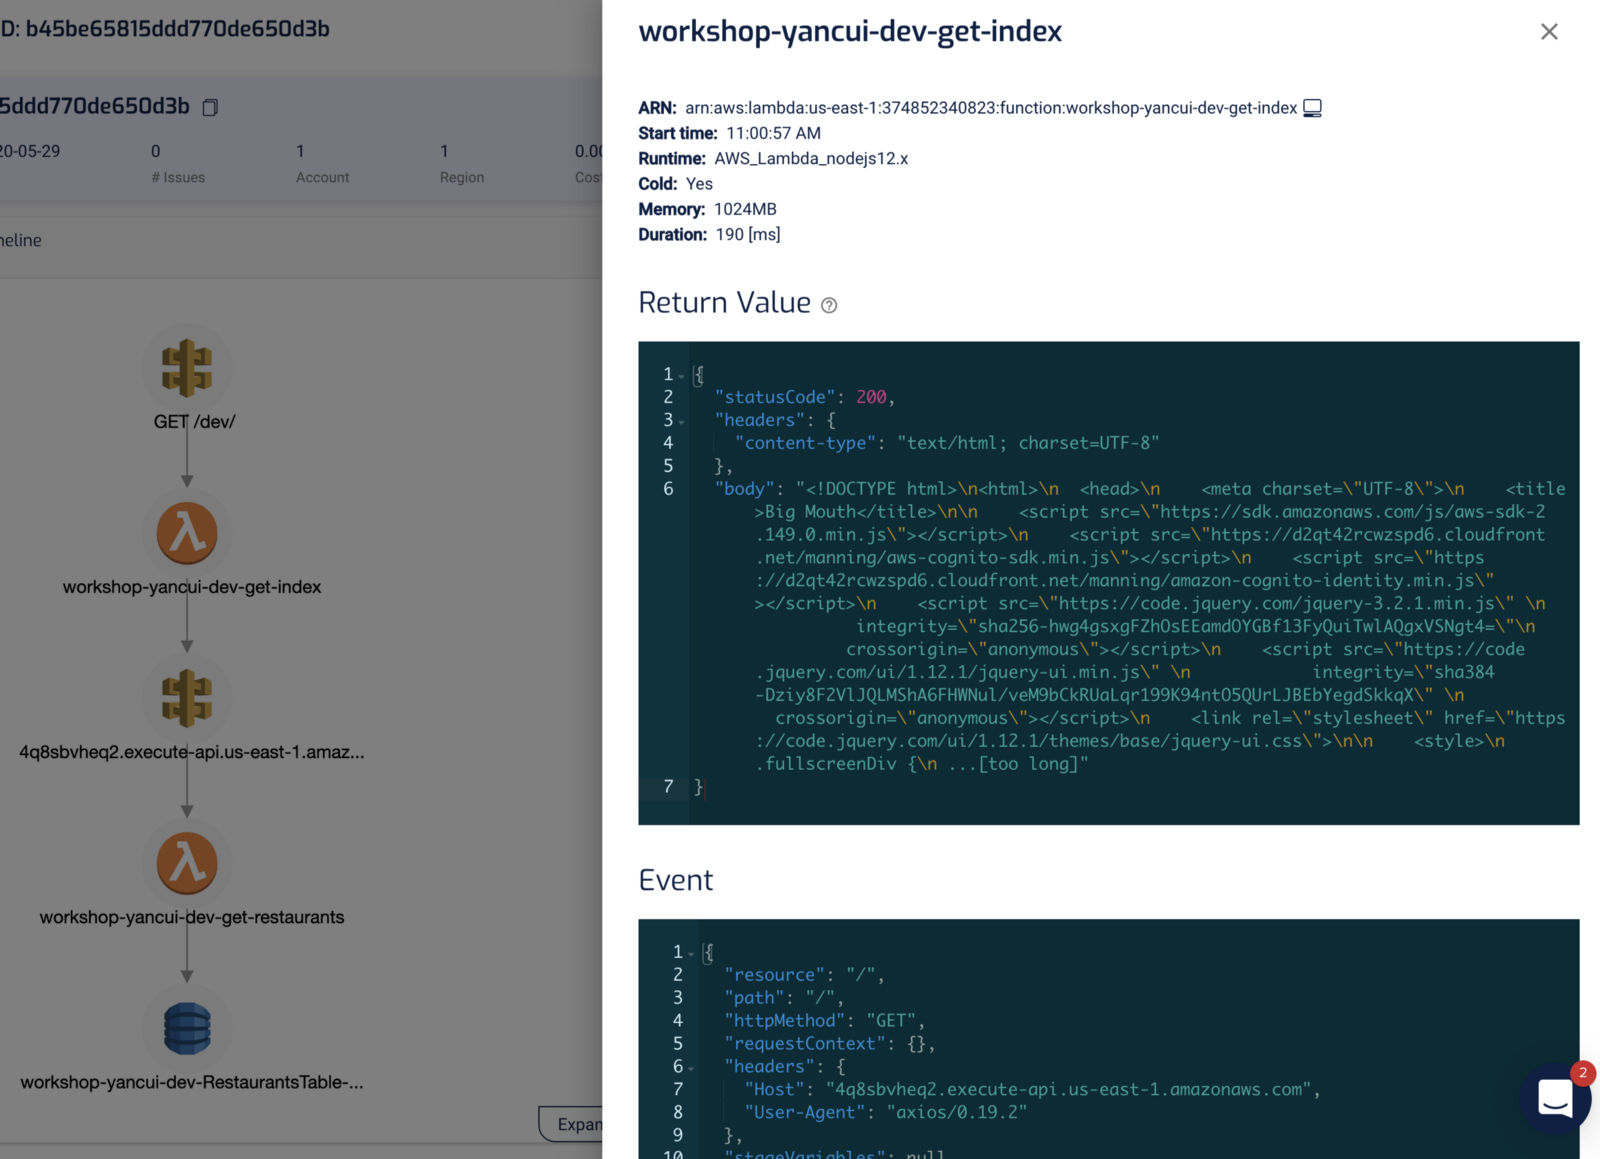
For Lambda invocation, we see the invocation event, the return value, as well as the environment variables that were used during that invocation. In other words, we have a complete snapshot of the state of the function during that particular invocation.
So Lumigo gives us a lot of information about individual transactions. This is very helpful in debugging all kinds of problems that can occur in production, not just those related to performance.
But how do we find a particular transaction when there are potentially thousands of transactions happening concurrently?
With the Explore view, we can quickly identify problematic transactions – e.g. Lambda functions that took too long to execute, or functions that erred.
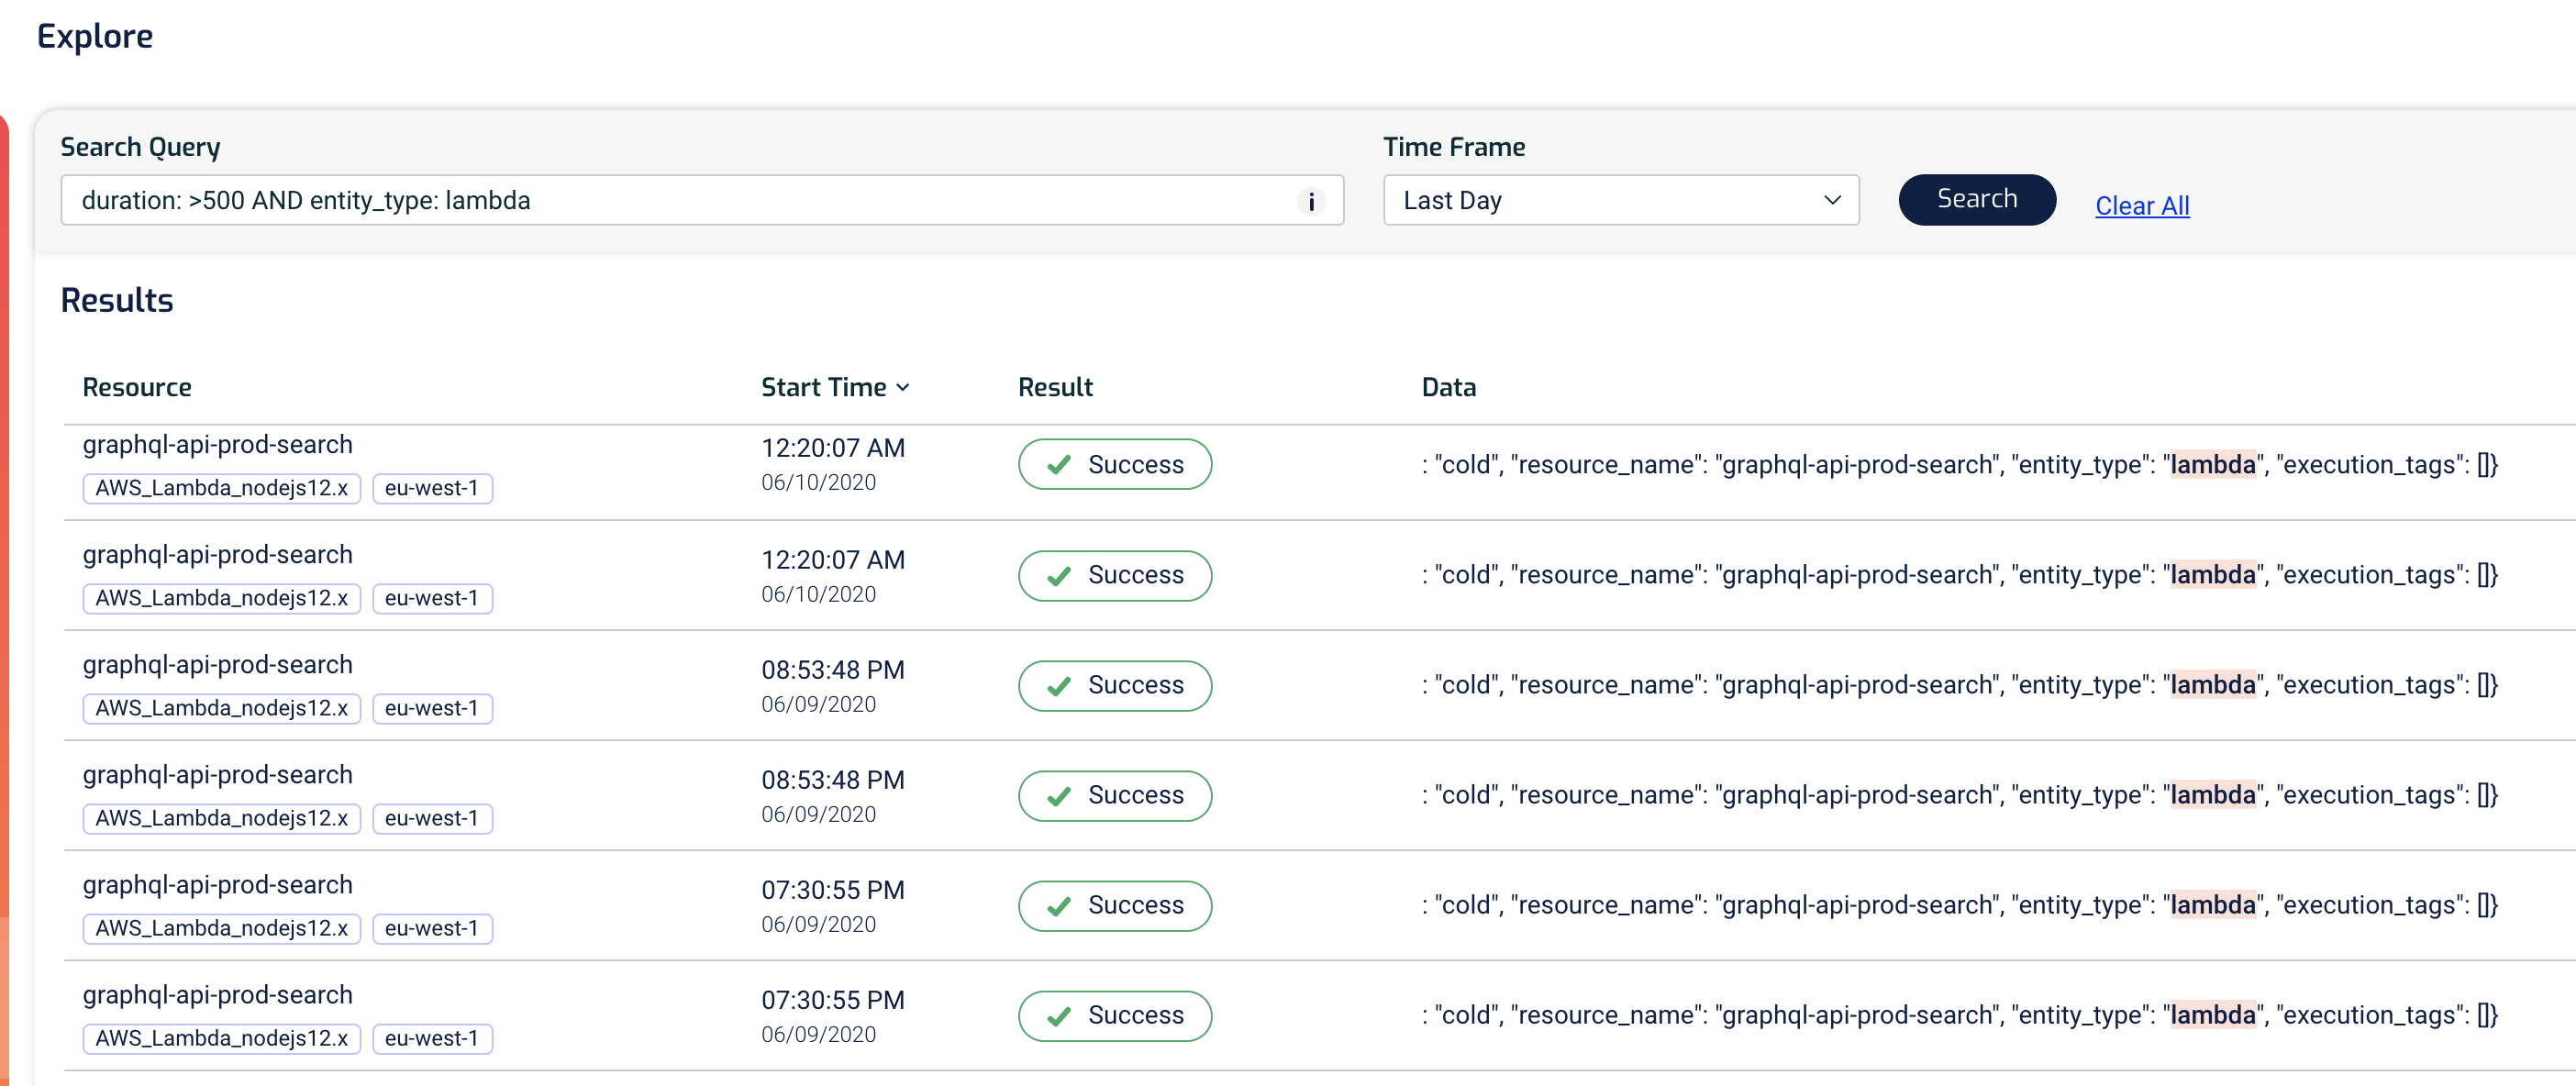
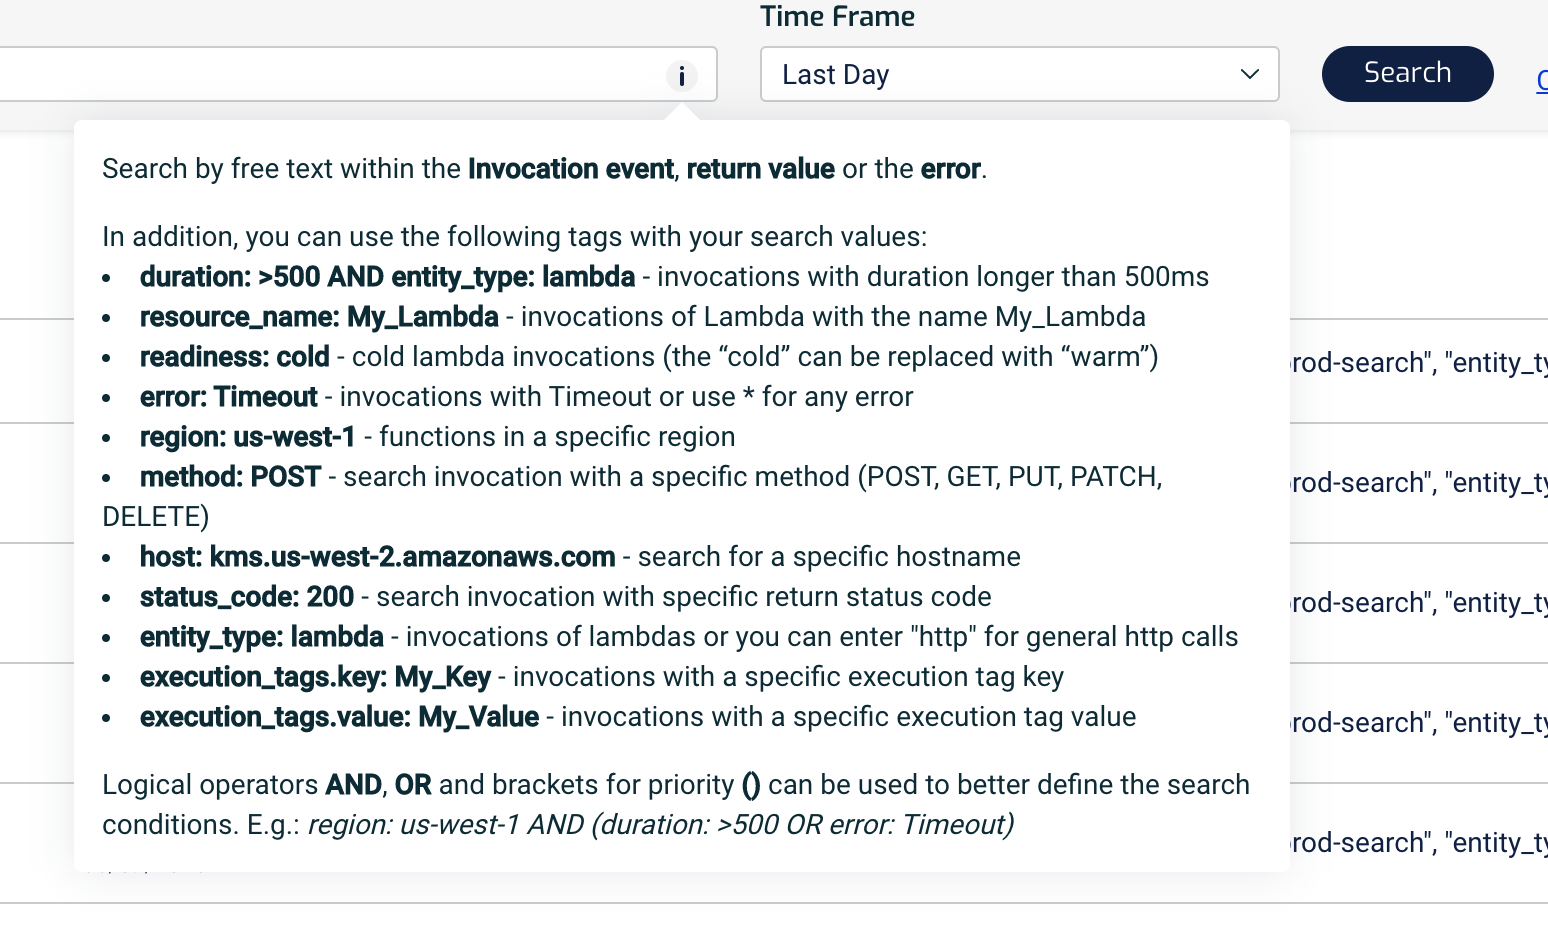
The query syntax is flexible and we can quickly narrow down our search to find even the smallest needles in a haystack.
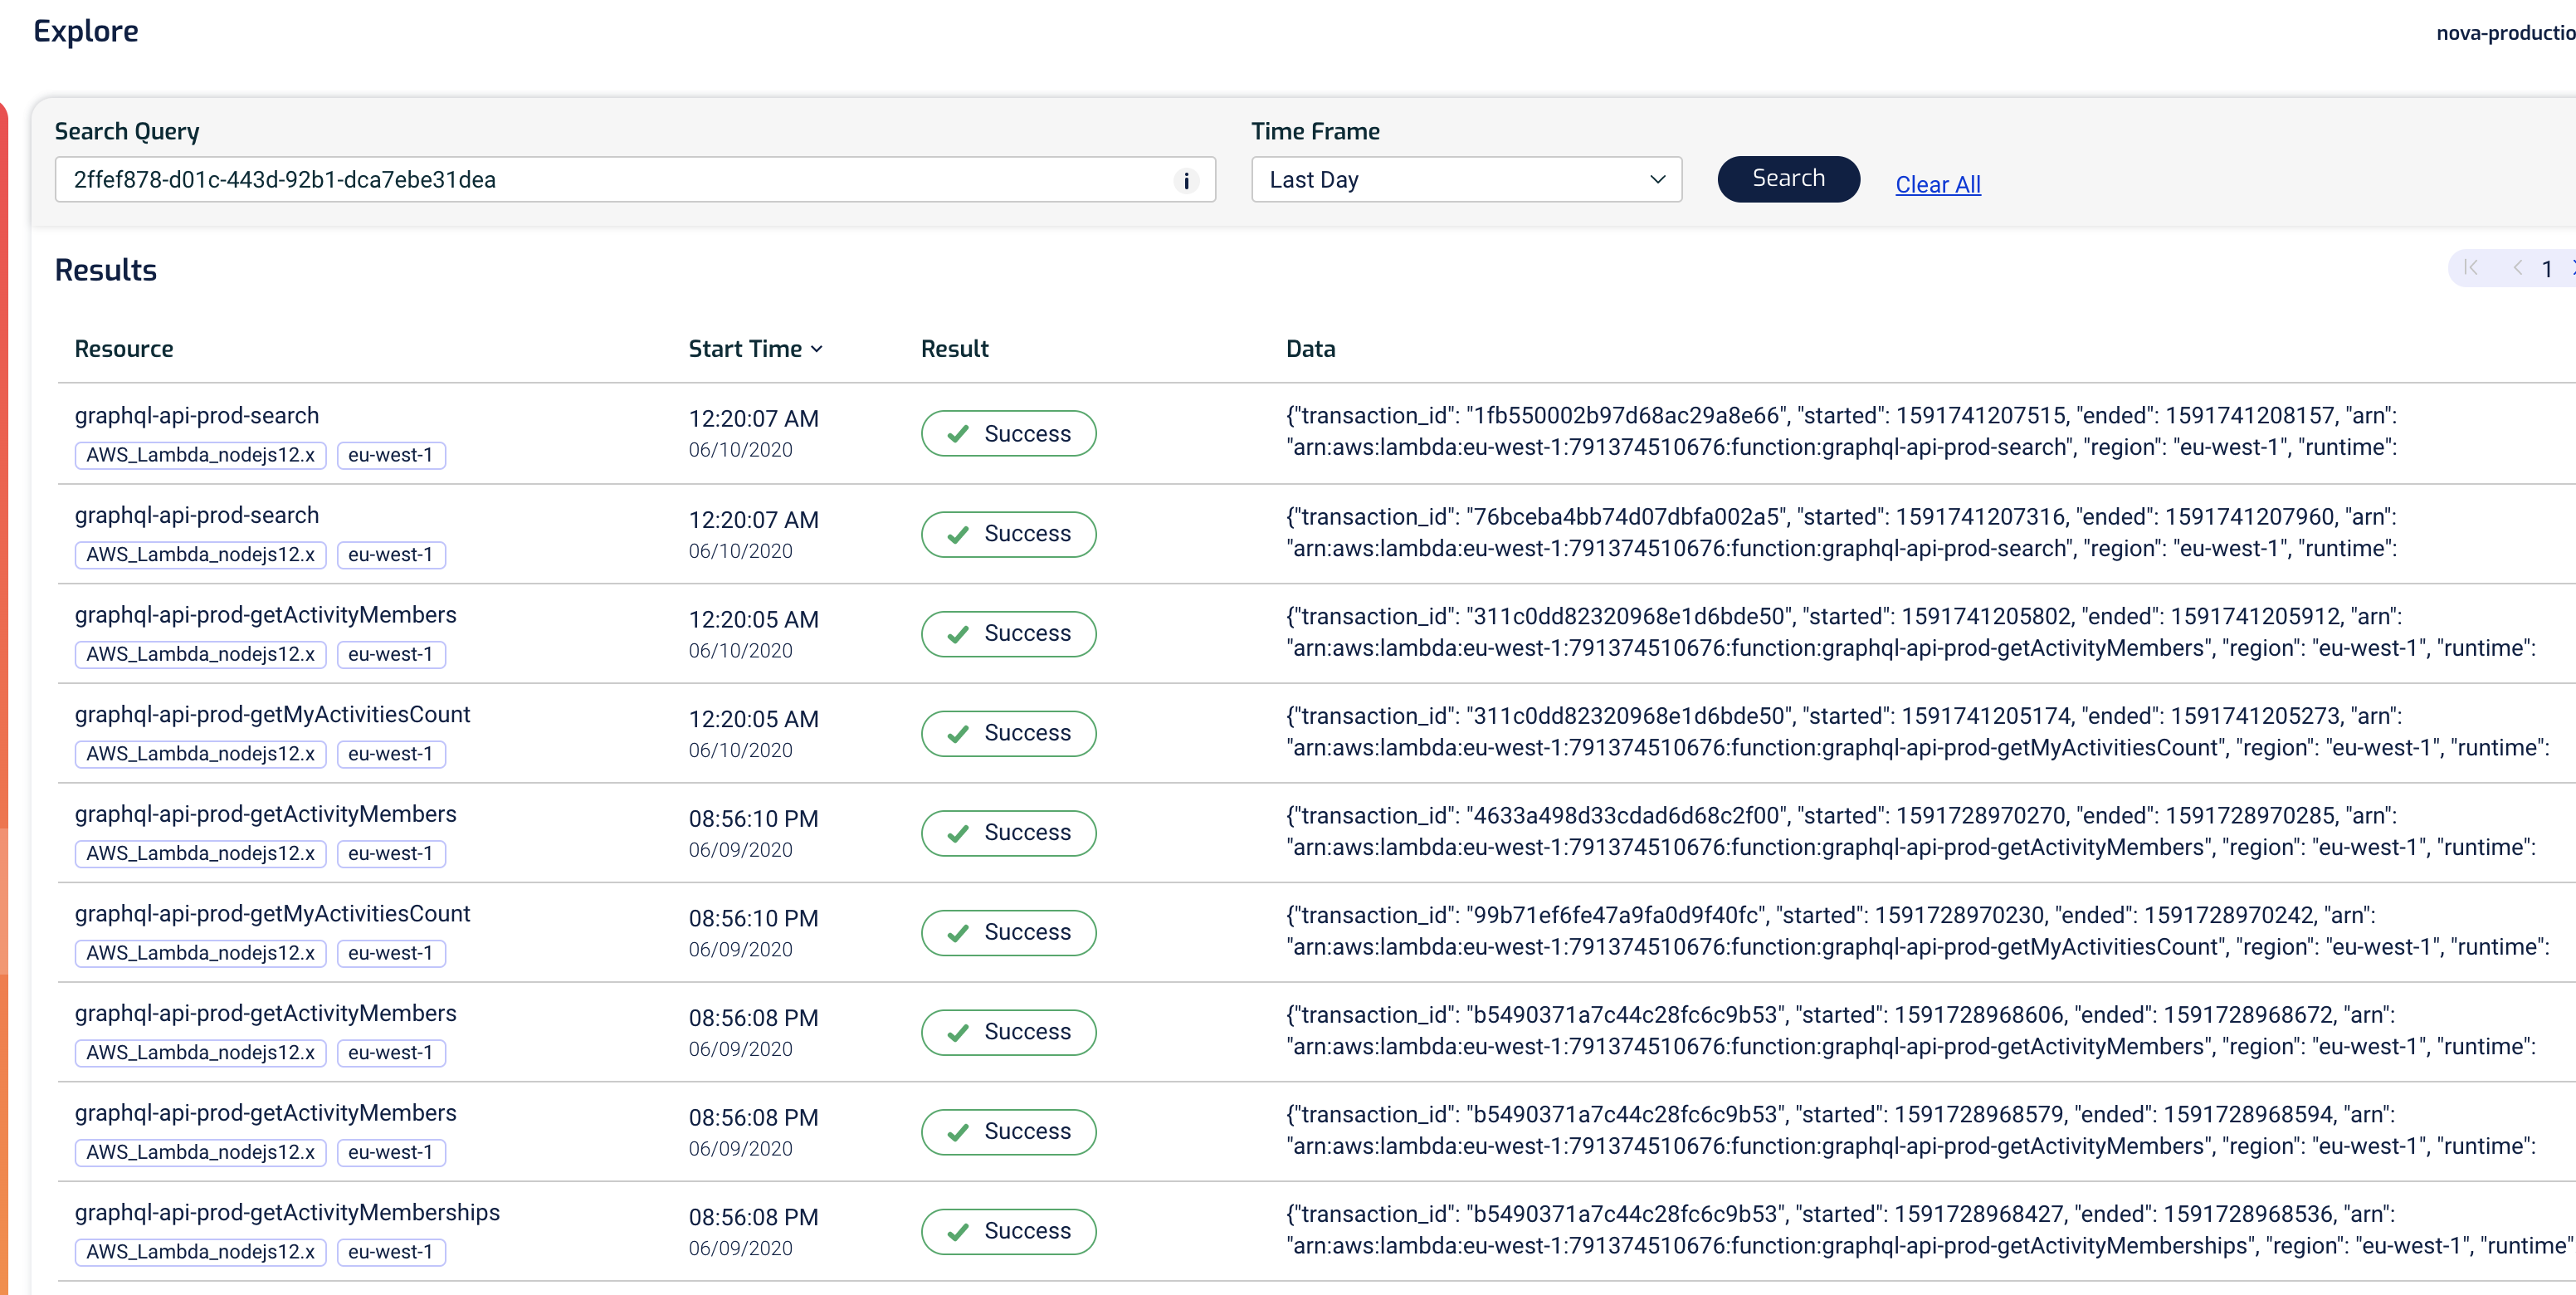
It also doubles as a free-text search, like ElasticSearch. For example, we can find all the actions a user has performed by searching for its user ID.
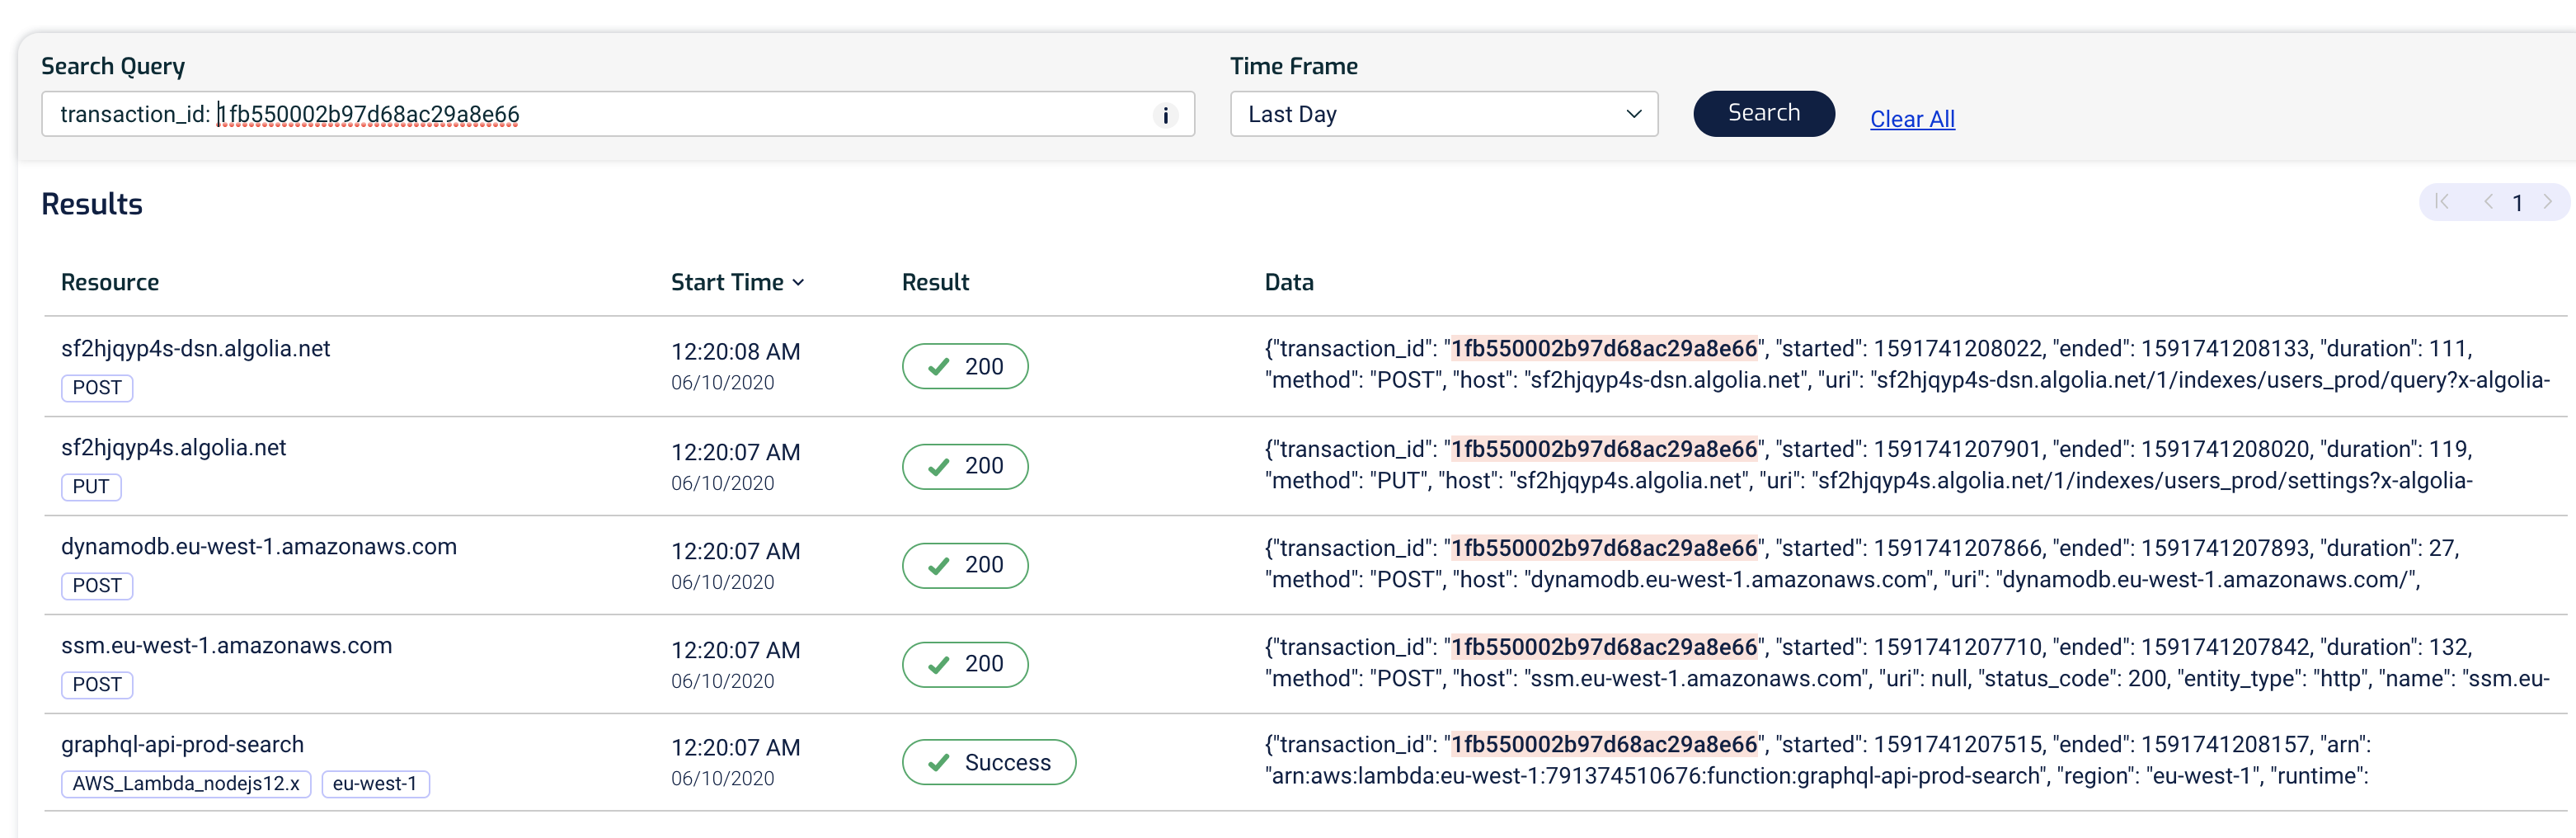
For example, if we have the unique transaction ID, then we can also use it to find everything that happened during that transaction.
Clicking on any of the rows would take us to the Transaction view for that transaction where we can visualize it and investigate it more deeply.
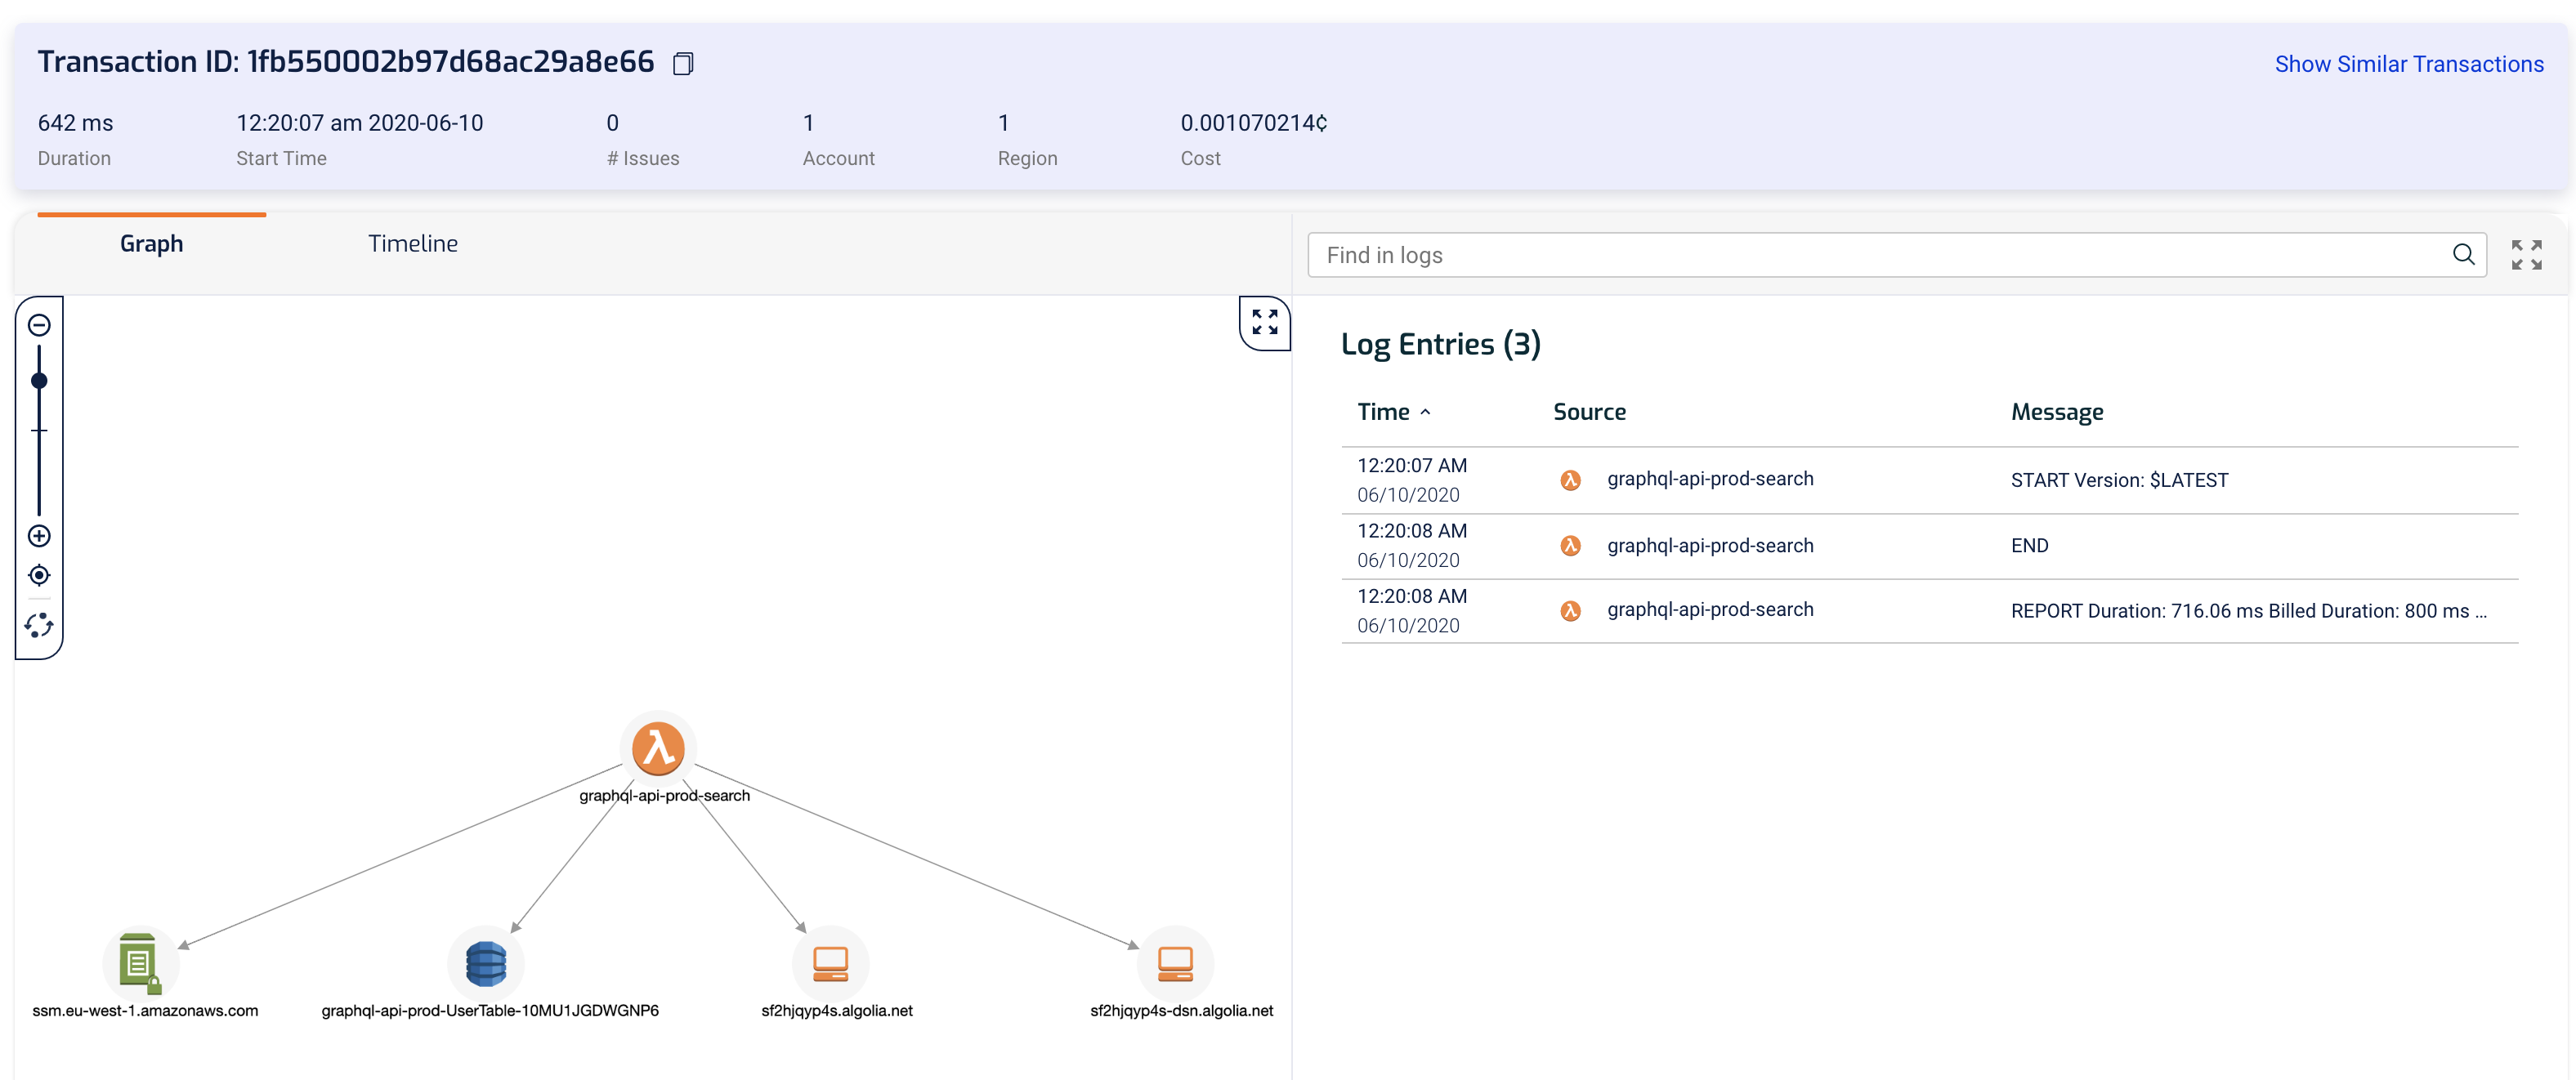
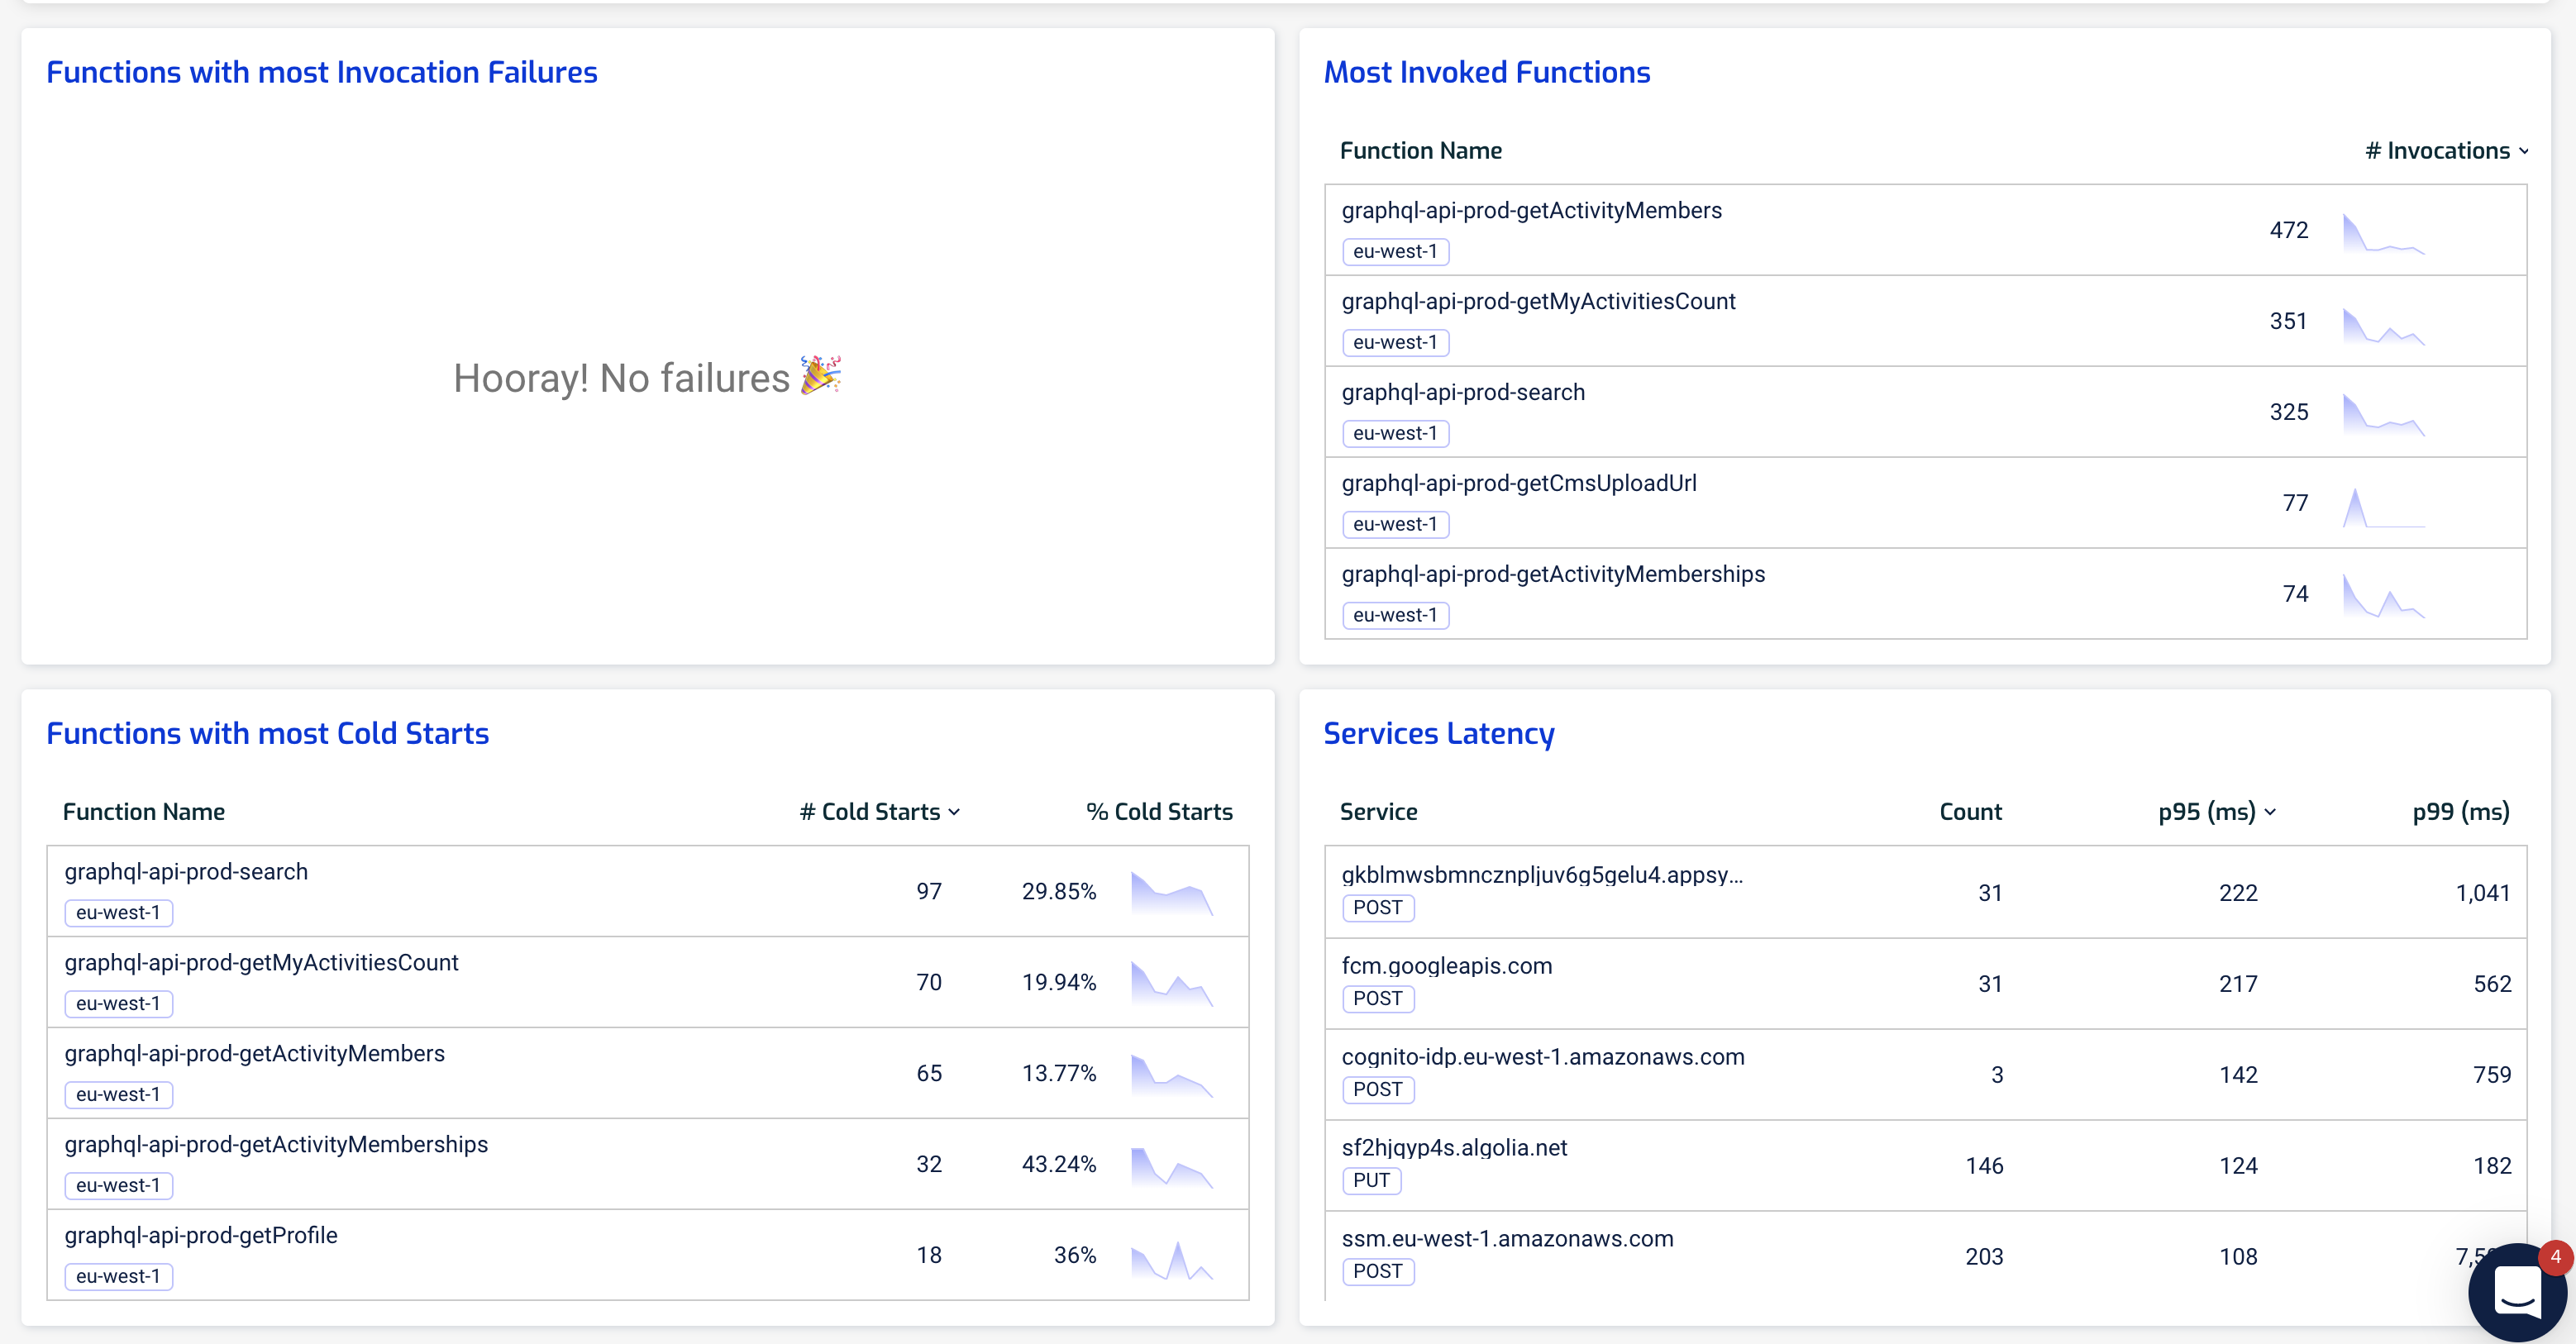
For the macro view of the system, the Dashboard view offers a birds-eye view of our functions and the tail latency for services we depend on.
The Services Latency widget (bottom right) gives us a summary of the response time we saw from other services – both AWS services as well as third-party services such as Algolia or Firebase. Importantly, these are expressed in 95th and 99th percentile so they are representative of the actual user experience.
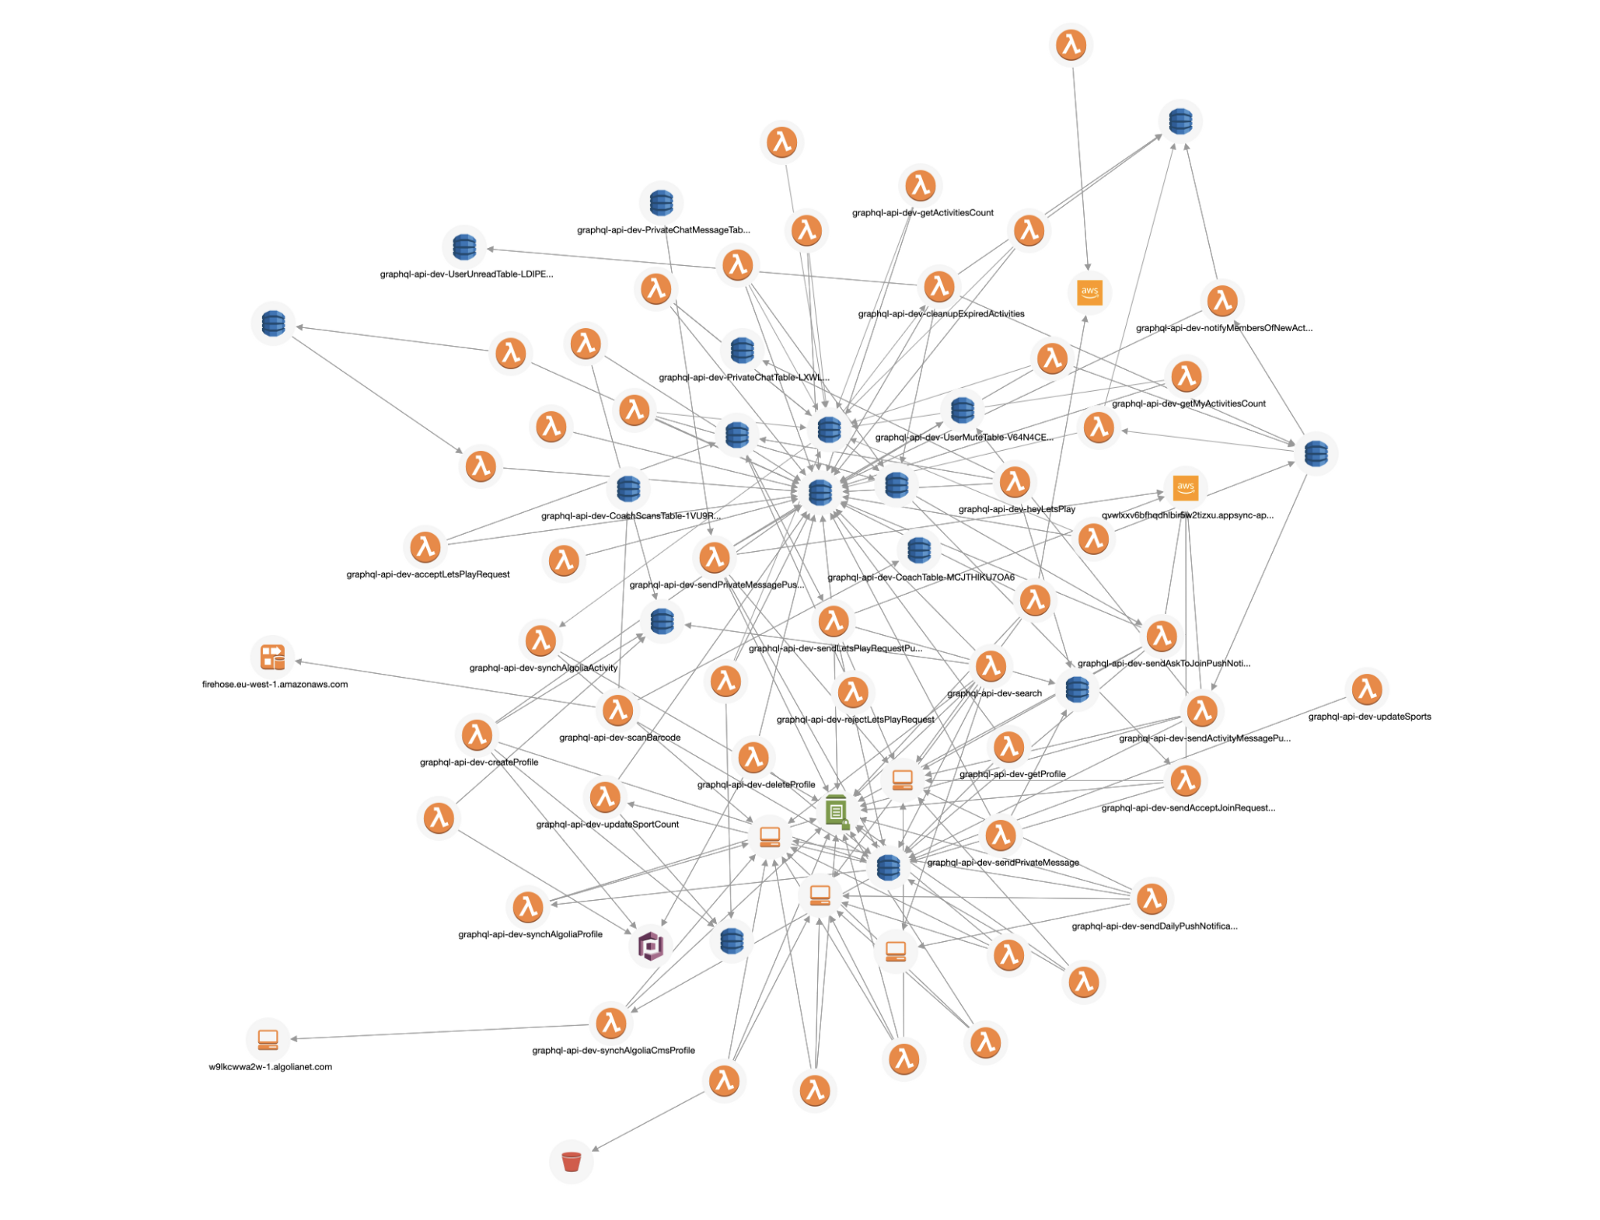
And with the System Map, we have an architecture overview of our system that is generated from the traces. This makes it always up-to-date and based on actual usage data that have been collected.
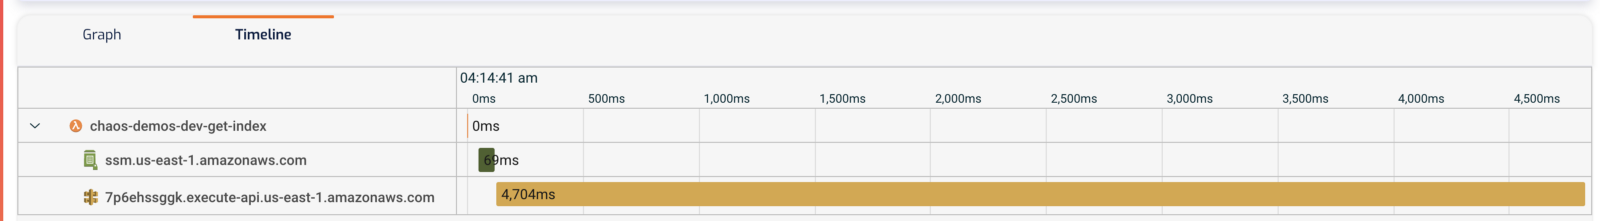
Lastly, similar to X-Ray, even when an invocation times out, we can still get a partial trace and see what was the operation that caused the invocation to time out. In this case, the chaos-demo-dev-get-index function timed out after 3s while waiting for an HTTP response.
3rd party services such as Lumigo provides the same capabilities that X-Ray provides for debugging performance issues while also delivering much more. They do all these while requiring very low touch from the developers to integrate with their services.
The main downside of using services such as Lumigo is that they require another signoff, which can often be a time-consuming process within large enterprises. Which is why they often let us sign up through the AWS Marketplace so we can pay for them through our AWS bill, further simplifying the integration process.
For example, Lumigo is available through the AWS Marketplace here.
Summary
In control theory, observability is a measure of how well internal states of a system can be inferred from knowledge of its external outputs.
— wikipedia (source)
To gain observability into our application, we need to leave clues as to what it was doing at any given moment in time. These clues can come in the form of (but not limited to) logs, metrics and traces. And to help us identify and debug performance issues with our serverless applications we need to know:
- what IO operations did our application perform
- when they started and when they finished
When we are starting out and our application is fairly simple, we can probably make do with just a couple of log messages. But as serverless adoption ramps up within our organization and our application become more expansive and complex, we need more sophisticated tools to help us manage and debug them.
X-Ray is a great service and can help us debug performance problems quickly. But it still requires some manual instrumentation effort and has limited support for debugging other types of problems. Because it doesn’t collect enough information for us to accurately infer the internal state of our application. This is where services such as Lumigo shine.
With Lumigo, there is no manual instrumentation required, and it records far more information about what’s going on inside our application. Which includes the request and response of every HTTP request our functions make, as well as the invocation event and return value of the invocation. This allows us to go back in time and debug all kinds of problems without adding any debug log messages.
I have used Lumigo on several client projects recently and it has proved immensely useful. It took less than 5 minutes to onboard and I was able to get a lot of visibility into what’s happening in my application without spending hours to instrument every IO operation. Lumigo also proved useful for debugging the application during the development phase. Since Lumigo records every request and response (including the invocation event and return value of Lambda functions), I was able to infer the internal state of the application without adding debug log messages all over the codebase. In most cases, I was able to quickly figure out the root cause of problems and debug the application using only the information Lumigo has collected.
All and all, I find Lumigo to be equally useful in the development environments as well as for dealing with problems in the production environment. And to put the cherry on the cake, you can also get started for free and trace up to 150,000 invocations a month at no cost!
If you want to learn more about debugging Lambda performance issues using the approaches discussed in this post, please join us next week on our live Webinar. You can register here, and the recording and slides would be available after the session.