


Developing a native Android app is a challenging task that requires a deep understanding of the Android SDK, as well as programming languages such as Java or Kotlin. The process requires navigating various tools, frameworks, and APIs, each with its own rules. On top of that, you need to ensure compatibility and optimal performance across the diverse Android ecosystem, with its multitude of devices, screen sizes, and OS versions. This task demands meticulous planning and testing to guarantee a seamless user experience on any device.
Beyond the complexities of the Android itself, there’s the monumental task of integrating APIs and other server-side interactions. This step alone can make or break even the most robust of experiences, requiring features like data synchronization, cloud storage, and user authentication to be optimally integrated within the app. These backend interactions are integral to the app’s capabilities and introduce new challenges related to network reliability, data security, and efficient handling of server responses.
This is where OpenTelemetry shines as a powerful tool for gaining observability in complex systems, and mobile app development is no exception. Creating an end-to-end trace can provide deployment insights that allow you to identify even the smallest errors or inconsistencies in your deployment, from mobile applications to database queries and back again. Integrating OpenTelemetry as part of the distributed trace is a great place to start if you want to improve your mobile app stack observability.
In this blog post, we’ll explore how to do just that.
Getting Everything Setup
All good coding adventures begin with some prerequisites, and this blog post is no exception. Android Studio is at the core of this and will involve some fiddly configuration for those who don’t already have it installed and configured. It is worth noting that Android Studio’s environment and run time often will monopolize system resources to compile and collate necessary components, which can be frustrating, especially on less powerful machines.
Pre-requisites:
– Android Studio: The core platform for Android app development, providing the necessary tools and interfaces.
– Lumigo account: Sign-up is quick, easy, and a must-have for any toolchain, especially for monitoring and debugging using Opentelemetry. An additional step here is connecting your Lumigo account to AWS to trace lambda, which we will use a little further on.
– An AWS account: The one-stop shop for all things cloud and beyond.
Additionally, I will mention here too that I’m using an Android device to run the app on instead of the built in emulators simply because my laptop is melting enough with the Android compiling in the summertime. If you have enough local development resources, use the emulators over a device deployment.
After setting up your development environment, you can start creating your first Android app. To demonstrate OpenTelemetry tracing, we will use a simple project with a single button. When pressed, the button will call an external API powered by AWS. With OpenTelemetry, we can monitor and trace this call end-to-end. Let’s get things underway by launching Android Studio and starting a new project, then choosing the ‘Empty Views Activity’ template to keep things simple. Name your project, which I will use OtelTest, set your save location, and select Groovy as the Build config language.
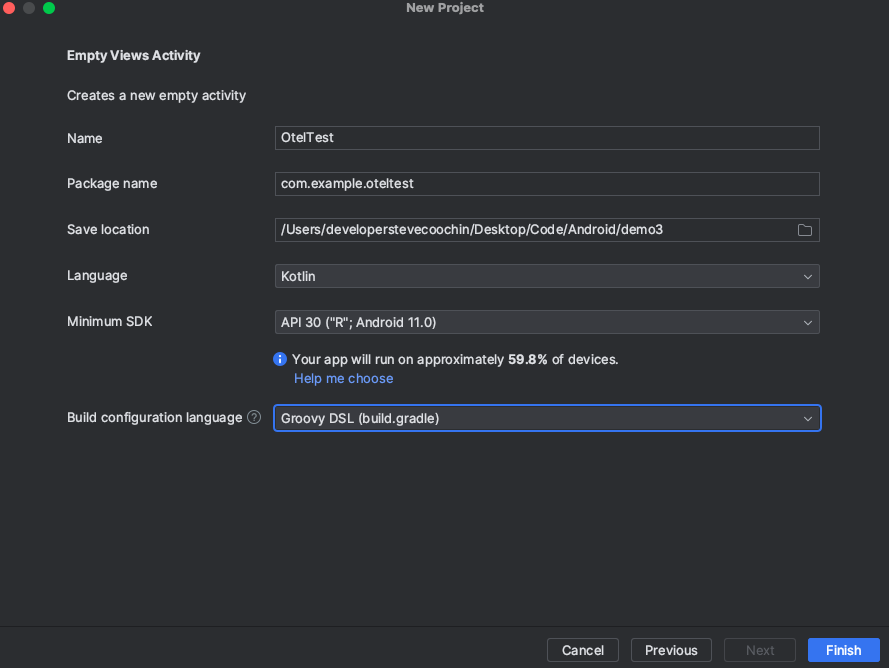
It’s important to note here that if you use a minimum sdk version that is lower than 26, you must enable desugaring. Hit finish and wait for the CPU to settle down from setting up and gathering the required dependencies.
When everything is finished, Navigate to the activity_main.xml file in the app/res/layout folder. This file defines the layout of your app’s interface. You can then use the visual editor or the XML code view to add a Button element. You can drag and drop the Button from the palette in the visual editor or add the following XML code in the text editor:
   <Button

        android:id="@+id/callApiButton"

        android:layout_width="197dp"

        android:layout_height="112dp"

        android:text="Call API"

        app:layout_constraintBottom_toBottomOf="parent"

        app:layout_constraintLeft_toLeftOf="parent"

        app:layout_constraintRight_toRightOf="parent"

        app:layout_constraintTop_toTopOf="parent" />

   <TextView

        android:id="@+id/apiResponseText"

        android:layout_width="wrap_content"

        android:layout_height="wrap_content"

        android:text="API Response will appear here"

        tools:layout_editor_absoluteX="110dp"

        tools:layout_editor_absoluteY="35dp" />
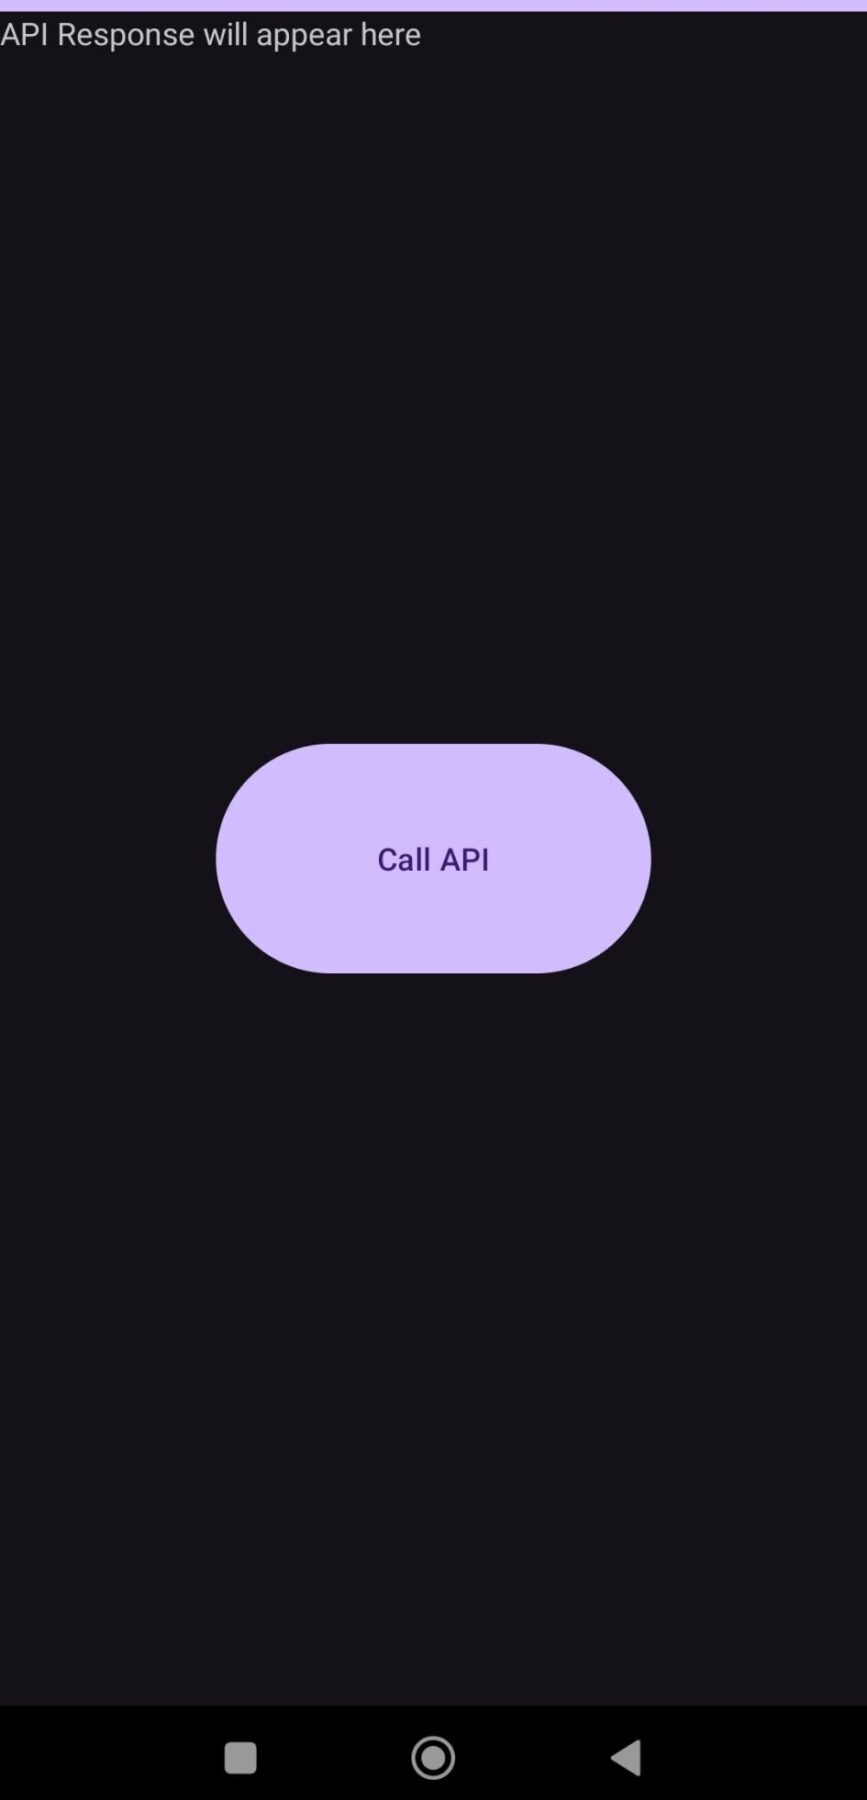
Within the layout I’ve already removed the default “hello world” demo text and adding in an area for the api response to appear.
Now, In your MainActivity file, set up an OnClickListener for the button. This listener will trigger the API call when the button is pressed and return the logged response into the TextView defined in the view. The endpoint URL will update shortly with a lambda endpoint that we will include in the trace data starting from the mobile app.
package com.example.oteltest

import androidx.appcompat.app.AppCompatActivity
import android.os.Bundle
import android.widget.Button
import android.widget.TextView
import kotlinx.coroutines.*
import java.io.BufferedReader
import java.io.InputStreamReader
import java.net.HttpURLConnection
import java.net.URL

class MainActivity : AppCompatActivity() {
    override fun onCreate(savedInstanceState: Bundle?) {
        super.onCreate(savedInstanceState)
        setContentView(R.layout.activity_main)

        val callApiButton: Button = findViewById(R.id.callApiButton)
        val apiResponseText: TextView = findViewById(R.id.apiResponseText)

        callApiButton.setOnClickListener {
            CoroutineScope(Dispatchers.IO).launch {
                val result = apiCall()
                withContext(Dispatchers.Main) {
                    apiResponseText.text = result
                }
            }
        }
    }

    private suspend fun apiCall(): String {
        val url = URL(“https://lambda-endpoint.com/”)
        var result = StringBuilder()

        withContext(Dispatchers.IO) {
            val connection = url.openConnection() as HttpURLConnection
            try {
                val reader = BufferedReader(InputStreamReader(connection.inputStream))
                reader.use { reader ->
                    var line = reader.readLine()
                    while (line != null) {
                        result.append(line)
                        line = reader.readLine()
                    }
                }
            } finally {
                connection.disconnect()
            }
        }

        return result.toString()
    }
}
Lastly we need to declare the necessary permissions in your AndroidManifest.xml file to make network requests. Add the following line to request internet access:
<uses-permission android:name=”android.permission.INTERNET” />
All going well you should end up with an Application that looks something like this
Adding in Android OpenTelemetry
Now we are going to need to introduce the main star into our Android app using the OpenTelemetry Android SDK. Open `build.gradle` in the Gradle Scripts folder and within the dependencies section add the following:
   implementation(“io.opentelemetry.android:instrumentation:0.3.0-alpha”)
   implementation(“io.opentelemetry:opentelemetry-api-events”)
   implementation(“io.opentelemetry:opentelemetry-sdk-logs”)
   implementation(“io.opentelemetry:opentelemetry-sdk”)
   implementation(“io.opentelemetry.instrumentation:opentelemetry-instrumentation-api”)
   implementation ‘io.opentelemetry:opentelemetry-exporter-otlp:1.3.4’
Additionally I’m going to deploy a basic python lambda function on AWS to connect to our endpoint, for demo purposes this will just be using a function URL, although it can just as easily use API Gateway or any other authenticated endpoint for deployed infrastructure.
import json

def lambda_handler(event, context):
    # Process the request here
    # For example, you can extract query string parameters from the event object

    print(“Received event: ” + json.dumps(event, indent=2))

    # Create a response
    response = {
        ‘statusCode’: 200,s
        ‘headers’: {
            ‘Content-Type’: ‘application/json’
        },
        ‘body’: json.dumps({‘message’: ‘Hello from Lambda!’})
    }

    return response
To enable the auto-tracing toggle on the Lumigo Dashboard, set an AWS tag with the key lumigo:auto-trace and value of true, or head to the lumigo dashboard to toggle the auto-trace switch next to the lambda function. Also enable a serverless function URL to replace https://lambda-endpoint.com/ in the MainActivity Android file.
The last step is to add a RumInitializer.kt, which in the interest of creating a very long blog post, can be found on the following gist. Within the file, update the token in here variable on line 56 with your lumigo token from the earlier step as the OTLP endpoint is already configured to use lumigo.
Finally, invoke the Rum Init by including a RumInitializer.init(application) somewhere after the onCreate in your mainactivity.
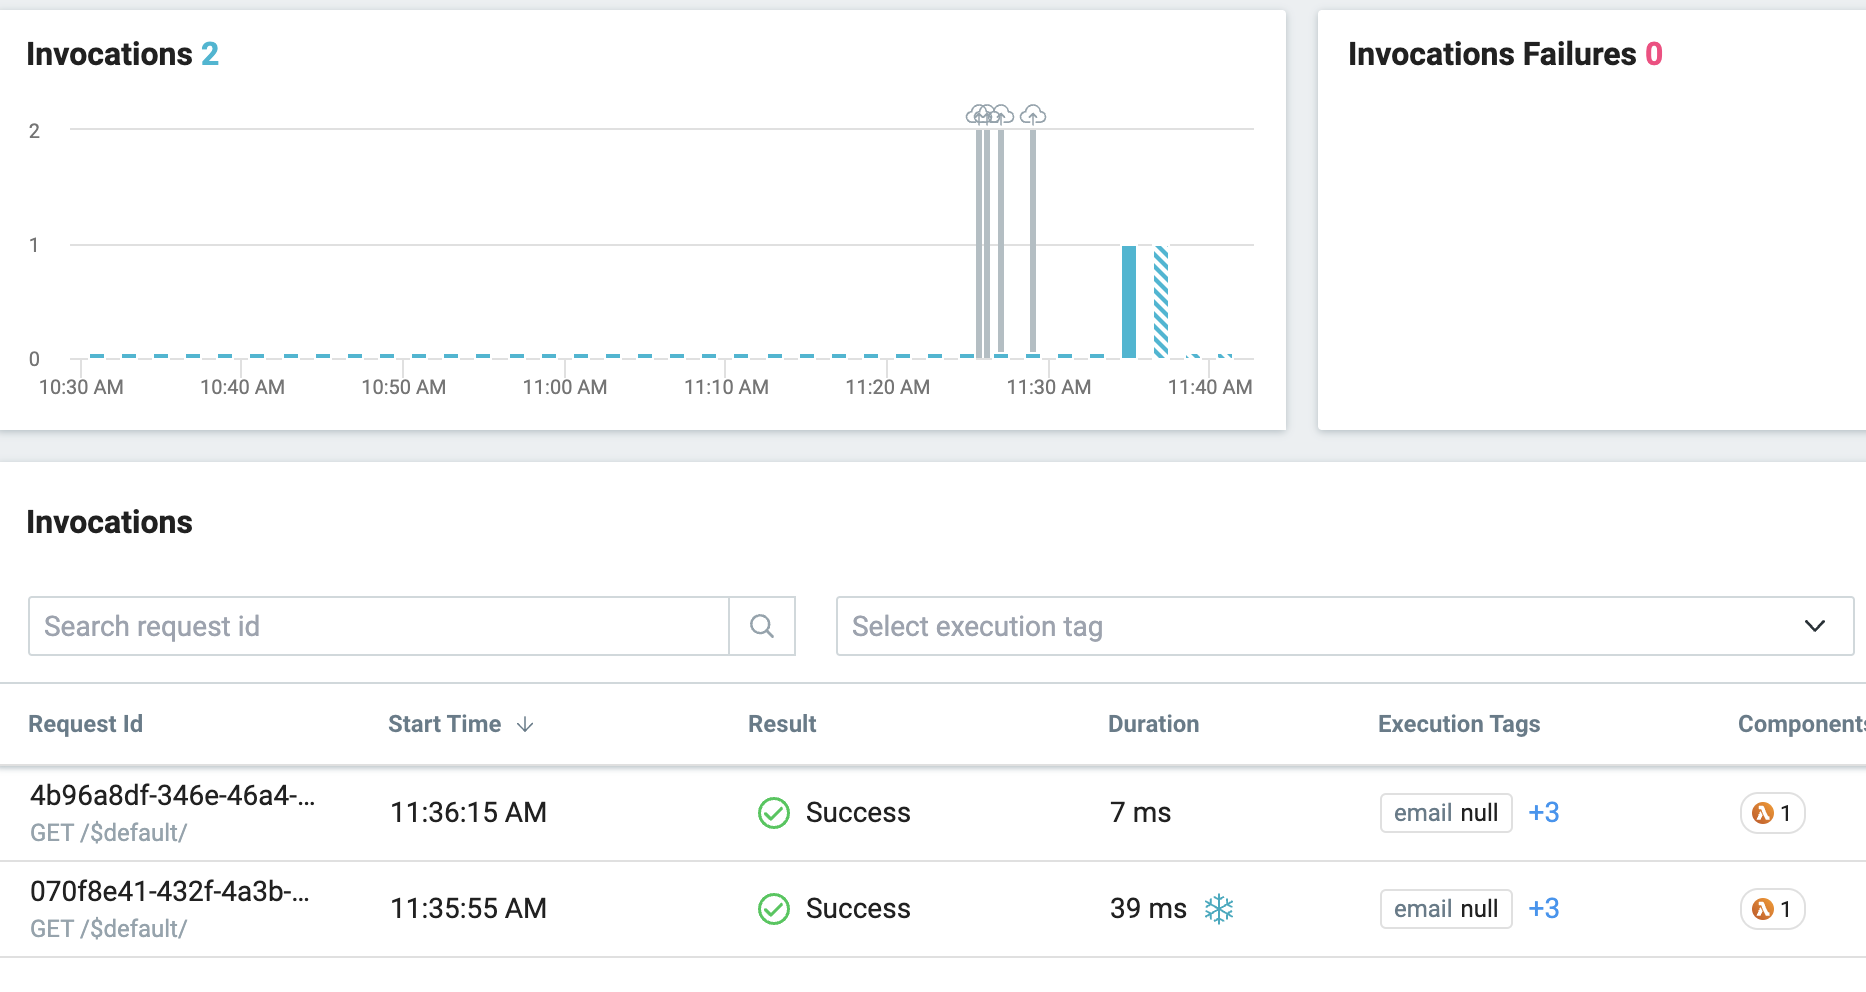
Once everything is updated, hit build and deploy to your test Android device or an emulated device and click the “Call API” button on the Android app.
You should then see the json response from the lambda at the top of the app “Hello from Lambda!” and subsequent invocations appearing within your lumigo instance.
Explore New Horizons in Tracing
It’s no secret that mobile development is tricky, especially when so many elements in play are still evolving and finding their feet. However, it’s noteworthy that the rise of OpenTelemetry is now extending its reach into the mobile domain. This foray into mobile tracing represents an exciting frontier, yet it’s important to acknowledge the nascent stage of this journey. Lumigo adds to this story with a full contextual trace map, meaning you can enrich your OpenTelemetry trace data and debug quicker, leaving more time for coding and less time for digging through logs. If you’re passionate about enhancing app performance and experience, sign up for Lumigo and make monitoring, debugging, and optimizing applications easier.
Lastly, it’s important to note that the OpenTelemetry Android instrumentation is currently in its alpha phase and is evolving, underscoring the importance of community engagement and contribution to shaping its path toward maturity. As we navigate these early days, your involvement and feedback are invaluable, and by contributing to the OpenTelemetry community, you can help add to its development.