Oct 08 2020
There is a growing ecosystem of vendors that are helping AWS customers gain better observability into their serverless applications. All of them have been facing the same struggle: how to collect telemetry data about AWS Lambda functions in a way that’s both performant and cost-efficient.
To address this need, Amazon is announcing today the release of AWS Lambda Extensions. In this post, we discuss what Lambda Extensions are, what problem do they solve, different use cases for them, and how to work with them.
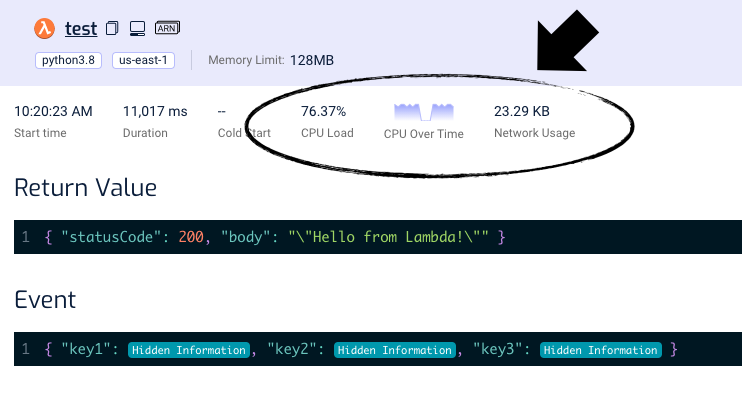
We at Lumigo are proud to join the announcement as an official AWS launch partner. And with it, we’re adding a new capability to the Lumigo platform, which lets you see the CPU and network usage of your functions. This helps you quickly identify functions that are CPU- or network-bound so that you can improve their performance by increasing their memory size.
The problem Lambda Extensions solve
Existing APM solutions require you to run an agent or daemon on your server, which collects telemetry about your application and sends them to the vendor. These agents are designed to collect and send telemetry data asynchronously and to introduce minimum CPU overhead so as to not impede the performance of your application. Additionally, they buffer the data and send them in batches to reduce the number of requests they have to send to the vendor’s backend services.
They depend on the ability to do their job silently in the background.
Previously with Lambda, there was nowhere to install these agents/daemons and no way to perform background tasks when the Lambda workers were not handling an event. It was not even possible to collect telemetry data without you having to make significant changes to your code, e.g., starting a companion process or direct instrumentation in your code.
Only AWS could perform these background tasks because they own the execution environment. This allowed the Lambda runtime to collect and send telemetry data about your functions to AWS services such as Amazon CloudWatch and AWS X-Ray.
As a third-party vendor looking to offer more comprehensive debugging capabilities, we at Lumigo and others had to pick between two unappealing choices:
- Send telemetry data at the end of each invocation, which adds latency to Lambda invocations and can be problematic when invocations time out.
- Write telemetry data to CloudWatch Logs and post-process them. This adds a delay in seeing telemetry data and can add significant cost to CloudWatch Logs, which often costs far more than Lambda.
It’s also not possible to buffer data and send it in batches because when the Lambda worker is garbage collected, buffered data would be lost.
With today’s announcement, this changes.
Lambda Extensions provide a new way to integrate Lambda with your monitoring and security tools.
What are Lambda Extensions?
A Lambda extension is a script that runs alongside your code and receives updates about your function via a poll-based API.

The Lambda Runtime Extensions API follows a similar structure to the Lambda Runtime API, which is used by most of the official runtimes as well as custom runtimes. See here for more information about how the Lambda Runtime API works. Essentially, the extension has to curl a URL like this: http://${AWS_LAMBDA_RUNTIME_API}/2020-01-01/extension/event/next to signal that it’s ready to process the next event.
You can install more than one extension per function. You can pack multiple extensions in the same Lambda Layer. There is, however, a limit of 10 extensions per function.
Internal vs External extensions
There are two types of extensions.
- An internal extension can modify the Lambda runtime environment (using either language-specific environment variables or the new Lambda wrapper script) and runs in-process with your code.
- An external extension runs in a separate process to your code.
Lambda lifecycle
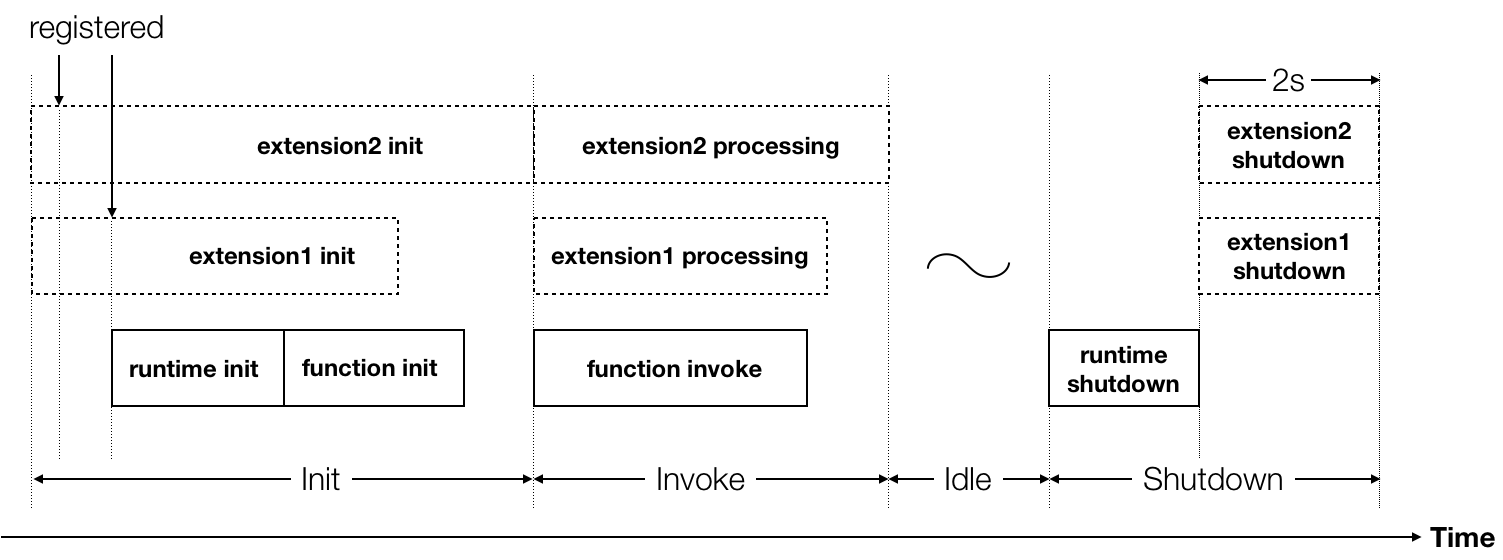
With the introduction of Lambda Extensions, the lifecycle of a Lambda Execution Environment has some additional steps during initialization, invocation, and shut down.
There are a few things to note:
- You can perform initialization logic in the extension. For example, maybe you need to load some configurations from your backend.
- As part of its initialization, an extension has to register itself with the Extensions API by calling the register endpoint http://${AWS_LAMBDA_RUNTIME_API}/2020-01-01/extension/register.
- Extension inits are started in parallel.
- Extension inits are started before the Lambda runtime init. Precisely speaking, the Lambda runtime init starts when all the extensions have registered themselves.
- The
Initphase ends only when the Lambda runtime and all the extensions have signaled that they’re ready. Extensions with expensive initialization logic can therefore add further delays to cold starts. - When your function is invoked, each extension will receive an
INVOKEevent from the Extensions API, in parallel. This kicks the extensions into life. As your code runs, an extension can periodically sample CPU, memory, and network usage, as an example. - However, the Lambda service does not inform extensions when your code has finished . There is no corresponding event for that. However, libraries can communicate with extensions to inform them of completion. Each extension can decide when it is done processing the invoke lifecycle event.
- The
Invokephase ends only when the Lambda runtime and all the extensions have signaled that they’re finished. Once again, if an extension is performing a long-running task then it can add delay to an invocation’s duration. - When the Lambda worker shuts down (maybe due to inactivity) each extension receives a
SHUTDOWNevent from the Extensions API. - During the
Shutdownphase, the extension has two seconds to execute any cleanup logic. For example, flushing any buffered telemetry data.
Pricing
There is no extra charge for installing and running extensions. But a long-running extension can add delay to the invocation and therefore incur extra cost for the invocation.
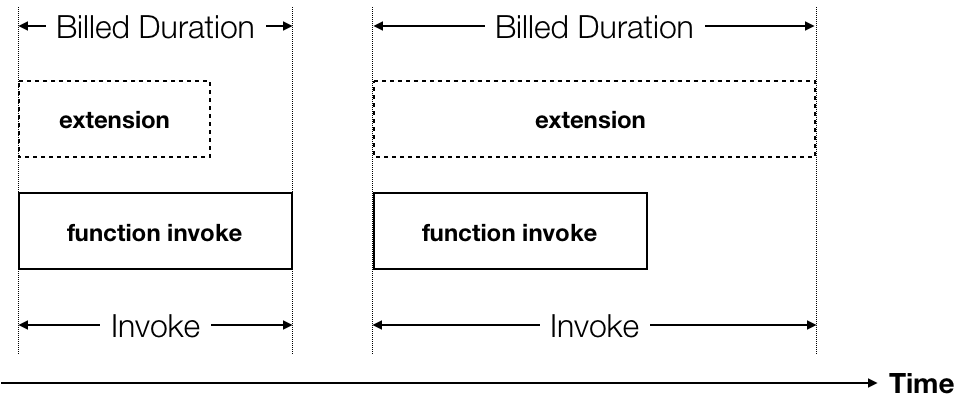
During the preview, the 2s shutdown time will not be charged. But that will change when Lambda Extensions becomes generally available (GA). Please see the Lambda FAQ for more information here.
Performance impacts
Extensions can impact the performance of your function since they share the same resources as your code – CPU, memory, storage, and network bandwidth.
Given that most Lambda functions are IO-heavy, this is unlikely to be an issue in most cases. In fact, while your code is waiting for a response from say, DynamoDB, the CPU is idle anyway!
For functions that perform CPU-intensive tasks, you should verify how much impact extensions have on your function’s performance. In some cases, you might need to reconsider how much memory to allocate to the function. The lumigo-cli has a powertune-lambda command that can help you right-size the memory size to get the best balance between performance and cost.
To monitor the performance overhead of extensions, there is also a new PostRuntimeExtensionsDuration metric. It tells you how much extra time the extension takes after your code has finished running.
Customizing extensions
Extensions have access to the same environment variables and /tmp storage as your function. As an extension author, you can there allow users to customize the behavior of your extension using Lambda environment variables.
It’s also possible to pass data between the main Lambda runtime and the extension by sharing data in the /tmp directory, or via other inter-process communication methods like network sockets. You can even host a local HTTP server in the extension and communicate with it from your function code.
Use cases
Lambda Extensions lets you run additional processes in parallel to the main Lambda runtime. It doesn’t give you background processing time after each invocation as you do with traditional agents and daemons. But it still opens up interesting opportunities for vendors who are focused on observability, security, and governance.
Let’s explore some of these opportunities through Lumigo’s lens.
Observability without instrumentation
At Lumigo, we’re proud to announce that you can now monitor the CPU and network usage of your functions, courtesy of Lambda Extensions.
On every transaction, the Lumigo extension for AWS Lambda would sample CPU and network usage while your code runs and you can see them reflected in a transaction.

The CPU Load tells you how much of the available CPU has been utilized during the invocation. If the CPU Over Time graph flat lines for most of an invocation, that’s a telltale sign that the function is CPU-bound and you should consider upping its memory size.
It’s a little harder to tell when a function is network-bound since AWS does not advertise how much network bandwidth is available. But, at least now you can see how much bandwidth your function is using.
In the near future, we see Lambda Extensions as the path to give you a more streamlined integration with our service. At the moment, we auto-instrument your functions in a number of ways – through the Lumigo console as well as our direct integration with deployment frameworks such as the Serverless Framework. However, this requires language-specific tracers, which is a huge development and maintenance overhead.
Extensions would allow us to give you the same insights about your application but in a way that is language agnostic.
The same extension can be used side-by-side with any Lambda runtime, without needing any instrumentation in your code. This makes it even easier for you to use Lumigo, and it makes it easier for us to support more runtimes both present and in the future.
See also the full Lumigo documentation on Lambda Extensions.
Send telemetry data without latency overhead
In an ideal world, we would like to send telemetry data to our backend after the invocation has finished and your response has been sent to the caller. That way, we won’t add any overhead to your function’s invocation durations, which is especially important for API functions. After all, every extra ms a user has to wait for a response from your API is another chance for the user to get bored and walk away.
Extensions don’t let us do that – yet. Because the invocation response is sent out when the function AND extensions are both done.
But, we also don’t have to resort to writing telemetry data to CloudWatch Logs first and post-process them, which would have added $$$ to your CloudWatch bill!
Instead, we can defer sending the data until the next invocation, or until we receive the SHUTDOWN event when the Lambda worker is garbage collected. Depending on how actively used a function is, this can add unpredictable delays to seeing your data, but it can be a worthwhile tradeoff for API functions where every ms counts.
Security and governance
Say you’re building a SIEM that monitors every packet of data that’s going in and out of your serverless application. You can ship the agent as an external extension and run an Envoy proxy to intercept every network request that leaves the Lambda worker.
Running an Envoy proxy in an extension opens up lots of possibilities.
Maybe you want to block traffic to the public internet for functions that should only be using AWS services. Or you can implement a simple allow/deny list for egress traffic. Yes, you can do all these with VPCs, but this would give you much tighter control at the individual function level without the overhead of dealing with VPCs.
Or how about using an internal extension to override the AWS credentials in the Lambda environment variables? Replace them with honeypot credentials and then use Envoy to intercept any outbound requests to AWS services and resign them using the real credentials. That way, if and when your functions are compromised, at least the real AWS credentials are safe and you can tell which function is compromised by cross-referencing the honeypot credentials.
Conclusion
Lambda Extensions is primarily a feature that is aimed at vendors as opposed to application developers like you and me. But it enables your favorite vendors like Lumigo to deliver a better experience for you and makes it easier for you to develop robust and secure serverless applications.
It’s an important step forward and brings us much closer to parity with the kind of open access that vendors have long enjoyed on our serverful counterparts.
But we can’t stop here, and I believe we won’t.
Serverless-focused vendors are still facing many unique challenges and having to make tough tradeoffs because of platform limitations.
For example, we’d love to be able to send telemetry data in the background without holding up the response from your code – by allowing the invocation response to be sent out before the extensions are done. That way, we can remove all latency overhead to your functions. We would also like to tap into the log collection process so we can ingest your logs without having to go through CloudWatch Logs, which would save you on CloudWatch API costs.
But we’re getting there, step by step. And I for one am excited about what the future holds.

