
- Guide Content
Understanding Datadog Serverless: Solution Overview
What Is Datadog Serverless Monitoring?
Datadog is a tool for monitoring and analyzing the performance of IT systems, including databases, servers, and software tools. DevOps and IT teams can use it to identify which metrics to monitor and to track events in cloud-based services and infrastructure.
Datadog offers serverless monitoring, providing end-to-end observability into the health of serverless applications and minimizing metrics such as mean time to detect (MTTD) and mean time to respond (MTTR). Serverless computing allows organizations to maintain agile IT and development workflows while focusing their efforts on creating applications that generate revenue.
It also helps reduce the operational overhead while providing critical visibility through metrics, logs, and traces of all invocations of the serverless apps. Thus, teams can create and deploy code confidently.
This is part of a series of articles about serverless debugging.
In this article

Datadog Serverless Monitoring Services
Here is an overview of Datadog serveless monitoring for various AWS services.
AWS Lambda
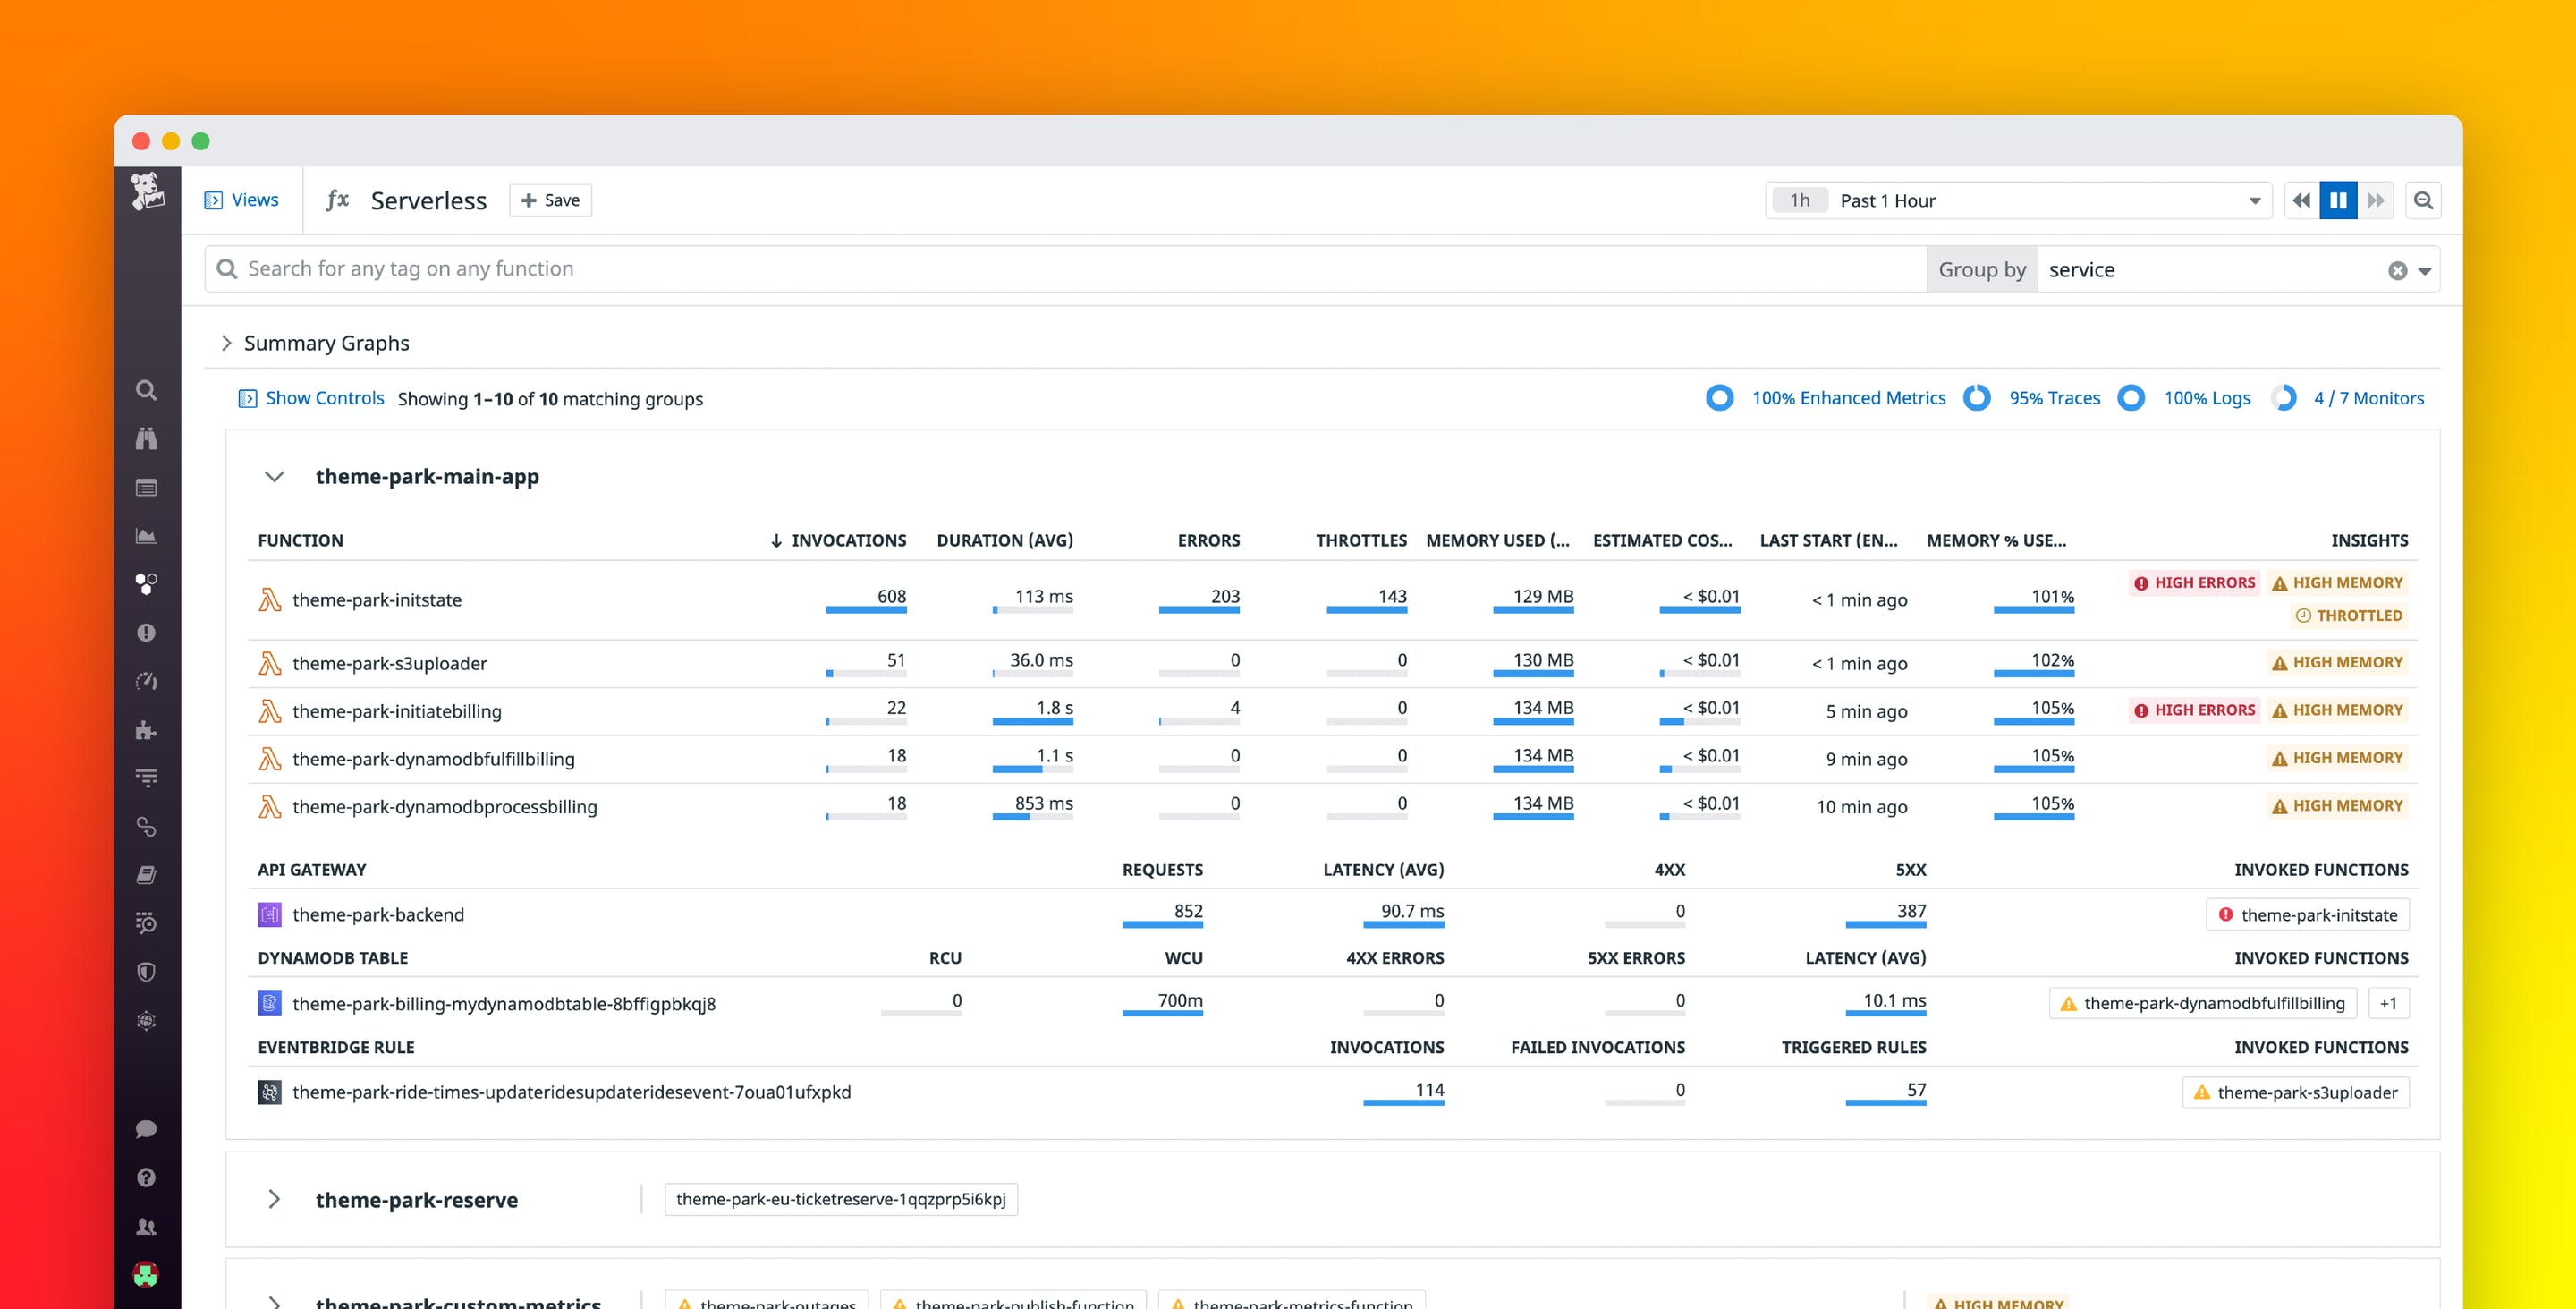
With the serverless view, you can collect high-level metrics from multiple AWS resources and correlate them with Lambda functions to quickly identify issues. This view groups serverless resources based on the service they belong to, creating a visualization of how each application component performs. It displays the functions associated with each service alongside the resources that are invoking them (e.g., Amazon S3, API Gateway, SQS, SNS, DynamoDB, Kinesis).

Image Source: Datadog
Datadog will automatically collect the requests and responses of each function when it is invoked – this information helps in troubleshooting. For instance, you might receive a notification that a given Lambda function is failing – to identify misconfiguration issues that caused the failure, you could analyze the function’s request payloads to look for typos and omissions in parameters or resource addresses.
Once you identify the misconfigurations in the failed requests, it is easier to reproduce the performance issues in the dev environment, run tests, and confirm that the fixes were successful.
Azure App Service
App Services is a collection of serverless application resources that let you build and host web applications, functions, RESTful APIs, and mobile backends, without having to manage infrastructure. It supports workloads of any size, with high-availability and automatic scaling options.
Datadog offers monitoring for all types of resources in App Services, including metrics from Azure Monitor. You can identify problems quickly using the App Service View, which maps the relationships between resources and provides cost and performance insights. Alternatively, you can use the API to submit custom metrics.
Azure App Services has a Datadog extension that offers extra capabilities, including .
- Fully distributed application performance monitoring (APM) with auto-instrumentation.
- Customizable APM and views of traces.
- Manual customization and instrumentation of APM services.
Google Cloud Run
Cloud Run is Google’s fully managed platform for running serverless applications, which enables the scaling and deployment of containerized apps. Datadog’s monitoring and logging capabilities support Cloud Run via the Google Cloud Platform integration. Datadog has another solution that is currently in beta (but publicly available), which instruments Cloud Run applications using a specially-built agent that enables custom metrics, tracing, and direct collection of logs.
Datadog Serverless Features
Enhanced Lambda Metrics
Datadog can generate enhanced Lambda metrics with high granularity (within a few seconds), low latency, and metadata for custom tags and cold starts. This is possible using AWS’ Lambda integration. These enhanced metrics provide a significantly more detailed view than Lambda’s default metrics and are found in the “lambda.enhanced” namespace.
Examples of enhanced Lambda metrics include:
- aws.lambda.enhanced.invocations: Counts a function’s invocations in response to an API call or specific event.
- aws.lambda.enhanced.max_memory_used: Shows the maximum memory consumed by a function (in MB).
- aws.lambda.enhanced.produced_bytes: Shows how many bytes a function returns.
- aws.lambda.enhanced.estimated_cost: Provides the total estimated cost of invoking a function.
Custom Serverless Application Metrics
There are several ways to use custom metrics in Datadog with Lambda functions:
- Create metrics from traces or logs: When a Lambda function sends traces or logs to Datadog, you can query the data in these by generating custom metrics from the traces or logs. You don’t have to re-deploy or change the application code.
- Submit metrics with Datadog’s Lambda extension: This is the recommended way to send custom metrics directly from Lambda functions.
- Submit metrics with the Datadog Forwarder Lambda: This option is useful for forwarding telemetry data from Lambda functions.
Serverless Distributed Tracing
If you connect the traces from serverless applications to metrics, Datadog can provide a context-rich view of the application’s performance to assist in troubleshooting. This is important because serverless applications are distributed, making them harder to monitor. Datadog has several libraries that enable distributed tracing, including Python, Ruby, Node.js, Go, .NET, and Java.
You can apply Datadog’s APM capabilities to serverless applications by using dd-trace (the Datadog tracing client) or pulling traces from AWS X-Ray.
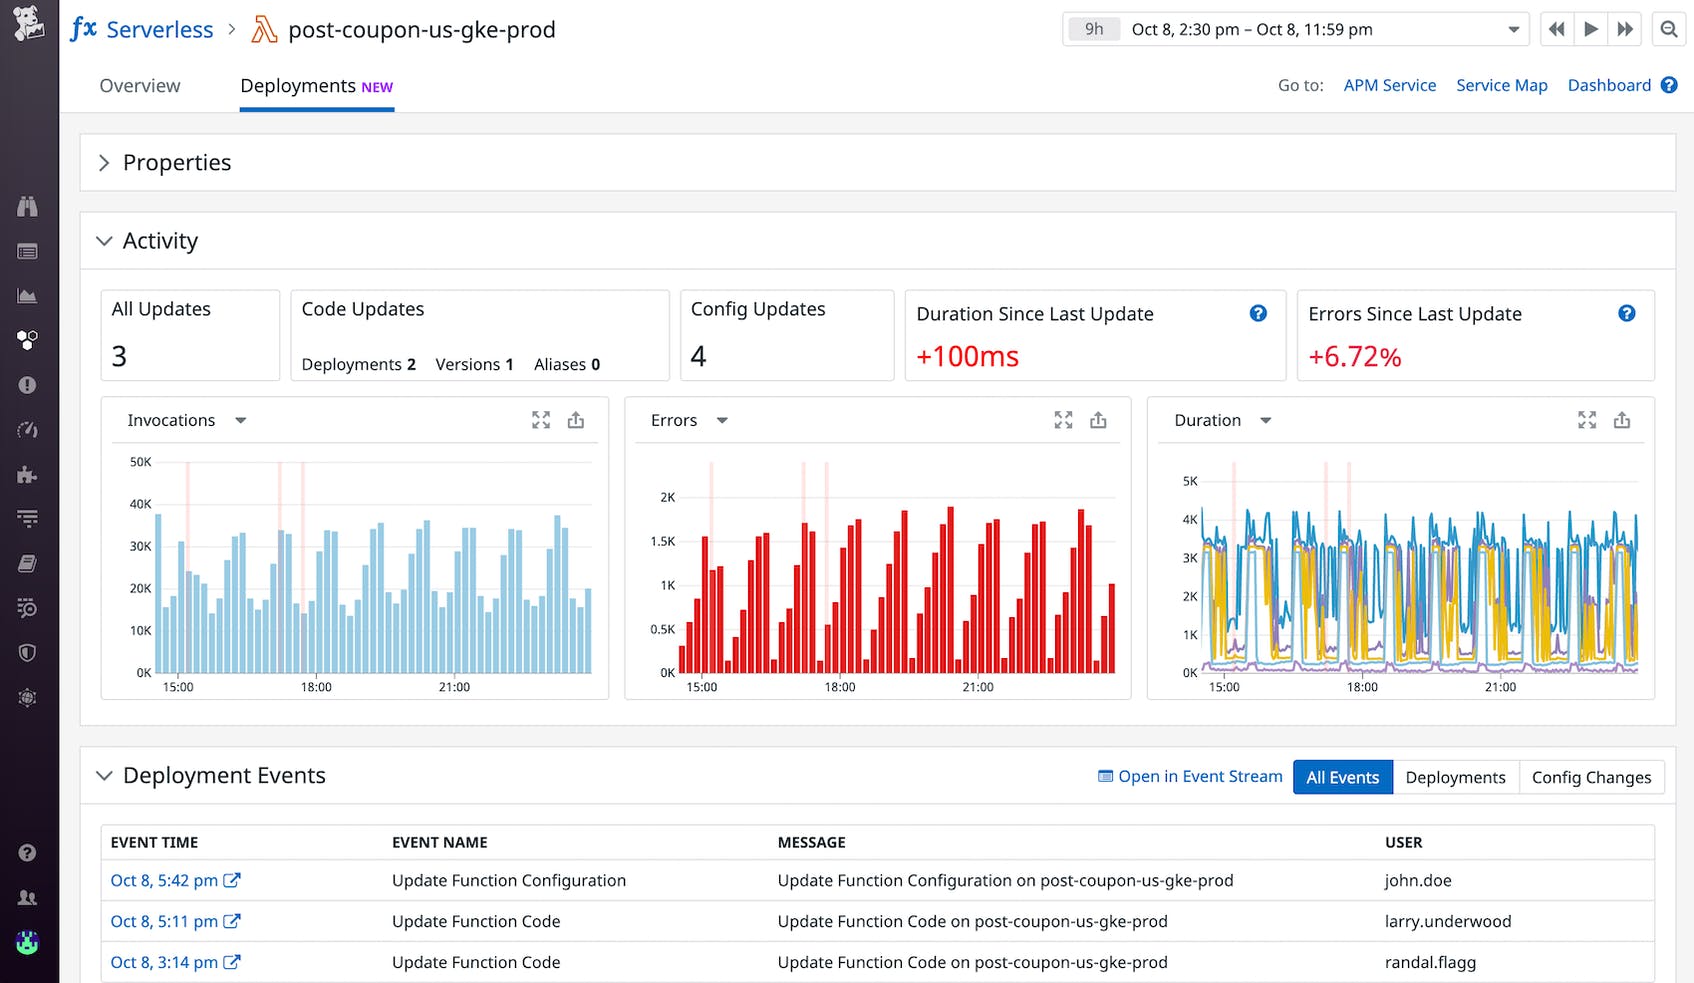
Deployment Tracking
Tracking deployments is useful for understanding when the new code version or configuration changes have affected application performance or resulted in a higher error rate. It also helps identify cloud drift (when the environment diverges from the desired state).
To enable deployment tracking for a serverless application, you can go to the Serverless view in Datadog, choose your function, and select Deployments. The resulting page will provide key serverless app metrics such as invocations, error counts, and execution durations.
You can also view the history of your configuration and code changes by adjusting the global time field at the top-right of the page.

Image Source: Datadog
Datadog Limitations for Serverless Monitoring
Datadog is a powerful monitoring and analytics platform that provides a wide range of monitoring and analytics capabilities for various types of technology stacks, including serverless environments. However, like all monitoring tools, it also has certain limitations for serverless monitoring. Here is a summary of the disadvantages users flagged on trustradius.com:
- Documentation: Many users complain that Datadog’s documentation is difficult to understand and navigate, making it difficult to learn how to use the platform and troubleshoot quickly.
- Difficult to set up: Datadog requires installation and configuration to set up automatic agents, which can be difficult for new Datadog users. In general, user report there is a steep learning curve for using the platform, and it takes a while, even for technical users.
- Not intuitive: Creating customized dashboards from scratch can take time and effort. Users also report that the platform is difficult to use and is not intuitive enough.
- Billing and trial: Users mention that the trial period is too short and the billing report is confusing.
- Not robust enough: Users report that the Datadog agent does not provide enough features compared to other solutions, and the agent has delays which means it does not always provide reliable information.
Lumigo vs Datadog for Serverless Observability
Serverless architectures introduced many benefits for developers looking to easily build and scale their applications. When it comes to observability however, serverless brought new challenges that traditional monitoring solutions were not equipped to handle.
While a DataDog is a robust monitoring tool, it wasn’t built to tackle the complexities of modern, microservice and serverless applications, which are dynamic and made up of many different, dynamic services. Blind to some common managed services used in serverless applications, and with limited debugging data, the view developers get into their serverless apps with Datadog can be inadequate for troubleshooting. While the Datadog platform offers distributed tracing, traces can be missing services and break between them, leaving users to manually reconstruct disconnected pieces of their apps to get a complete view.
Lumigo, on the other hand, was purpose-built for serverless applications, and in one complete visualization, Lumigo automatically stitches together asynchronous requests, in context, across all the services used in serverless apps. With the ability to trace from event trigger through managed services like AWS DynamoDB and AWS Step Functions, as well as third party services like Twilio, no transaction is to complex for Lumigo to trace end-to-end.