Lambda’s Event-Source Mapping (ESM) has been a game-changer for Lambda users. It gives users an easy and cost-efficient way to process events from Amazon SQS, Amazon Kinesis, Amazon DynamoDB, Amazon Managed Streaming for Apache Kafka (Amazon MSK), Amazon MQ and more.
It handles all the complexities around polling, including scaling the no. of pollers. And there’s no charge for this invisible layer of infrastructure!
But one downside with ESM is that it’s a black box and we don’t have visibility into its working. How many events did it receive? Were there any problems with lambda invocations?
We can infer some of these through other service metrics. For example, we can use SQS’s NumberOfMessagesReceived metric to infer the number of messages the ESM should have received.
But this doesn’t account for problems between SQS and ESM. For example, if there are networking or permission issues that affect ESM’s ability to poll from the queues.
Similarly, if a function does not have sufficient concurrency to process events, ESM will retry the throttled invocations automatically. But without visibility, it’s possible to lose data if events are not processed before they expire from the stream or queue.
It’s good to see AWS address these gaps with the new ESM metrics. Today, AWS Lambda released a set of ESM metrics for SQS, Kinesis and DynamoDB streams.
Here are all the new metrics.
Common ESM metrics
There are 3 common metrics for all supported ESM sources:
- PolledEventCount: The number of events ESM successfully polled from the source. Monitor this to catch problems related to polling, e.g. permission issues, or misconfigured event source.
- InvokedEventCount: The number of events ESM sent to the target Lambda function, both success and failures. In case of errors, this metric can be higher than the
PolledEventCount due to retries.
- FilteredOutEventCount: The number of events that have been filtered out by ESM when you have configured a filter criteria.
SQS ESM metrics
In addition to the common ESM metrics above, SQS ESM also have these metrics.
- DeletedEventCount: The number of messages that ESM deletes from SQS upon successful processing. Monitor this to catch problems related to SQS delete permissions.
- FailedInvokeEventCount: The number of SQS messages that were not processed successfully. If
ReportBatchItemFailures is used then this is the number of messages in the BatchItemFailures array. Otherwise, it’s the whole batch.
Kinesis/DynamoDB ESM metrics
In addition to the common ESM metrics above, Kinesis and DynamoDB ESM also have these metrics.
- DroppedEventCount: The number of records dropped by ESM due to expiry (when
MaximumRecordAgeInSeconds is configured) or max retries being exhausted.
- OnFailureDestinationDeliveredEventCount: The number of records ESM successfully sent to the OnFailure Destination (when one is configured). This should match the
DroppedEventCount. If they diverge, then there’s a problem with sending filtered/failed events to the OnFailure Destination. However, these delivery failures should be covered by the DestinationDeliveryFailures metric already, so I’m not sure how useful this new metric is.
- FailedInvokeEventCount: This is similar to the
FailedInvokeEventCount metric for SQS ESM but with its own… erm… unique twists… If you use ReportBatchItemFailures then this counts “records in the batch between the lowest sequence number returned in BatchItemFailures and the largest sequence number in the batch”. It’s not you, I don’t get it neither… If you use BisectBatchOnFunctionError then this metric counts the entire batch upon function failure. It feels like some implementation detail that we’re not privy to has leaked into this metric. I think this can be useful as a soft signal that something’s wrong, but not as a precise measure of how many events are affected.
Cost
These new metrics are charged at CloudWatch’s standard rate of $0.30 per metric per month. However, there is no charge for the PutMetric API calls.
Get started
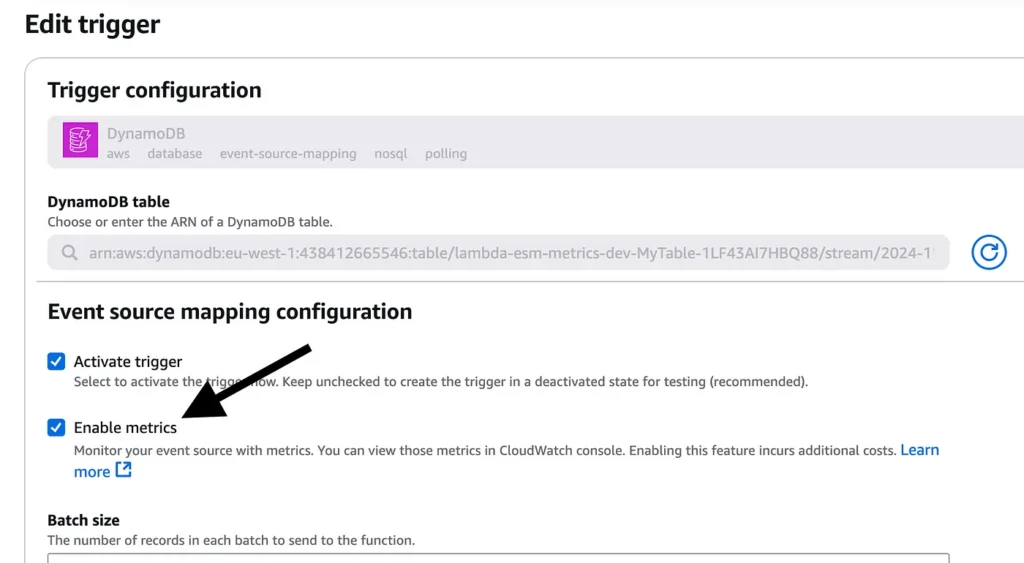
You can enable these ESM metrics on a per-ESM basis through CloudFormation, AWS SDK, AWS CLI and the AWS console.
CloudFormation
You can enable the new metrics via a new MetricsConfig property for the AWS::Lambda::EventSourceMapping resource type.
Type: AWS::Lambda::EventSourceMapping
Properties:
  ... // usual ESM properties
  MetricsConfig:
    Metrics:
      - EventCount
The Metrics property nested in MetricsConfig is typed as an array for future purposes. The only allowed value today is EventCount and it enables the new metrics mentioned above, based on the type of ESM.
AWS Console
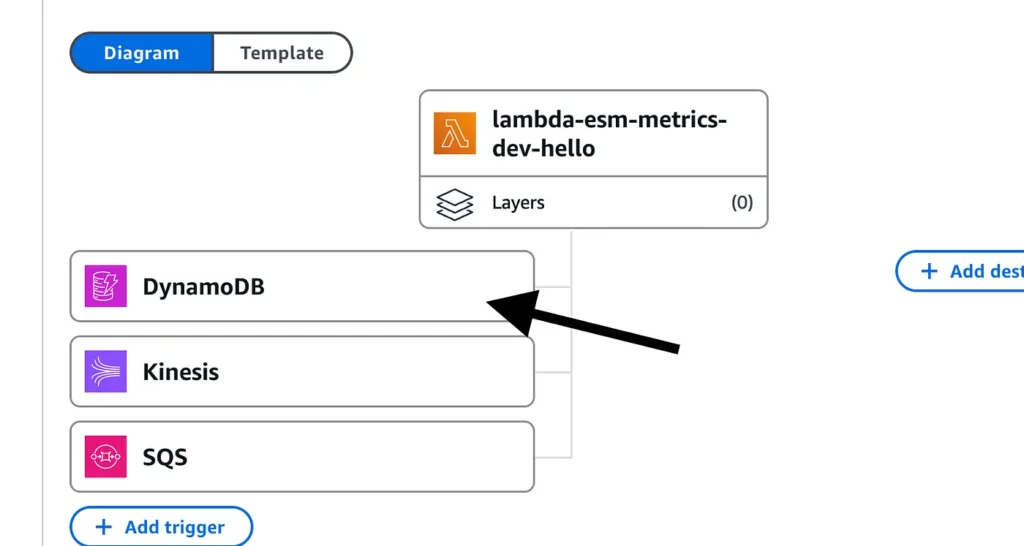
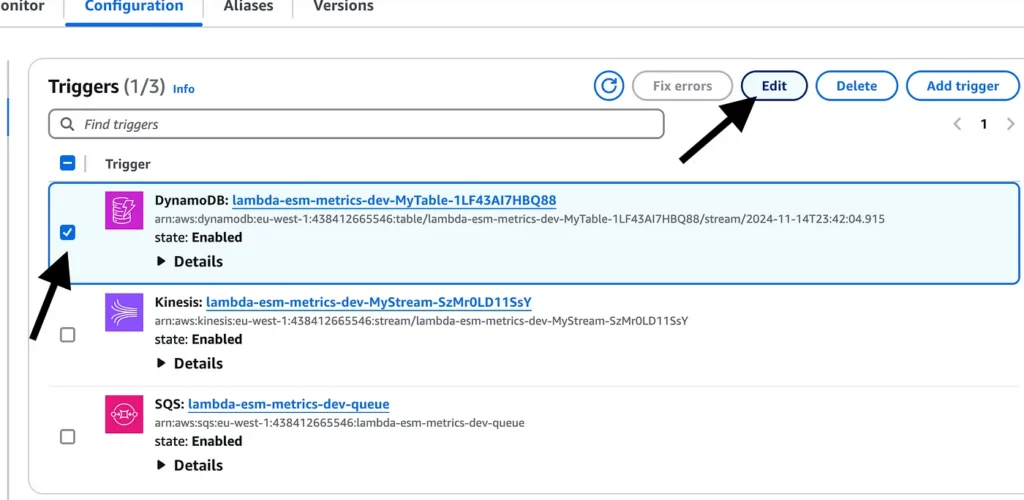
First, go to the Lambda function’s page and click on one of the ESMs.

Select the ESM you want to enable and click “Edit”.

Check “Enable metrics”.

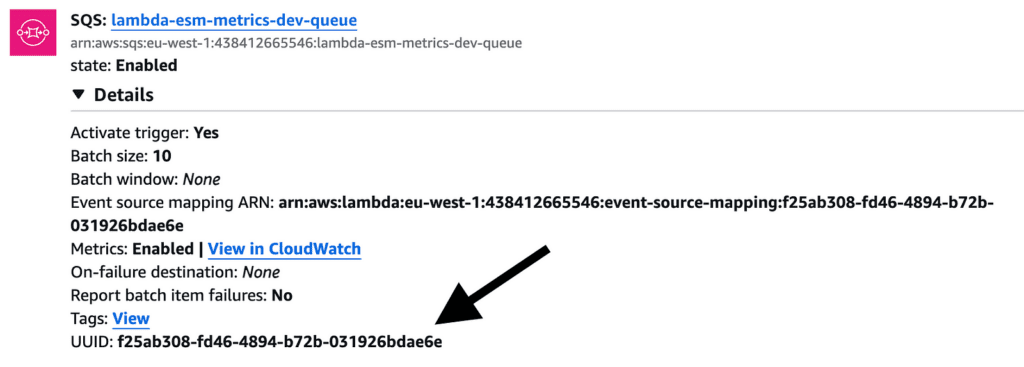
The challenge with these new metrics is that they are grouped by ESM ID. If you have multiple ESMs, it’s hard to figure out which is which at a glance.
The easiest way to find the ESM UUID is the Lambda console.

Creating alerts in Lumigo
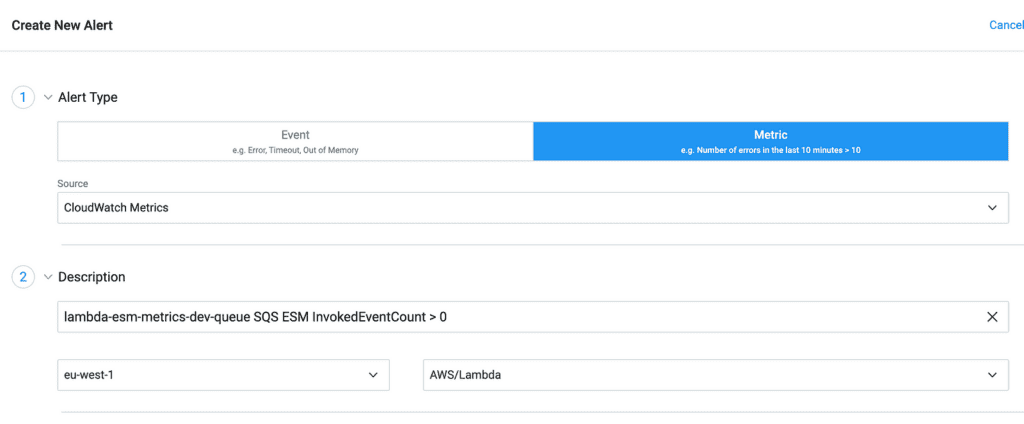
Once you have enabled the metrics, you can easily create alerts in Lumigo.
1. Select “Metrics” and then “CloudWatch Metrics”.
2. Add a description for the alarm and set the region and metric category.

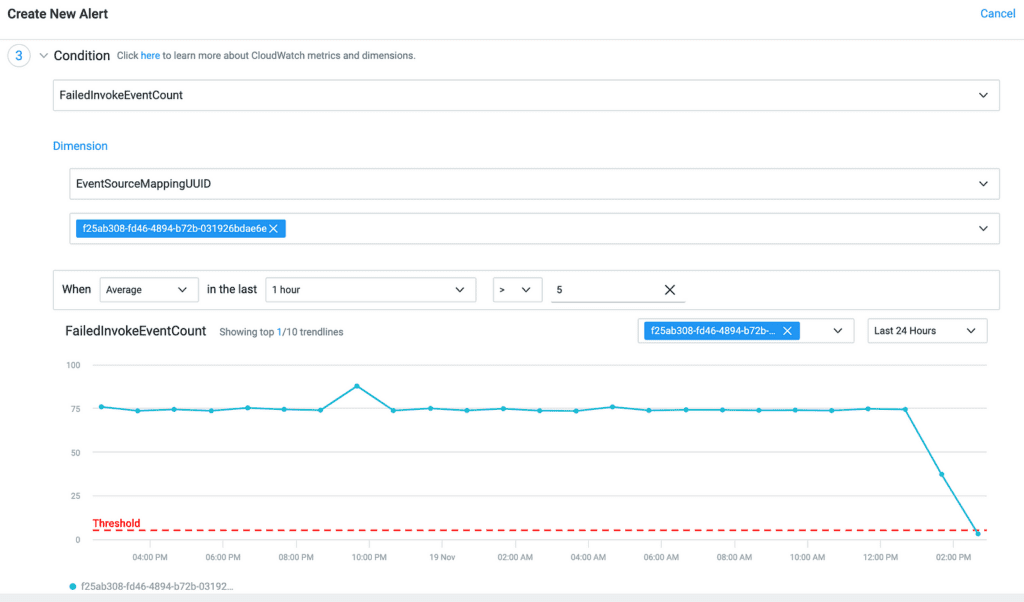
3. Choose the metric, ESM UUID, and the statistic (average in this case) and the threshold for the alarm.

4. And finally, how you’d like to be notified.

Lumigo integrates with a wide range of platforms. So you can get notified through a number of different ways.

Summary
I love using managed capabilities like ESM. They let us do more with less and focus on the things that matter to our customers.
But when things go wrong, it can feel like we are flying blind.
The introduction of these new ESM metrics provides much-needed visibility into the inner workings of ESM. They help us monitor performance and troubleshoot issues.
While there is a nominal cost associated with these metrics, the benefits of enhanced monitoring and the potential to prevent significant issues make them a valuable addition to your serverless toolkit.
I encourage you to enable these metrics for your critical event sources and use Lumigo to alert you on your preferred channel.


