


Welcome back to the final installment in our three-part series on building your own SDK generator.
The story so far..
In the first post, we plunged headfirst into the mysterious world of APIs, crafting our very own REST APIs by taming those pet store APIs. Part two was all about unleashing our creativity, fashioning custom SDKs straight from the API spec. But hold on tight because we’re not done yet! The adventure continues as we dive into the heart of our SDKaaS escapade.
In this post, we are going to generate a SDK from our API and deploy to Lambda as part of a test app.
Why Monitoring is Essential for APIs and SDKs
This series is dedicated to showcasing how to streamline monitoring throughout the entire journey, from API service deployment to developer integration of the generated SDK. In this tripartite process, two pivotal stages demand the spotlight: the API’s operational dynamics and the SDK’s deployed state.
In the intricate interplay of API and SDK development, monitoring emerges as an essential guardian of your deployment’s integrity and user satisfaction. It transcends more than being just data tracking, providing real-time insights across your software’s lifecycle, from inception to integration.
Imagine implanting your meticulously crafted SDK within a Lambda function, primed for user requests. However, an unforeseen compatibility hiccup or excessive resource consumption lurks, hindering performance. Vigilant monitoring is the antidote, preempting such setbacks before they evolve into user-experience-altering issues.
The Advantages of End to End API and SDK monitoring:
- Early Issue Detection: Monitoring allows you to catch glitches at their infancy. Whether it’s a sudden spike in resource usage during SDK use or a latency increase during deployment, monitoring provides early alerts.
- Performance Optimization: Tracking various performance parameters over time helps identify bottlenecks. By analyzing these metrics, you can optimize SDKs as much as possible, and ensure a best possible experience with integrating developer environments.
- Predictive Maintenance: Proactive monitoring enables predictive maintenance. Instead of reacting to issues, you can predict potential problems and address them before they impact users.
- Continuous Improvement: Monitoring isn’t just about problem-solving; it’s also about improvement. Regularly analyzing data helps refine your API and subsequent SDKs, making the SDK cycle even more efficient.
- User Experience Enhancement: SDKs are meant to enhance user experience. Monitoring ensures that the SDK is not just functional but also delivering the expected performance to users.
Deploying a SDK Test App
Continuing from our API Gateway pet shop deployment, we are going to generate an SDK and use it to deploy an app to Lambda. To do this we are going to need the OpenAPI spec from our deployed demo petstore API.
First we are going to need the API spec from our deployed API, This can be retrieved via an authenticated AWS CLI call, using the following
aws apigateway get-export --parameters extensions='apigateway' --rest-api-id {api_id} --stage-name v1 --export-type oas30 api.json
Learn more about OpenAPI exports from API Gateway through the AWS docs. To find out more about Lumigo’s support for API Gateway, head on over to the API Gateway View help docs.
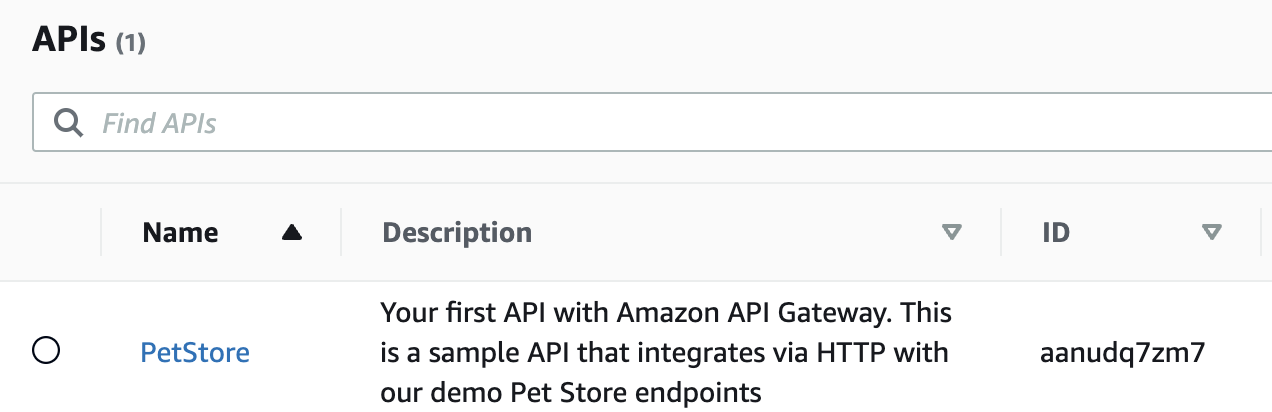
Replace {api_id} with the deployed API’s ID, retrievable either from the AWS console or by executing aws apigateway get-rest-apis. You can also get the API’s associated stages by running:
aws apigateway get-stages –rest-api-id {api_id}
The goal here is to return an Openapi Spec from the nominated API. The returned file should look something like this:
{
  “openapi” : “3.0.1”,
  “info” : {
    “title” : “PetStore”,
    “description” : “Your first API with Amazon API Gateway. This is a sample API that integrates via HTTP with our demo Pet Store endpoints”,
    “version” : “2023-08-24T06:23:39Z”
  },
  “servers” : [ {
    “url” : “https://aa.execute-api.us-east-1.amazonaws.com/{basePath}”,
    “variables” : {
      “basePath” : {
        “default” : “v1”
      }
    }
  } ],
  “paths” : {
    “/pets” : {
….
With the OpenAPI spec in hand, we proceed to send it to our SDK service endpoint to generate an SDK for use in our demo app. We’ll utilize the JavaScript endpoint to create a Node-based SDK, but a plethora of languages are supported by openapi-generator’s client generators.
Our SDK curl call would look like this:
curl -X POST –header ‘Content-Type: application/json’ –header ‘Accept: application/json’ \
-d ‘{“openAPIUrl”: {OpenAPI File Location}}’ \
‘http://{ECS task IP}:8080/api/gen/clients/javascript’
Here we are doing a curl call to the {ECS Task IP} location of our SDK container, in this case running on a ECS deployment. Also included is the {OpenAPI File Location} url, using the OpenAPI spec file location. The location of the file can be somewhere publicly available, an s3 bucket or an Ngrok tunnel from a local env which is handy particularly when testing.
Upon executing this curl call, you should receive a one-time SDK download link encapsulated in JSON, containing your requested SDK:
{“code”:”3af73bf1-697e-410e-a4aa-bc8ff651dde39″,”link”:”http://{ECS task IP}:8080/api/gen/download/5af73bf1-697e-410e-a4aa-bc9ee651fc39″}
Download or use wget to fetch the SDK file URL, followed by extracting it using unzip or its equivalent. Finally, use this SDK to build an app and deploy it to Lambda for monitoring.
Lastly we are going to use this SDK to build an app, then deploy to Lambda to monitor.
With our Lumigo account already configured and connected to the AWS account being used for the deployment, we will be able to see once invocations from our deployment are already being detected.
Deploying to Lambda
An invaluable perk of these generated SDKs is their bundled documentation. This dual advantage not only expedites our test app development but also streamlines the integration process when deploying to a repository. It’s like having a well-organized toolkit for seamless development and deployment.
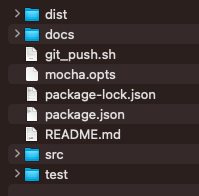
A quick look over the SDK’s README gives a few options for integration use, including to use locally with a little babel assisted `npm build`. This will build the SDK in the dist directory, making it ready for app deployment use. Alternatively, there’s also included README instructions for repo and even NPM deployment.
To get this running in our local env quickly, create a new node app using `npm init` and `npm install superagent` in the newly created app. This will be needed by our demo app for use with our pet_store sdk. Lastly copy the dist folder, and its contents, from the SDK folder into the demo app node_modules directory and rename it to `pet_store`.
Utilize the code from the generated SDK’s README to employ the SDK locally:
const PetStore = require(‘pet_store’);
let apiInstance = new PetStore.DefaultApi();
let opts = {
  ‘type’: ‘type_example’,
  ‘page’: ‘page_example’
};
apiInstance.petsGet(opts, (error, data, response) => {
  if (error) {
    console.error(error);
  } else {
    console.log(‘API called successfully. Returned data: ‘ + JSON.stringify(data));
  }
});
Running `node index.js` within the demo app’s root should yield results similar to:
API called successfully. Returned data: [{“id”:1,”type”:”type_example”,”price”:249.99},{“id”:2,”type”:”type_example”,”price”:124.99},{“id”:3,”type”:”type_example”,”price”:0.99}]
Finally deploy that as a lambda function via aws cli, zip upload or however you deploy lambdas. This is what I used on a Node 16 lambda deployment:
import PetStore from ‘pet_store’;
const handler = async (event, context) => {
  let apiInstance = new PetStore.DefaultApi();
  let opts = {
    ‘type’: ‘type_example’, // String
    ‘page’: ‘page_example’ // String
  };
  try {
    const data = await new Promise((resolve, reject) => {
      apiInstance.petsGet(opts, (error, data, response) => {
        if (error) {
          reject(error);
        } else {
          resolve(data);
        }
      });
    });
    console.log(‘API called successfully. Returned data:’, data);
    return {
      statusCode: 200,
      body: JSON.stringify(data)
    };
  } catch (error) {
    console.error(‘Error:’, error);
    return {
      statusCode: 500,
      body: JSON.stringify({ message: ‘Internal server error’ })
    };
  }
};
export { handler };
Invoke the newly deployed serverless function, which should then start to show some invocations in the connected Lumigo dashboard thanks to some auto-tracing.
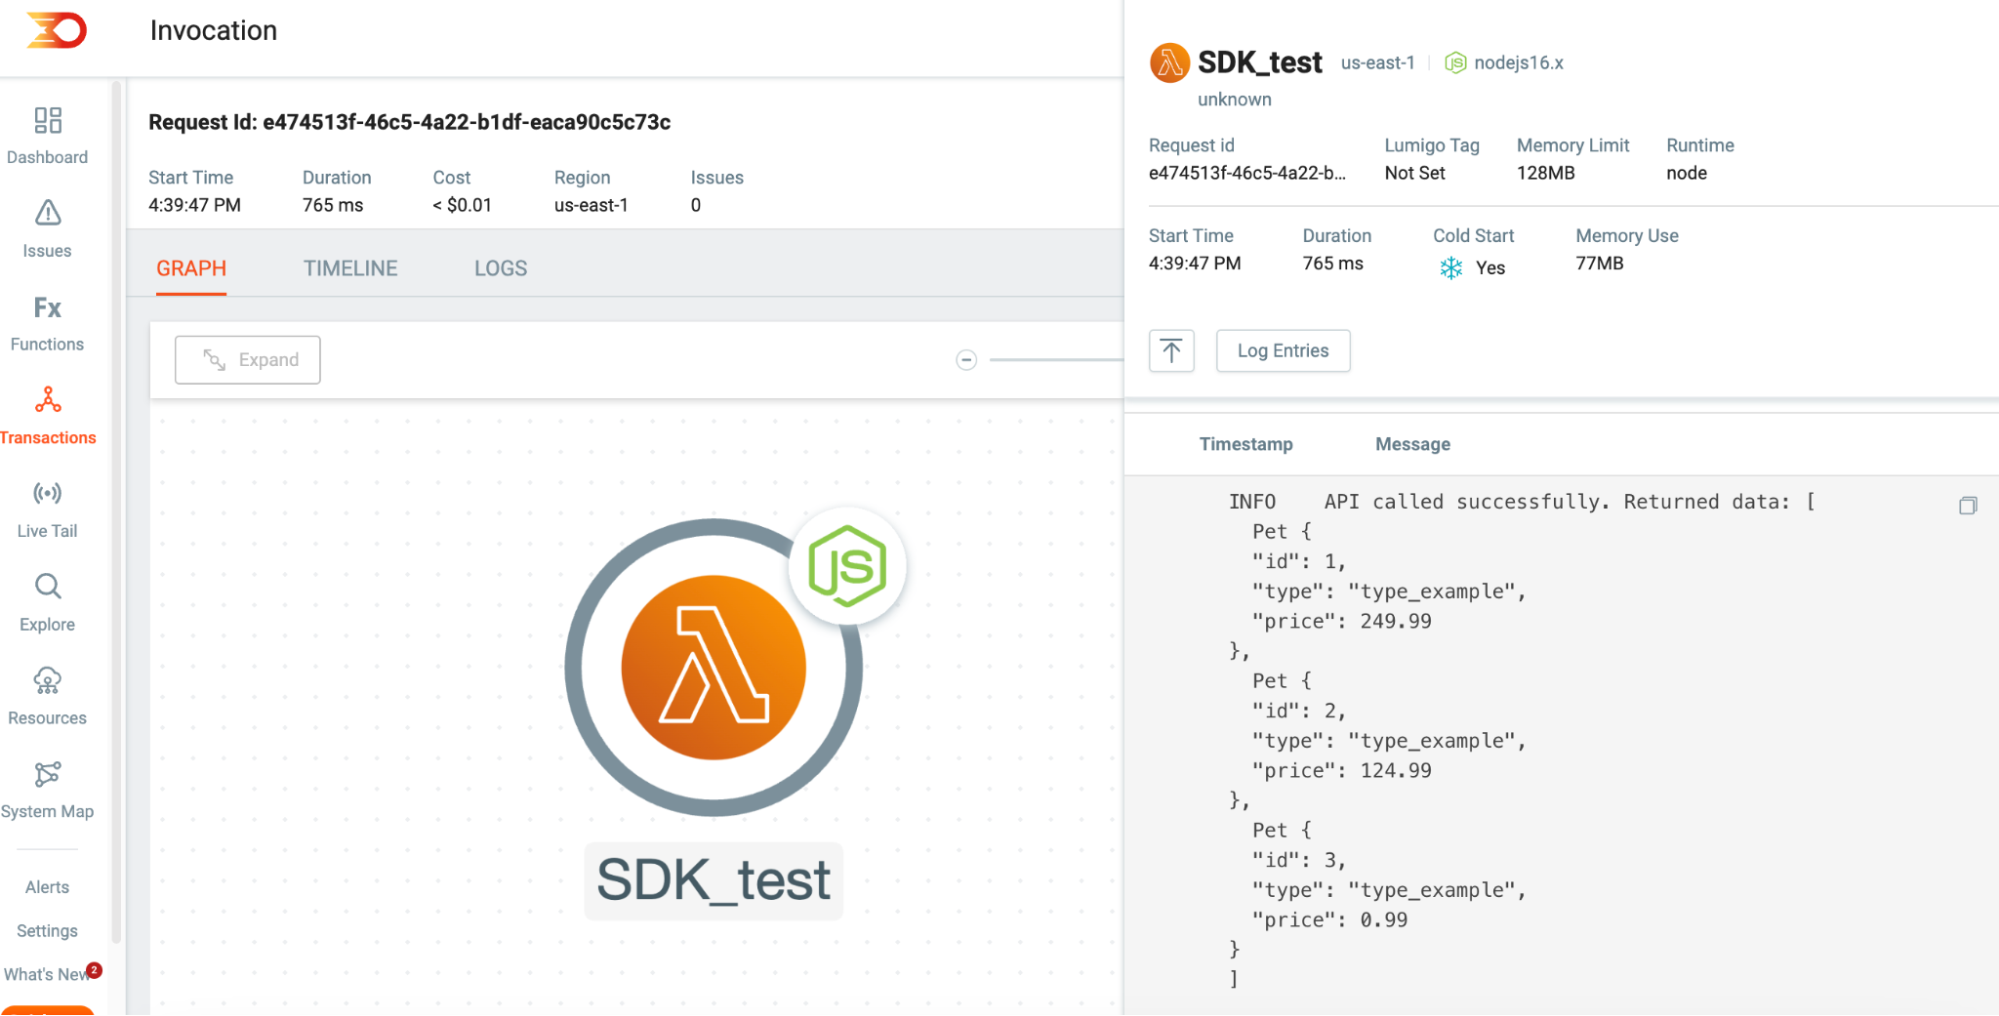
At this juncture, we find ourselves at a fascinating crossroads where we can delve into the intricate web of diverse SDK calls, each intricately linked to its counterpart API requests. What adds a dash of magic to this exploration is the inherent flexibility of this approach. It seamlessly allows us to pivot between the nuanced art of honing APIs and their associated resources, and the equally critical endeavor of crafting refined and well-structured SDKs.
This dynamic interplay between API and SDK realms opens up a realm of possibilities. It grants us the ability to navigate between the fine-tuning of API endpoints, refining data structures, and ensuring optimal resource management, and the equally crucial task of designing SDKs that are intuitive, functional, and in line with API and SDK needs.
Turbocharge Your API and SDKs
As we wrap up this trilogy saga into the world of API’s, we’re not just concluding a series – we’re embarking on a new era of API and SDK excellence. Throughout these posts, we’ve navigated the intricate pathways of API creation, SDK generation, and the art of vigilant monitoring. Now, it’s your turn to experience the change.
Imagine deploying an SDK with unwavering confidence, knowing it’s primed for optimal performance. But don’t just imagine it – live it. Try your hand at this journey. Sign up for a free Lumigo account and unleash the true potential of your APIs and their SDKs. With Lumigo’s observability expertise by your side, you’re not just stepping into a whole new world of troubleshooting; you’re stepping into a realm of unmatched debugging excellence.