


Building APIs using AWS Amplify
One of the things we love about working in the cloud is the ease and scalability it brings to application development. It enables us to build out applications, APIs and any infrastructure that is needed from prototyping an idea, through to self scaling deployments.
Monitoring and troubleshooting production-level serverless applications is always tricky, especially when working across a number of services and the many logs they can produce. Additionally, when building out consumable services like APIs, it’s always important to be looking at ways to optimize, to keep costs down as adoption increases.
Originally announced in 2018, AWS Amplify is a set of tools and services that enables applications to be built and deployed for scale. Amplify supports a number of commonly used web languages and frameworks such as JavaScript, React, Angular, Vue. It also supports integration options with mobile languages like iOS, and Android along with React Native and Flutter.
All great coding adventures begin with some prerequisites, so let’s look at what you will need to get started.
Setup and deploying
In this example, we will be creating a simple REST API and deploying it to AWS Amplify.
Creating an API via the Amplify command line (CLI) will automatically bring in a Lambda function to handle HTTP requests, and an AWS API Gateway resource to handle all resources.
Step 1 – Installing Amplify CLI
The first step is to install the Amplify CLI. If you already have it installed then you can skip ahead to step 2.
There’s a few ways to install the CLI depending on operating system and preference. One of the more common ways is to use the NPM package by running npm install -g @aws-amplify/cli command in your local console. See the AWS Amplify CLI documentation for other options.
Next we need to configure the newly installed Amplify CLI and connect it to your AWS account by running amplify configure. This will then redirect you to AWS and ask you to create a new IAM user.
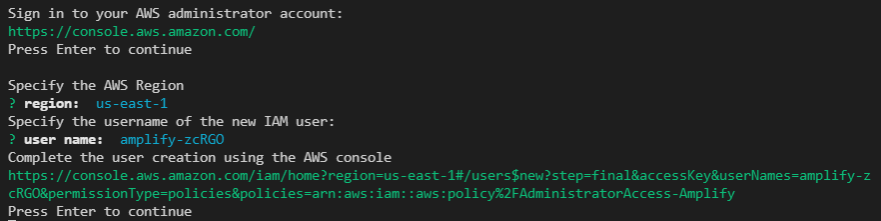
Select the Programmatic access as the access type and attach Administrator Access permission.
Once that’s been completed, you need to go back to the terminal and enter accessKeyId and secretAccessKey in your local console to finish configuration.
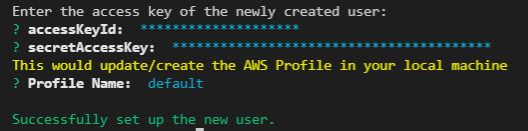
You should then see the success message which means you have now completed step 1! ????
Step 2 – Initializing and creating a REST API
Now we can get into the fun part. Let’s initialize a new backend application using the Amplify CLI by running the following command in your console: amplify init
Follow the prompts to provide the relevant configurations, and Amplify will automatically create all the necessary resources in your AWS account using AWS CloudFormation. Once completed you should see a folder named Amplify in your project root, which will contain all of the project configurations.
You can now use the amplify add api command to create a new API. It will ask for API type, lambda function name, path, runtime, and a few other configurations.
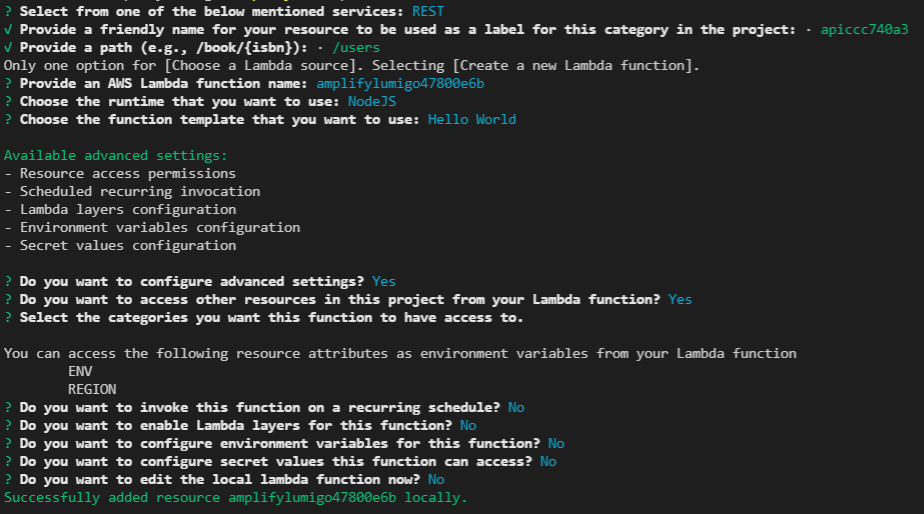
After completing the steps in the console, you should now see a new folder named backend in the amplify folder with your newly created API. You can customize the function as needed and push all of the changes to your AWS account using the amplify push command.
As part of the amplify push process, it will upload the configuration and create all the required resources in your AWS account. Once it is finished, take note of the REST API endpoint URL. We will need that later for testing.
Congratulations! ???? You have now successfully created an API using AWS Amplify CLI.
Now, let’s connect Lumigo to monitor this API and get some performance insights.
Integrating Lumigo to your AWS account
Lumigo is a specialized monitoring and debugging platform for serverless environments. It provides a 3-step easy integration and unique features to troubleshoot serverless applications.
In the above example, we used AWS Amplify to create an API using AWS Lambda and API Gateway. Lumigo allows monitoring the resources provisioned through AWS Amplify from a single dashboard. It also allows troubleshooting any issues that may occur when it is called.
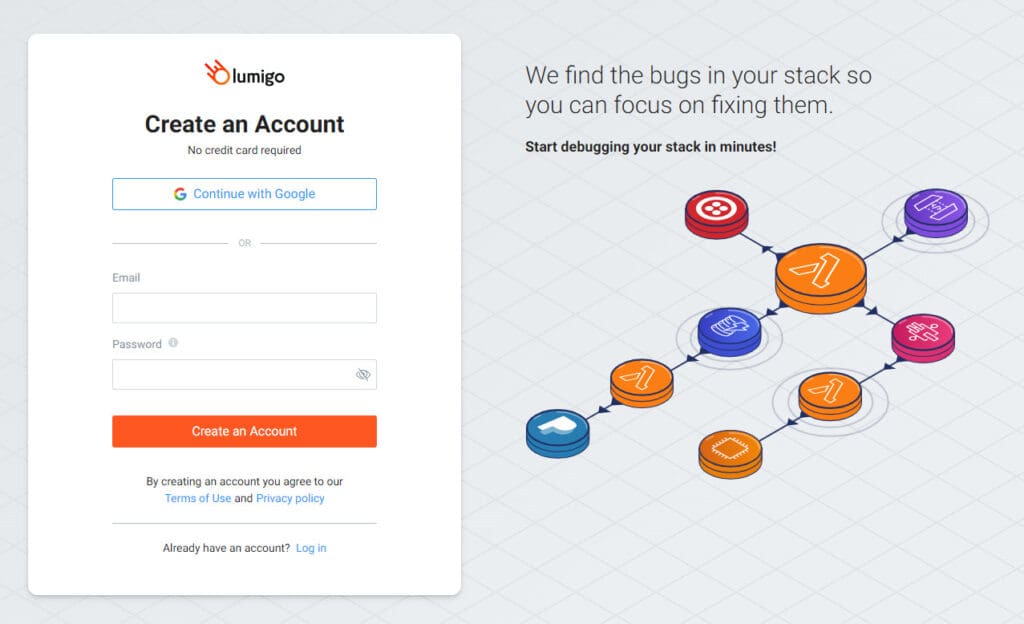
Step 1 – Creating a Lumigo account
Connecting Lumigo to your AWS account is quick and easy. First you need to head over to the Lumigo sign up page and create an account. You can either register with an Email and Password or use a Google account.
Step 2 – Connecting your AWS account
Next, you need to enter some basic account details and connect Lumigo to your AWS account. Lumigo will provide an AWS CloudFormation template to connect the AWS account.
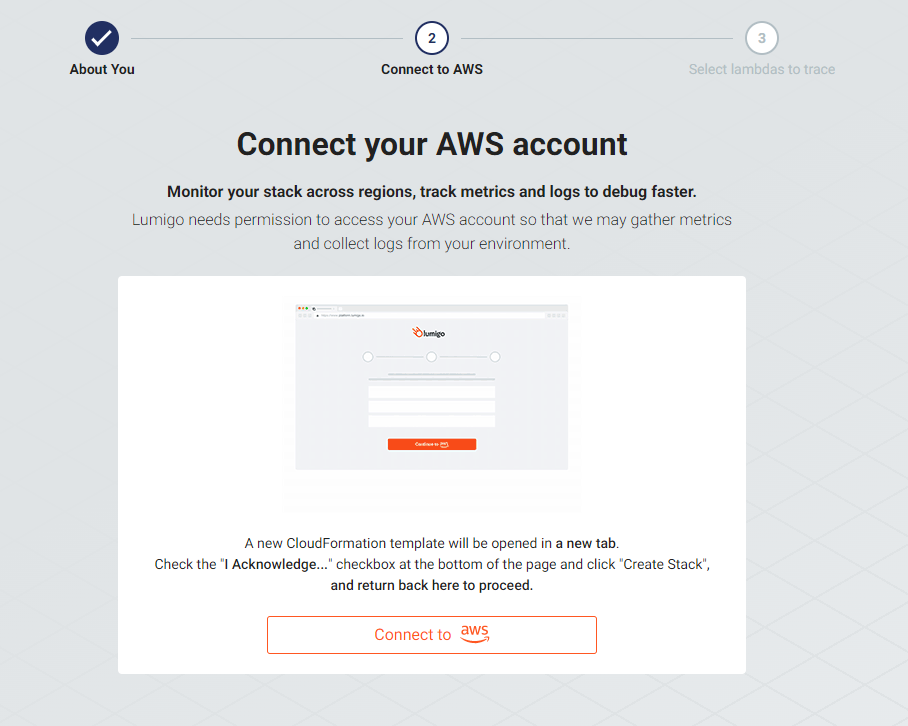
Click on the [Connect to AWS] button to start the connection process. This will initiate the process on your AWS account via CloudFormation.
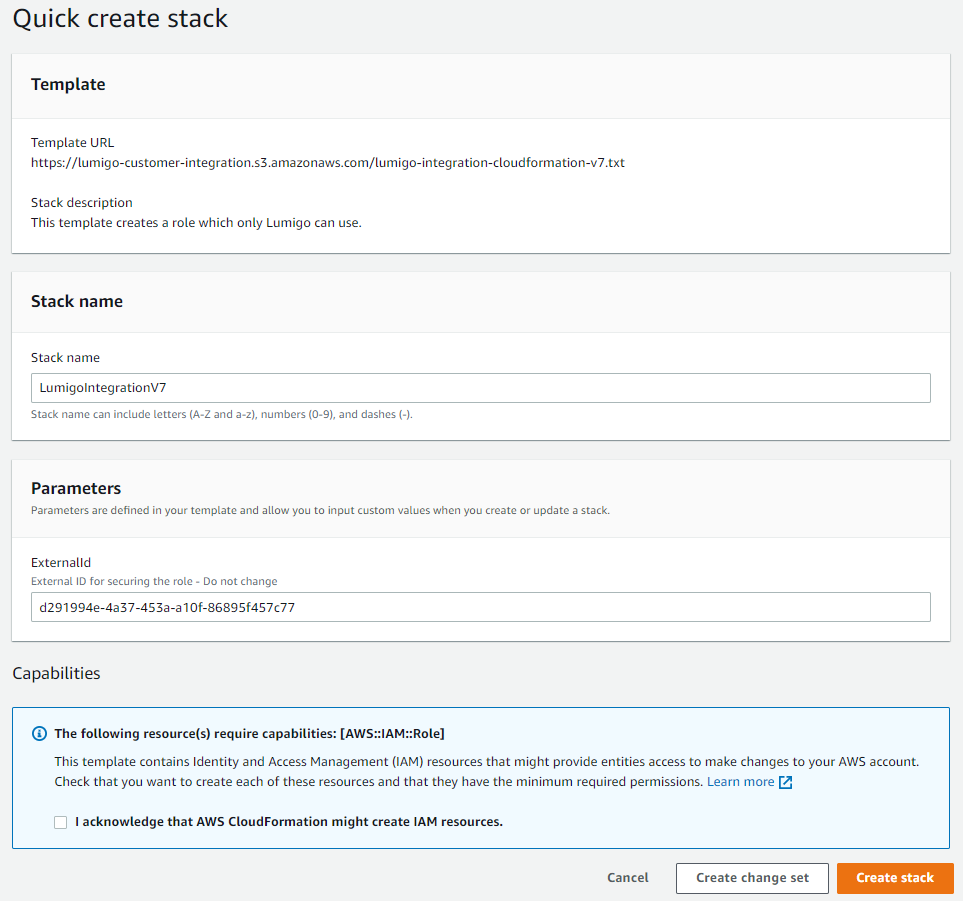
You can then define the stack name and parameters or use the default values as you prefer.
The configuration process will then automatically populate the fields to set up the connection. You can change the Stack name field if you have a certain naming convention. Then, when ready, tick the acknowledge box and click [Create stack] to continue.
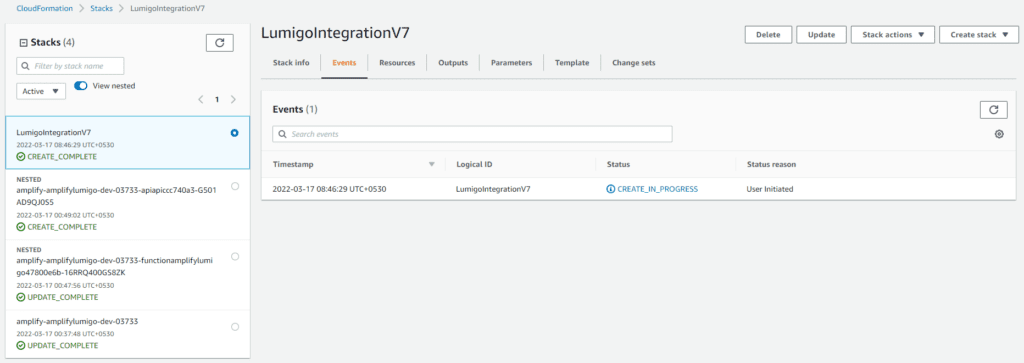
Then, wait until the stack is created, which will bridge the connection between Lumigo and your AWS account.
Step 3 – Enable tracing
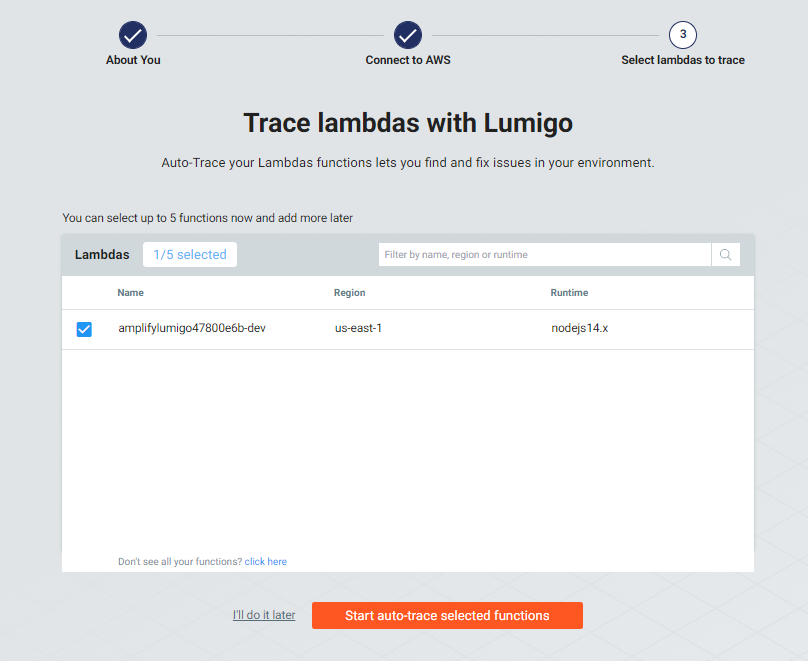
Enabling tracing is essential to get accurate data on your Lambda functions. The Lumigo wizard allows for the selection of specific Lambda functions you need to trace as the final step.
Here, we want to select the AWS Lambda function we created earlier to be traced.
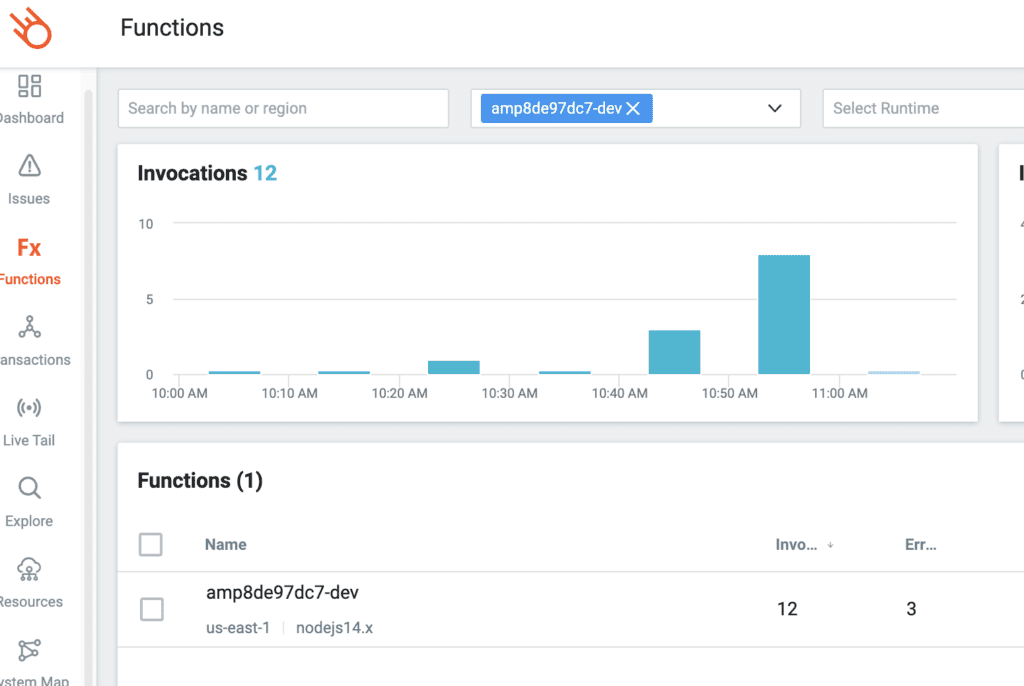
Step 4 – Exploring your AWS Amplify Lambda functions
Finally, you will be redirected to the Lumigo dashboard. There you can find various metrics and information on your Lambda functions. For example, you can select the AWS Lambda function created by Amplify from the Functions tab and monitor invocation details, failures, and function properties in a single UI.
To take that newly created API for a spin, we are going to need that API endpoint from above. Head back to your console, enter curl followed by your API endpoint from above, and add the path to the end.
For example: curl https://x78x4boiu9.execute-api.us-east-1.amazonaws.com/dev/users
Hit enter and you should see a Hello from Lambda! response returned.

Trigger a few endpoint calls, then switch back to the Lumigo dashboard and you should start seeing invocation metrics.
You have now successfully connected the Amplify API to Lumigo ????
How to troubleshoot with Lumigo
Now, let’s break the API and see how we can use Lumigo to debug your API. On the Lumigo dashboard hover over the API function name and a down arrow should appear, drop down the menu and click on [Go to AWS console].
![]()
A browser window will open and take you directly to the Lambda function code that we are going to edit to simulate an error.
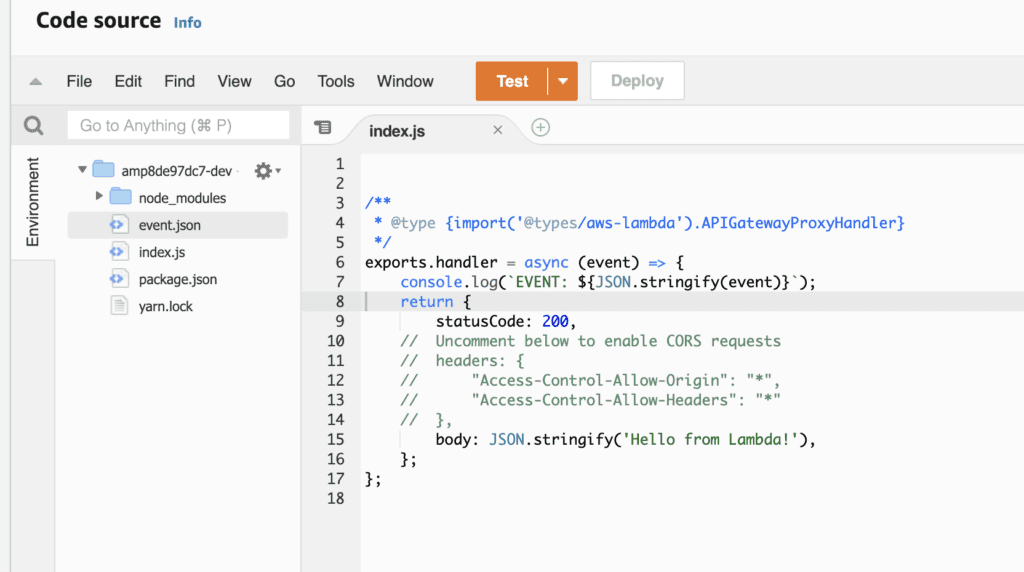
Update that code with the code below. This update is going to return an error if a POST request type is detected, all other responses will return the original response type we saw above.
/**

* @type {import('@types/aws-lambda').APIGatewayProxyHandler}

*/

exports.handler = async (event) => {

console.log(`EVENT: ${JSON.stringify(event)}`);
let requestMethod = event.httpMethod;
if (requestMethod == 'POST'){

var stat = 500;

var msgRes = 'Simulated Error';

}else{

var stat = 200;

var msgRes = 'Hello from Lambda!';

}
return {

statusCode: stat,

body: JSON.stringify(msgRes)

};

};
Click [Deploy] and wait for the code change to be deployed, Now we can do another curl call but this time by doing a POST request type using `curl -X POST` followed by your API endpoint.

You should start to see those errors appearing on the Lumigo dashboard that we can explore.
1. Issues and Alerts
Lumigo has a separate tab named Issues to log all of the issues within a specific time. It logs the error type, the number of occurrences, and when they occurred last.
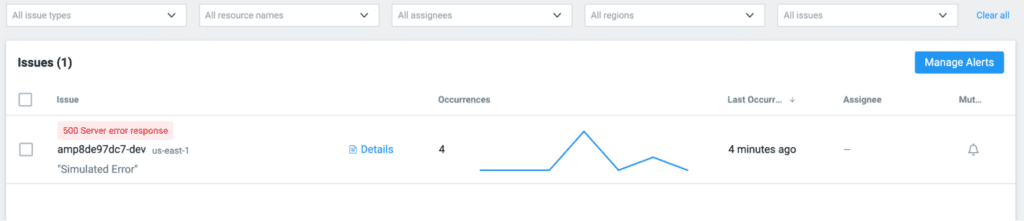
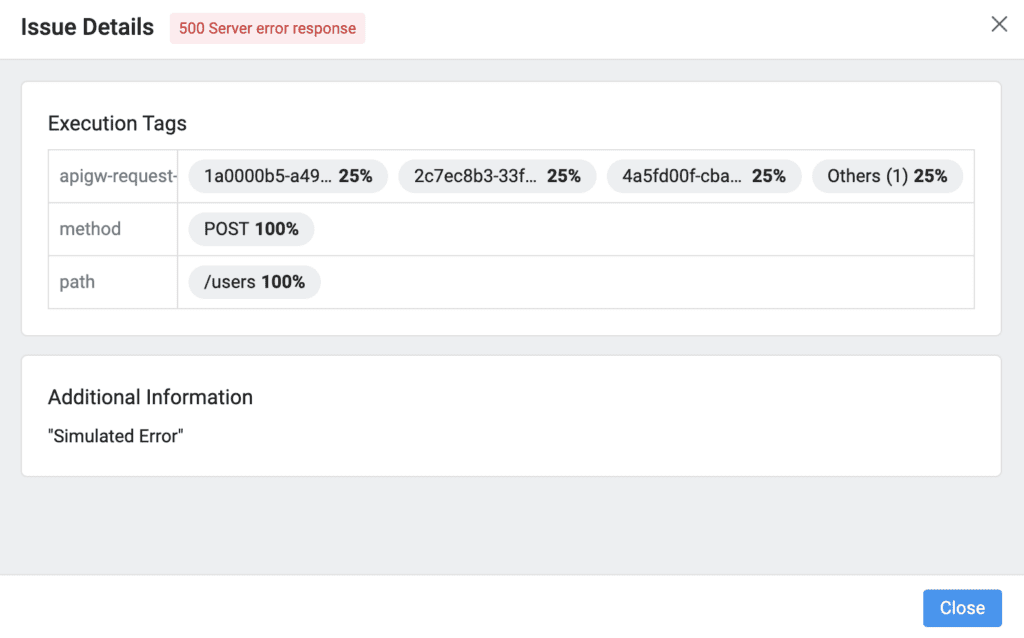
However, we need some more information than just the error type to understand the root cause. For that, you can click on the [Details] button, and it will provide you with a detailed description of the error.
In addition, you should also receive an email alert when the error occurs.
You can easily create alerts using Lumigo by clicking the [Manage Alerts] button. Lumigo supports email alerts for 7 AWS services, including Lambda, DynamoDB, SQS, Kinesis, API Gateway, and ECS.
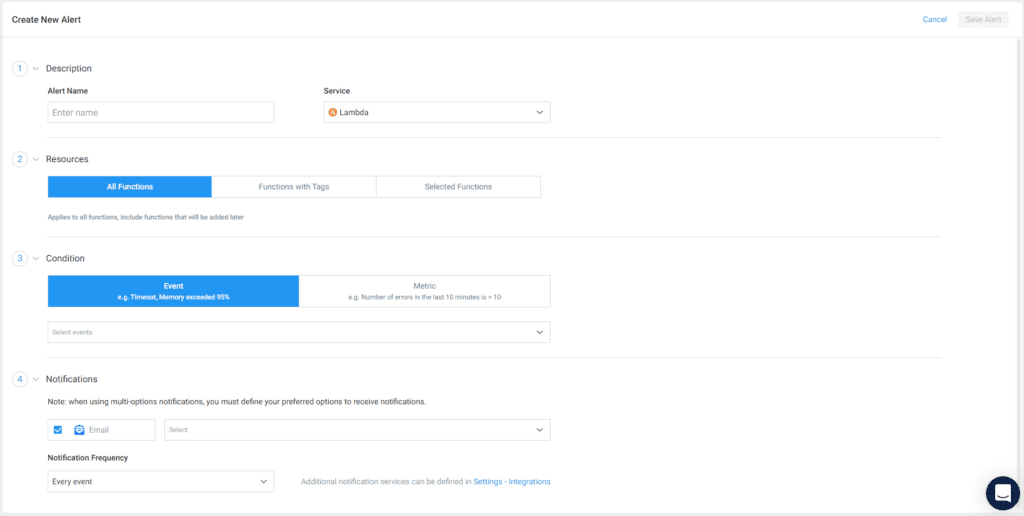
Lumigo also allows you to customize the alerts based on events and metrics like:
Any error

Timeouts

Out of memory

Function error

Memory usage

Cold starts

Throttling
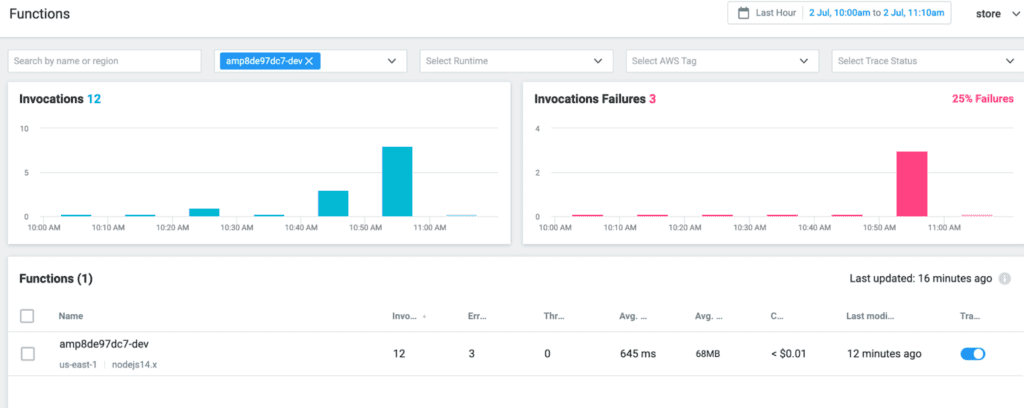
2. Functions
Lumigo provides a separate tab named Functions to monitor all of the Lambda functions. It includes a list of Lambda functions available alongside two bar graphs that show the total number of invocations and failed invocations within a defined period.
A Lambda function list shows the following details for each function:
Name

Number of invocations

Number of errors

Number of throttles

Average duration

Average memory usage

Cost
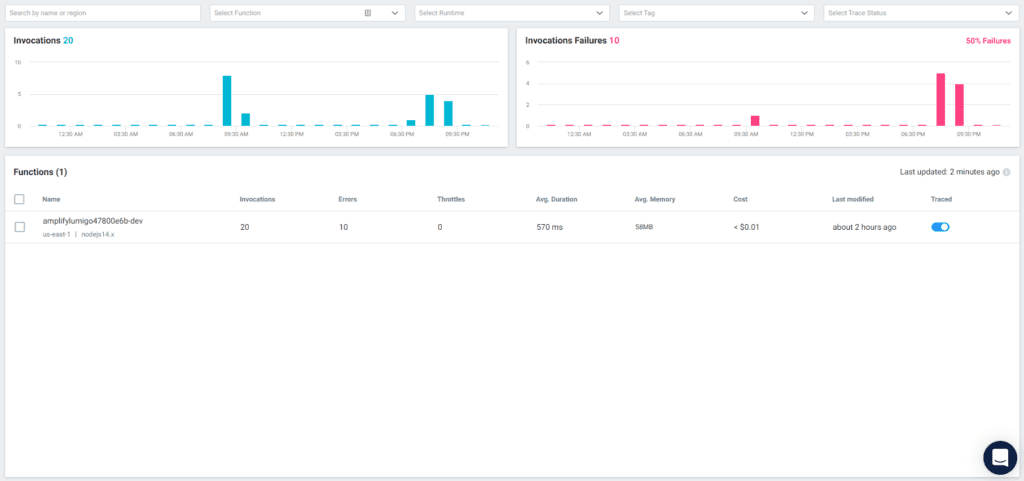
You can get a detailed view of each function by clicking on the function name. You will see a log of invocations with status, metrics about cold starts, consumed memory, function cost, etc. You can also see the deployment points in the graph as grey lines. Most importantly, we can use this tab to find the reasons for the errors.
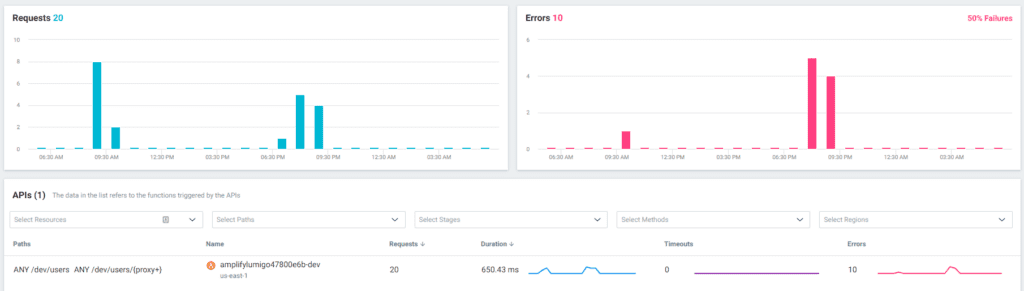
3. API Gateway
API Gateway is the entry point of our API. So it is essential to monitor the status of the API Gateway, and the Lumigo API Gateway tab provides a summarized view of all APIs in a single view.
It highlights the number of requests, duration, timeouts, and errors and allows direct navigation to the relevant Lambda function by clicking on the function name.
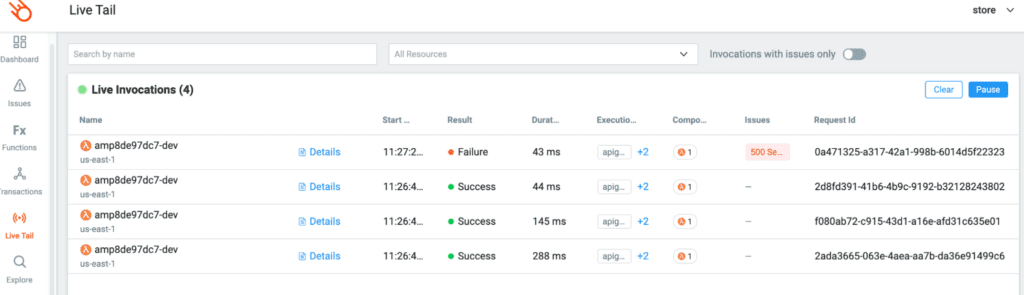
4. Live Tail
The Live Tail tab provides a real-time log of all the Lambda invocations. Although the logs are pretty similar to the Functions tab, Live Tail offers critical information to debug the application.
You can get more details about the invocation by clicking the [Details] button, and it will open a side tab with event details, environment variables, execution tags, and log entries.
Run a few curl calls again and you can start to see them appear in the chart. We can also use the Live Tail tab to troubleshoot the Amplify APIs.
5. Transaction View
The Transactions tab provides a detailed view of all the transactions of your application, including graphs, timeline, logs, and trace details. This centralized view allows finding logs and issues in a more developer-friendly way than when compared to AWS CloudWatch.
You can expand the transaction details by clicking on them, and it will open a new tab with 4 sections:
Transaction graph – These graphs visualize a single execution of an application flow.
Timeline View – This allows investigating performance issues, timeouts, cold starts, and asynchronous calls.
Logs – You can find all of the CloudWatch logs in this section.
Trace Details – This view provides 4 critical pieces of information, including the context of the interaction, result, performance issues, and configuration specifics for your resource.
Information provided in the Transaction tab is very useful when debugging. You can select an individual transaction and identify which service caused the failure. As you can see below, API Gateway worked fine, and the error was in the Lambda function.
![]()
Likewise, you can use timelines, graphs, and the logs provided in the Transaction tab to debug APIs easily.
6. System Map
System Map is another interesting feature of Lumigo. Although it does not provide much information about errors, it offers complete visualization of your application. For example, you can see how all the resources are connected and use filtering options to highlight resources with errors, high memory usage, invocations, etc.
One of my favorite features of using Lumigo to monitor and trace is also seeing the amount of resource and cost different invocations incur. This can be really useful to understand how functions and resources can be optimized particularly when scaling an application.
Remember to delete your Amplify application once you are finished playing with monitoring, debugging and traces.
I hope you have found this helpful. Thanks for reading!
# Happy debugging and monitoring