


In the grand tapestry of software engineering, our journey often winds through labyrinthine layers of application logic. Here, bugs play a compelling game of hide-and-seek, and features dance in an unpredictable ballet. During these instances of fervent exploration, we find ourselves longing for a reliable compass—a secret weapon—to help us decipher the riddles that lie ahead. Cue execution tags, our luminous lighthouse cutting through the dense fog of complexity.
Think of execution tags as our very own road signs in the complex highway system of our applications. These invaluable aids help us chart a course through our code, allowing us to identify specific functions causing hiccups, or pinpoint particular requests that are creating a bottleneck. With execution tags, our code’s behavior can be examined, dissected, and understood like never before.
Gone are the days of blindly chasing bugs around your codebase. With execution tags, debugging becomes a streamlined process, allowing us to navigate our application’s logic, dispel any confusion, and restore our code to its optimal condition. It’s like having a reliable GPS for our debugging journey.
Getting Started with Execution Tags for ECS
When it comes to ECS and containerized apps, these tags can be the lantern in the foggy night, guiding your containers safely home. But how do we ignite this lantern?
It starts with setting up your environment: a simple command such as `npm install @lumigo/tracer` for NodeJS or `pip install lumigo_tracer` for Python will ensure your app is equipped and ready to rock and roll. Furthermore, we’re excited to announce the availability of our new Java distribution. We’re also proud to offer integration support through the Open Telemetry project, find out more from the OpenTelemetry support docs.
Following the installation of Lumigo tracer, it’s time to chart your ECS journey using execution tags. After integrating Lumigo via your app’s package manager, it’s time to import the library and set some execution tags.
For most languages, It’s as easy as importing the lumigo_tracer module into your application and utilizing the `set_attribute()` function.
For example:
from opentelemetry.trace import get_current_span

get_current_span().set_attribute('lumigo.execution_tags.transaction_id', 'transaction_id')

get_current_span().set_attribute('lumigo.execution_tags.user_role', 'user_role')
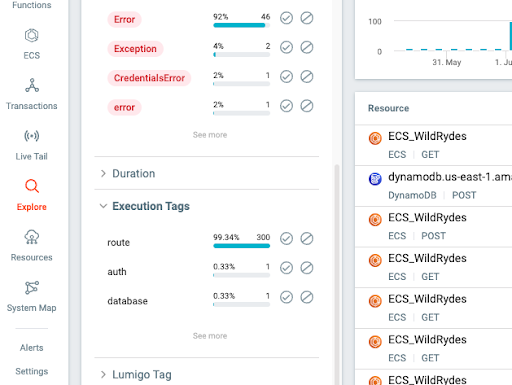
In this case, each ECS task processing a transaction will have the associated `transaction_id` and `user_role` tags. Like lighthouses in the fog, these tags help you navigate the sometimes murky waters of ECS-based applications, providing context, improving observability, and making your troubleshooting journey smoother and faster. These tags will then be part of the subsequent invocation surfaced within the lumigo dashboard. What’s really cool is that the execution tag can be filtered, via the explore page, to identify tagged invocations of interest.
See the Lumigo OpenTelemetry Python Distro for more information
Please take note of the following regarding naming limits and requirements for Execution Tags:
- Only traced functions or containers can have execution tags added to them.
- Each invocation has a maximum limit of 50 execution tags.
- The key length must fall within the range of 1 to 50 characters.
- Similarly, the value length should be between 1 and 70 characters.
Most important of all is to make sure that you set something that will be meaningful to debugging your application,
Using Execution Tags as Part of a Logic Flow
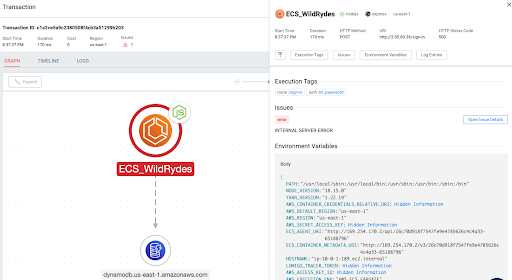
Let’s look at another example this time using the Lumigo NodeJs distribution in Typescript, using the WildRydes demo app from our AWS Workshop.
The demo application invokes the distribution, with the Lumigo tracer token being set as an environment variable on the deployment
import lumigo from "@lumigo/opentelemetry";
import { trace } from '@opentelemetry/api';
Then as part of the application logic flow we added an execution tag that specifically calls out a point of interest that we will want to investigate further. Below is a snippet taken from the demo app on rows 191 and 192, these will get called into action if an incorrect password is entered.
…
        trace.getActiveSpan()?.setAttribute('lumigo.execution_tags.auth','err_password');
        res.status(500).json({ error: 'Incorrect Password' });
…
Subsequently we use the same approach on line 131 – 136 which creates an execution tag with the key `database` and the value `err_adding`.
    } catch (err) {
      trace.getActiveSpan()?.setAttribute('lumigo.execution_tags.database','err_adding');
      console.error("Error adding item:", err);

      res.status(500).json({ error: 'Registration Error' });
    }
These tags are filterable from the explore page as an and/or switch as part of debugging exploration once they appear in the trace data within your lumigo instance.
Automagically Tracing Open Source Libraries
The Lumigo Python Distro stands ready to assist in an array of environments, offering compatibility with fan favorites such as botocore, fastapi, flask, pymongo, and pymysql. On the other hand, the Lumigo NodeJS Distro doesn’t shy away from popular libraries either, extending its support to Express and MongoDB.
The extent of support varies across libraries, reflecting the unique functionalities and capabilities of each one. For instance, with route-enabled libraries like Express, Lumigo equips you with execution tags that effortlessly reveal the route name, right off the bat.
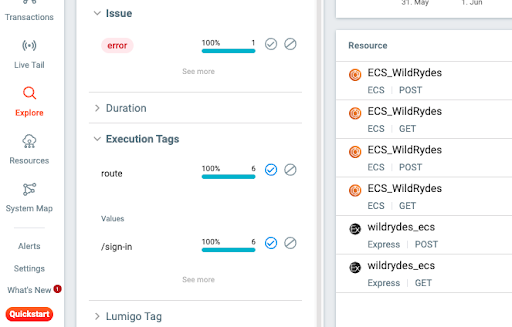
Having this additional trace data is akin to possessing a high-definition map when you’re navigating a bustling metropolis of code. With the route names readily accessible, you can trace the flow of requests more easily and spot irregularities quickly. It’s like having a spotlight illuminating the dark corners of your application where bugs might be skulking.
Not only does this speed up the debugging process, but it also helps ensure that you don’t overlook potential problems. This helps bring a new perspective, combined with the power of execution tags, meaning fewer head-scratching moments while in dev mode and more time spent crafting stellar code. Ultimately, it’s about making your life easier, helping you streamline your workflow and maximize productivity.
Steering Towards New Library Support with your Guidance
In our shared quest to distill simplicity from complexity, the power of execution tags is clear. Like a faithful co-pilot, they navigate us through the intricate interplay of application functions, lighting the way to streamlined debugging and efficient code tracking. It’s a secret weapon that, once harnessed, ensures we never look at troubleshooting in the same way again.
As we continue to chart this vast landscape of open source libraries, we invite you, fellow explorers, to join us in our journey. Is there a particular library that you believe would benefit from the Lumigo tracer’s touch? We’d love to hear from you. After all, the best exploration is a collaborative one. Together, let’s redefine the way we navigate through the rich, dynamic world of code execution and traceability. Share your thoughts with us, and let’s illuminate every nook and cranny of the ECS ecosystem.