


OpenTelemetry (OTel) should be at the heart of your observability strategy. There is no longer a need to pay for the collection of telemetry data; instead, use the unified OTel standard for all your telemetry data. Once you have the data in a standard form, you can choose where to process it, either on your own servers or via one of many SaaS providers.
OpenTelemetry Introduction
OpenTelemetry is an open-source toolkit that enables engineers to expose telemetry data from application components. The telemetry data typically consists of metrics, logs, and traces. As an open-source project, OpenTelemetry is vendor-agnostic and provides a comprehensive set of integrations to collect telemetry data from many different technologies, such as language runtimes, data stores, caches, message queues, etc. Expensive proprietary data collectors are no longer required.
Metrics – Provide quantitative data about the system’s performance and health, such as CPU usage, memory consumption, request rates, error rates, and latency. Metrics are typically collected at regular intervals and can help detect anomalies, track performance trends, and trigger alerts.
Logs – Time-stamped records of events that occur within an application or system. They can contain detailed information about specific events, errors, or states of the application. Logs are useful for post-mortem analysis, debugging, and auditing purposes.
Traces – Capture the flow of requests as they traverse through different services in a distributed system. They help identify performance bottlenecks, latencies, and dependencies between services. Spans are the building blocks of traces, representing individual units of work or operations within a trace. Each span contains metadata such as start and end times, status, attributes, and relationships to other spans.
OpenTelemetry only collects and makes available the data, it does not perform any backend processing of that data. However, being a ubiquitous standard, there is a wide choice of backends available to perform the required processing.
Benefits of Observability and Monitoring
Observability is the process of making telemetry data from an application component available. Monitoring is analyzing the telemetry data stream and looking for anomalies and/or out-of-band values.
Knowing how much CPU, memory, and I/O resources each application component uses enables engineers to correctly size cloud or physical server resources. Because of the lack of real usage data, there is a tendency to overprovision resources, which leads to higher operating costs than absolutely necessary.
Modern applications are incredibly complex and when they do not perform as expected, finding the source of the problem can be extremely challenging. While not offering a magic silver bullet, the detailed information provided by observability and monitoring significantly reduces the time taken to troubleshoot these issues.
Typical Architecture
 opentelemetry.io
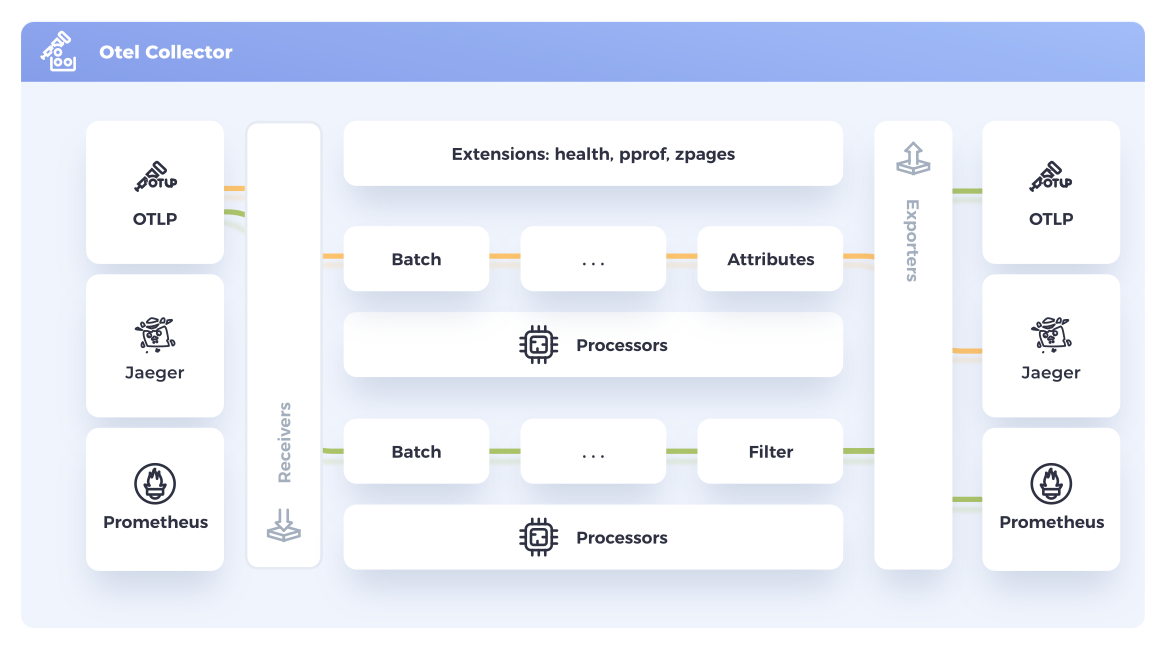
The core of OTel telemetry data gathering is the collector. It is responsible for receiving the data (metrics, logs and traces), optionally pre-processing it then finally sending it on to one or more backends for final processing and storage; typically the monitoring system. The use of a central collector makes it a relatively simple task to switch out monitoring backends with a configuration change.
Monitoring Options
OpenTelemetry Line Protocol (OTLP) is a widely adopted standard for receiving telemetry data; additionally, some vendors supply exporter plugins for the OTel collector. With just a small configuration change to the OTel collector it is easy to switch the send of telemetry data to Datadog, New Relic, Grafana, Lumigo, etc. This completely eliminates vendor lock-in and gives an organization total freedom to choose a backend vendor that best suits their needs. Alternatively, an organization may choose to run its own monitoring backend; however, this is a non-trivial task.
Observability Standard
OpenTelemetry is the standard to build observability data for all your application components. Instrument your applications once then use the data with the backend provider of your choice without getting locked in. Start sending your OTel data to Lumigo with a 14 day free trial, your engineers will thank you. At the end of the trial period Lumigo offers simple, easy-to-understand pricing bands to suit the size of your application environment. Even though it is easy to switch backends with OTel, we’re sure you will want to stay with Lumigo.