


This blog was written by Florian Schaeffler, Senior Software Engineer and Owner of Largun, a Lumigo partner.
I asked ChatGPT what a software development tool is and got the following response:
Software development tools help developers create and deploy software. Examples include code editors, IDEs, and version control systems. They make coding easier, debugging faster, and collaboration smoother.
While I agree with most, I’m missing the clear focus on software increments to improve software quality and achieve operational excellence.
We must understand our systems’ behavior clearly to enhance software quality through increments. This observability often happens via monitoring and data collection from different sources, e.g., logs, metrics, and traces. It’s possible to develop, operate, and maintain custom tools for observability, which takes effort, time, and money. The question is if we instead want an out-of-the-box solution for observability and tracing that takes away its complexity while still providing the needed insights. Let’s drill down into how Lumigo fits into all this and helps our software development process.
Note: While Lumigo supports a range of AWS services, this blog post focuses on Lumigo in the context of Serverless with an agile software development approach.
Development Phase 1: Basic Functionality
In this phase of the software development cycle, we make the functionality work. We might cut corners and set aside certain quality standards to get a workable proof of concept solution. Some might call this MVP (Minimum Viable Production). Development speed is the main driver.
It’s tempting to stop the development process after this first phase as we now have a working solution. However, stopping at this point will increase your technical debt and the risk of a premature EOL (End of Life) of your work. We need to observe the created software and systems to take the necessary steps to make them reliable. A software development tool like Lumigo gives us the observability required to plan the next steps.
Error Notifications
With default settings, Lumigo already sends notifications for errors. This happens via email to the account holder. It’s expected that in this development phase, more errors will occur. The critical aspect is to be aware of such errors to fix them.
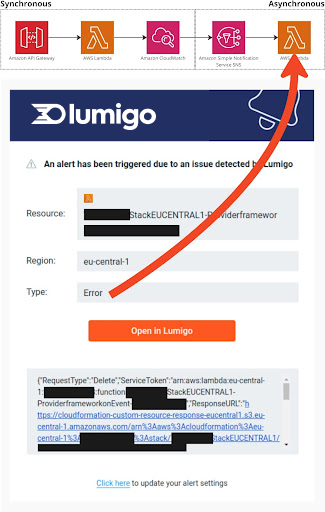
For functionality executed synchronously, we instantly get the result of a test. However, an error might happen after we finish our test when it comes to asynchronous processing.
Moreover, errors are getting even harder to spot if the asynchronous processing isn’t event-triggered but time-based – like, e.g., through a cron job.
The picture on the left shows an error in a system during the development phase. The use case of the service is an API that responds to the calling client and asynchronous processing of logs after a new log stream has been created. With the default settings, Lumigo notified me of an issue I was unaware of during my testing.
Debugging
Most IDEs (Integrated Development Environments) provide means to debug functionality we execute locally. However, when it comes to Serverless or when an application heavily relies on cloud services, the ordinary way of debugging isn’t easily achievable anymore. Logging with different log levels and granularity to a central logging system is needed to solve this. AWS helps us with the service CloudWatch for this requirement. Lumigo makes AWS CloudWatch logs easily accessible for software engineers, even if that person isn’t an AWS expert.
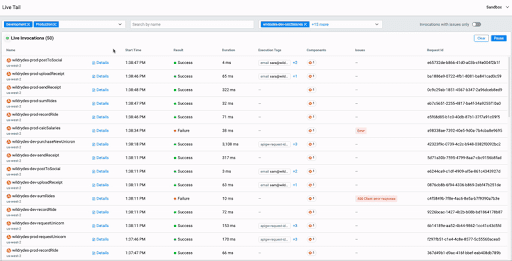
Debugging functionality that spans multiple services takes time because we need to find the correct logs and put them in order. With Lumigo’s Live Tail, you can have all incoming CloudWatch logs from different services in one log stream. For me, this is one of the most powerful tools for debugging as it gives me insights into how an application acts in one centralized view.
Infrastructure Setup
With Lumigo, we can easily set up a centralized logging infrastructure. After we run the setup steps that create a CloudFormat Stack in your AWS account, logs are getting transported to Lumigo. This way, we don’t need a configuration per AWS resource. The heavy lifting for the setup is all encapsulated in the functionality provided by Lumigo.
Development Phase 2: Reliability
Reduce System Map Complexity
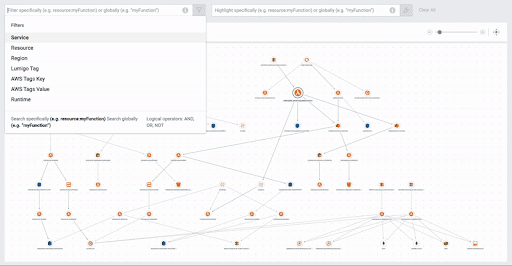
When looking at the system map, we don’t want to have any unused or overly complex constructs. We do this to keep our services focused on their defined needs. For example, during the development phase, we might need to test specific functionality quickly and forget about cleaning up those resources afterward. A system map gives us an overview of what resources we are using. We then can drop resources that aren’t needed anymore. Lumigo provides an auto-generated and filterable system map to support this process.
Development Phase 3: Optimization
In this development phase, we optimize multiple different aspects of the software. Those optimizations affect areas like, e.g. operational costs and user experience.
Price
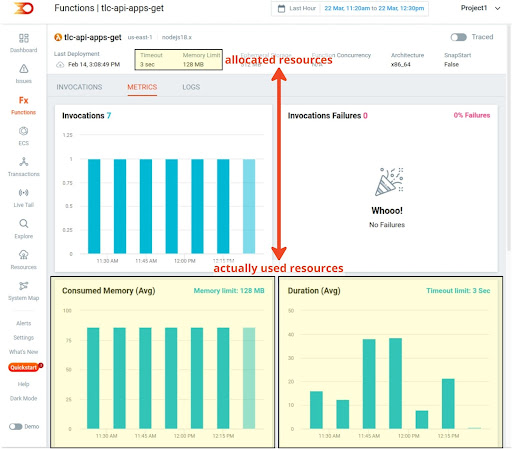
Usually, the more senior a software engineer is, the more that person puts already best practices for operational excellence into earlier development phases. However, some values that affect prices are estimations and need adjustments after load and stress testing. An excellent example in the context of Serverless is the allocation of RAM for a Lambda function. This value represents the maximum amount of RAM a Lambda function can consume. Together with the runtime, this makes up for the pricing of an execution.
In the context of Lambdas, we pay per Gigabyte-Seconds. Let’s assume we have a Lambda function with 2GB RAM allocated that is running for 3 seconds. This means we have to pay for 2GB x 3s = 6GB-s. Even if the execution of the Lambda function might have used only 1GB, we still need to pay for the 2GB as requested.
An engineer defines the amount of RAM required for the execution of a Lambda function based on estimates. With Lumigo, we can easily fine-tune the allocation of RAM for a Lambda function to its actual needs and thus can lower our operational costs.
Cold Starts
A cold start is a situation where a Serverless function needs some time to initialize itself. A cold start can happen when a Lambda function hasn’t been invoked for some time or we need to increase the concurrently running functions due to scaling. Too many cold starts in a software service make for a bad user experience. Therefore, we need to keep them to a bare minimum.
There are patterns to lower the rate of cold starts, e.g., invoking a Lambda function every 5 minutes with a dummy call. In this blog post, we won’t go into the implementation details. However, Lumigo already gives us metrics for the cold starts our Lambda functions experienced. Based on this data, we can decide which functions need optimization.
Tracing
When optimizing for faster loading times, lower latency, and better performance, we must understand where a system consumes the most time. Tracing helps us to get those detailed insights. When proper tracing is in place, each step of a service call is measured by how long it took to process the request. While this already gives a rough idea of the performance of one process segment, the real power of tracing comes to light when all process segments are combined into an execution map. In addition, having the execution map span over multiple services allows for an end-to-end view of where a request spent its execution time. With this data, we can find the sweet spots for where we gain the most from optimization.
To trace executions, we usually need to add functionality to our software which sends metrics to a centralized system. Multiple tracing segments get defined depending on how many tracing details we expect. Lumigo handles tracing differently by providing out-of-the-box functionality which lets a software engineer enable or disable tracing with a toggle button. With Lumigo, close to zero development effort is needed to set up tracing.
See it all live in Lumigo’s sandbox, or get started for free today.