


In this two post series, we are going to explore some ways to trace and debug NodeJS Lambda applications. Delving into some methods to look further into resources utilized to and some methods to optimize code.
AWS Lambda, an event-driven compute service first introduced roughly eight years ago, changed how we build out cloud applications as an industry. With support for a variety of commonly utilized programming languages like NodeJS, it brought new opportunities and ways to build our applications at a rapid scale.
Industry-wide adoption saw companies like T-Mobile adopt a serverless-first policy to develop their mission-critical platforms. They utilized the event-driven nature of AWS Lambda to create triggers for their database—S3 events—enabling them to scale up with demand effectively. Furthermore, their development speed increased by 90%, ensuring faster release times as they no longer had to maintain infrastructure.
Since AWS manages the end-to-end provisioning of resources for Lambda, no underlying server infrastructure is required or visible to developers. While the configuration for a Lambda function can be modified, performing traces and debugging on deployed functions can be problematic, particularly at scale.
Let’s take a look at some common ways to improve NodeJS Lambda function performance.
Optimizing NodeJS Library Use in Lambda Functions
As Dev/Ops, we build our applications with our end users in mind. Ensuring that they have a speedy and responsive application experience is integral to the application’s success. It’s equally important to make sure that the server side performance is up to the task at hand and not consuming more resources than it needs.
That’s why it’s critically important that our Lambda functions only call on the libraries and dependencies that they need to run. This is especially so when it comes to the AWS-SDK, which contains a lot of functionality that your Lambda function may not need but will load into memory.
Let’s take a look at an example using a basic NodeJS function that connects to a DynamoDB table called `lambda_test`.
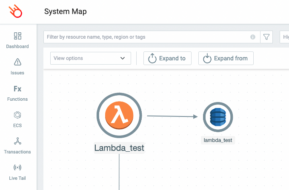
This is the code that we want to use for our test. It’s important to note that the whole AWS-SDK library is being called on but we are only using DynamoDB.
const AWS = require('aws-sdk');
exports.handler = async (event, context) => {
    const documentClient = new AWS.DynamoDB.DocumentClient();
    let responseBody = "";
    let statusCode = 0;
    const params = {
        TableName: "lambda_test"
    };
    try {
        const data = await documentClient.scan(params).promise();
        responseBody = JSON.stringify(data.Items);
        statusCode = 200;
    } catch (err) {
        responseBody = `Unable to get data: ${err}`;
        statusCode = 403;
    }
    const response = {
        statusCode: statusCode,
        headers: {
            "Content-Type": "application/json"
        },
        body: responseBody
    };
    return response;
};
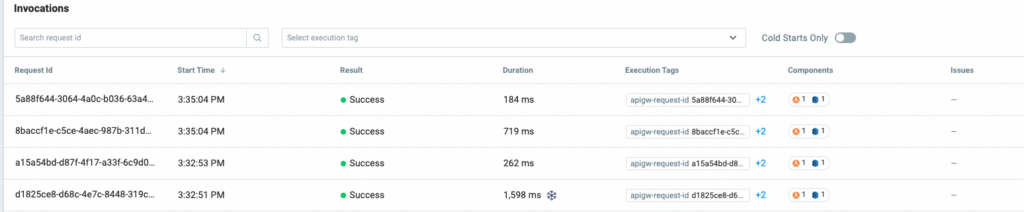
Checking on test invocations in the Lumigo dashboard, we can see that it does run, although it has some fairly high metrics.
Ideally, we only want to call in the relevant DynamoDB libraries because we only need that to run as part of this script. So instead of using `const AWS = require(‘aws-sdk’)` in our code to call on the whole SDK, we can just call the DynamoDB part of the library and save some time and resources.
By changing only two lines in the code snippet, we can improve the performance. Our new test code will look like this:
const AWS = require('aws-sdk/clients/dynamodb')

exports.handler = async (event, context) => {
const documentClient = new AWS;
let responseBody = "";
let statusCode = 0;
const params = {
TableName: "lambda_test"
};
try {
const data = await documentClient.scan(params).promise();
responseBody = JSON.stringify(data.Items);
statusCode = 200;
} catch (err) {
responseBody = `Unable to get data: ${err}`;
statusCode = 403;
}
const response = {
statusCode: statusCode,
headers: {
"Content-Type": "application/json"
},
body: responseBody
};
return response;
};
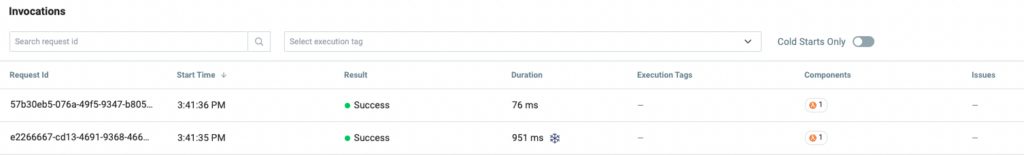
And now, if we take that for a spin to test out our changes we can see that even the cold start improved.
Memory Allocation to Lambda Functions
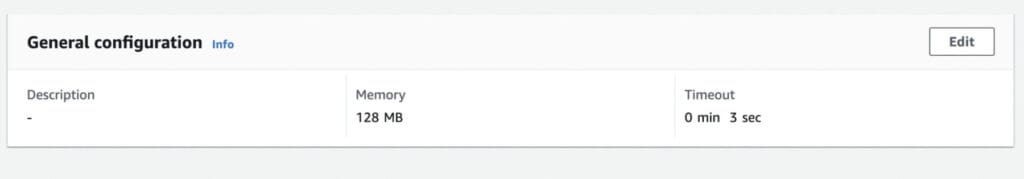
Another cause for Lambda latency happens with its memory configuration. By default, AWS assigns 128MB of memory to your Lambda function. However, since many developers go with the default configuration, its impact isn’t fully realized without further analyzing its impact on Lambda performance.
In Lambda there is a direct proportionality between memory allocation and CPU allocation. The less memory is allocated, the less CPU will be allocated to the Lambda function. With that approach, there is a clear impact on the code execution time, depending on the nature of the code and the Lambda memory configuration.
For example, if we allocate 128MB of memory for a code that demands high CPU, network, or memory, it will:
- Impact the execution time and cold start.
- Incur more cost, because Lambda cost is tied with the execution time.
- Occasionally timeout, resulting in costly retry operations.
AWS recommends allocating 128MB of memory for Lambda functions that don’t demand performance, such as those route events which may not be as critical to application performance.
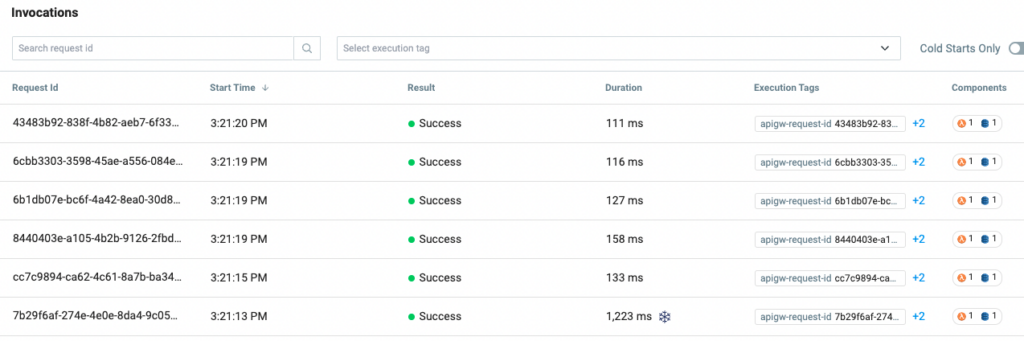
In our last test example above, we connected a Lambda function to DynamoDB and did a basic read and output operation. If we reuse that function we see what kind of performance can be achieved with different memory limits utilizing our Lumigo instance.
Baseline default of 128MB measured using the Lumigo Dashboard
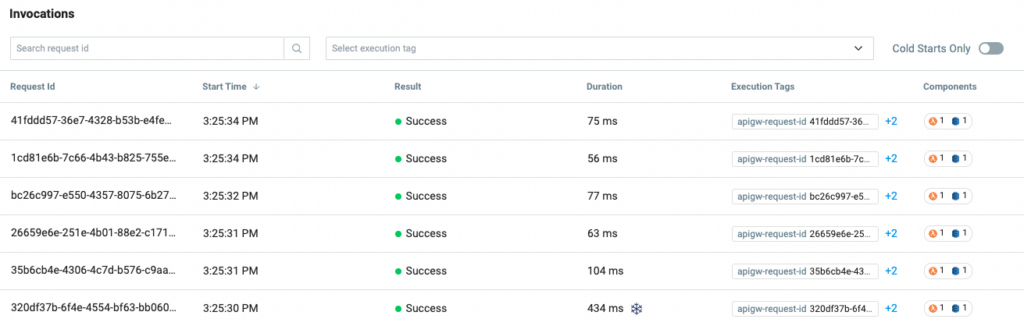
Setting the memory to 256MB measured using the Lumigo Dashboard
Setting the memory to 512MB measured using the Lumigo Dashboard
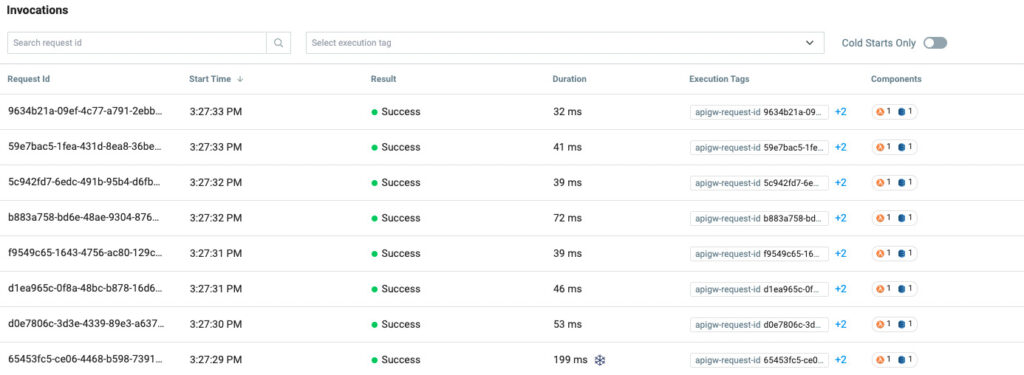
While the outcome is not overly surprising, increasing the engine size of anything will generally produce an amplified outcome. It demonstrates the performance gains to be had from increasing resource allocation. What this also highlights is the need to understand the importance the Lambda function plays as part of the holistic application and organization, versus the cost of invocation.
Service Integrations
Another method to speed up and refine NodeJS Lambda functions is looking at the execution time around service integrations. This is when a Lambda function needs to interact with additional services on AWS. Optimizing the way in which the services interact with an invocation helps provide faster execution times, reducing latency and increasing performance.
Here are some things to keep in mind when a function is integrated with services:
Timeouts on End Services
Amazon Cognito has a default timeout of 5 seconds with three retries for Lambdas. This can cause significant performance issues.
For example: when executing DynamoDB operations, it may exceed 5 seconds, and as database queries are asynchronous, the retry will not stop the previous database query. Therefore, the database query gets invoked more than once.
You may face this issue when using Cognito Lambda triggers. For instance, if you have multiple DynamoDB queries to store the user information in the database inside the Cognito user confirmation Lambda trigger, it’s likely to exceed the 5-second mark and fall back to retries. To fix it, you have to increase the default timeout of the Lambda function associated with Cognito.
Retry Limit
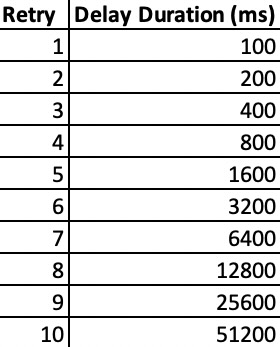
Configuring the retry limit is helpful when we use DynamoDB with AWS SDK. DynamoDB has a retry rate of 10 times with exponential backoff by default. Therefore, a Lambda could get delayed up to a noticeable latency of 5 seconds because of the exponential backoff. Thus, for applications that require minimal execution latency, they will use no retries for Lambda functions.
Additionally, Lambda functions seamlessly integrate with other AWS Services. For instance:
1. You can use the AWS API Gateway connected to Lambda to develop an end-to-end Serverless API. These Lambdas can communicate with databases to fetch data for client requests.
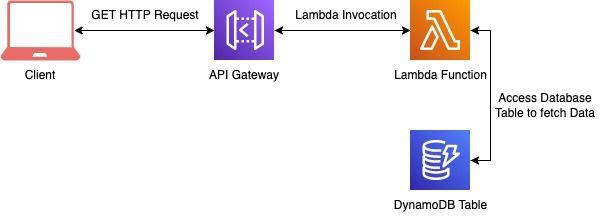
2. You can set up triggers in your database tables to perform actions when data is persisted or removed.

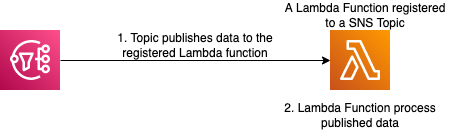
3. You can process data passed from SNS topics or Queues by setting up triggers to provide quick responses to requests.
The end services (such as DynamoDB) contribute to the overall execution time of the Lambda function. Here, the impact could vary from a few milliseconds to multiple depending on the query or scan operation we perform. Besides, there could be unexpected delays if DynamoDB runs into errors. It happens when AWS SDK retries the DynamoDB request for a default period of 10 times using the exponential backoff algorithm with an initial delay at 50ms.
However, services like API Gateway usually add a fixed latency to the Lambda function which usually goes for several milliseconds. By default, a Lambda function is set to time out at 3 seconds and can have a maximum of 29 seconds when integrated with the API Gateway.
This can cause the Lambda function to unnecessarily hang and create response delays of up to 4 seconds (in a warm invocation), or more than 15 seconds in cases of a cold invocation. These delays are noticeable if a user is waiting for the result and affect the overall user experience. For example, a recent page load benchmark by Google indicated that sites having page load times of up to 10 seconds have a bounce rate of over 123%.
One of the things I love when optimizing NodeJS is running comparative experiments using different configurations. Using the invocation timeline view we can trace and investigate performance to a whole other level.
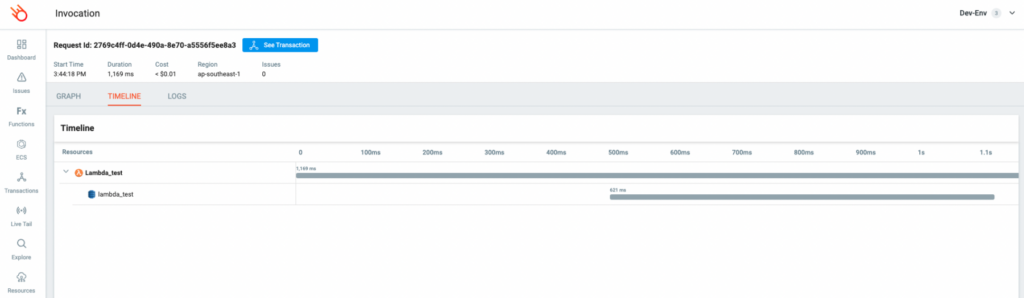
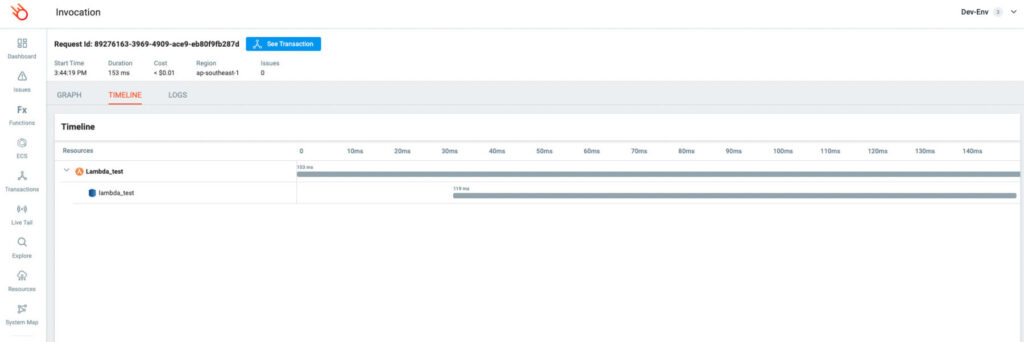
The below timelines show our Lambda demo function, running with 128MB of memory, being invoked along with the DynamoDB service. We can also look at this on a cold and warmed function invocation.
Lambda Function Cold Start Timeline
Warm Lambda Function Timeline
While this Lambda function flow is fairly simple, you can see how handy this would be with a more complex deployment—particularly when dealing with multiple service integrations on either side of a lambda function, or even chained or layered functions.
Check out part 2 of this post series
Visit Top Tips for NodeJS Tracing and Debugging on AWS Lambda (Part 2) to continue your NodeJS tracing, monitoring and debugging journey.
Between page loads, Sign up for Lumigo. It’s quick and easy to get set up and it can help gather some great insights into your NodeJS Lambda Functions.