Jun 07 2022

Today’s modern applications contain a broad set of microservices, with containers and serverless becoming the architectures of choice for many cloud applications. Both architectures facilitate highly scalable systems, and while which approach to take is routinely debated, containers and serverless technologies are being used in tandem more and more. However, despite their many benefits to enriching application development, using microservices adds new complexities that make gaining visibility and control an increasingly harder task.
This article focuses on understanding the observability issues in serverless and containers and how to address them in practice.
Microservices Evolution
The serverless movement is still gaining popularity, with 4 million developers and counting using cloud functions with services like AWS Lambda and Google Cloud Run, while containers continues to be rapidly adopted by companies looking to modernize their applications.
In the early days of serverless, AWS introduced running code on AWS Lambda, which made serverless mainstream. With the growing demand for serverless, AWS pushes its boundaries and expands its serverless offerings into many other areas such as Database as a Service (DaaS), Storage as a Service (STaas), and Container as a Service (CaaS), etc.
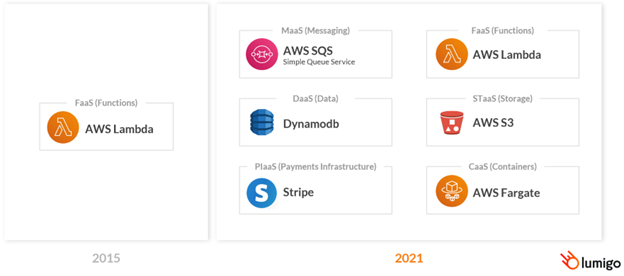
Serverless transactions and containerized applications are often a combination of owned code in Lambda or ECS, for example, cloud managed services like DynamoDB, SNS, SQS, and Kinesis, and third party APIs like Twilio and Stripe. While core components of applications are offloaded to these outside services making it easier and faster to build applications, these highly distributed environments are increasingly opaque, making them harder to control. Poor visibility prolongs any troubleshooting activities that have to take place when issues arise, so gaining a better insight into these services provides facilitates fast recovery time and minimal user end-user impact.
Application Monitoring
Monitoring is one aspect of application management that allows administrators and developers to track an applications’ health and performance, and helps to identify errors or other issues. Application monitoring comes down to collecting metrics and logs from your applications to monitor various aspects of an application. Collecting metrics can help users recognize patterns and trends, such as CPU usage spikes or a Lambda crash, but they don’t provide details on why a particular component isn’t working, how to fix it or even who should fix it.
Metric Mistakes
- Using only out-of-the-box metrics and not creating enough custom metrics such as tracking the average time spent on a specific function by a user. Unfortunately, this fundamental mistake makes issues within complex production deployments harder to investigate. The out-of-the-box metrics do not consider the application architecture and behavior such as CPU or memory utilization.
- Collecting metrics without placing them in the context of the application. Just looking at an application’s resource usage isn’t enough. We need to understand how every service or component is working together
- Too many alerts to respond to. It is essential to only trigger alerts for components relevant to the application or its context.
Application Monitoring Using Logs
Logs help to provide the much-needed contextual information regarding an event, such as why CPU usage spikes or why a Lambda crashed. This additional information allows administrators and developers to effectively narrow down to the root cause of the issues.
It is important to note that developers need to add these logs into the application code to be available later . The developer must identify the necessary components to generate logs during the design and development stages.
Since logs are textual, humans can easily read and understand what they mean. However, when at scale, logs overwhelm users and eventually lose their value.
Best Practices When Using Logs
Follow a standard logging format. Ensure that the applications follow structured logging such as JSON and always include additional metadata that’ll help identify the context of the log, such as the environment, user ID, and other fields. The easiest way of doing this is to use an automated logger or a logging library across all teams and the applications they build, thus ensuring uniformity amongst the logs.
Always try to minimize the number of logs when the application runs normally. However, make sure that there is an option to turn on additional logging when the application is malfunctioning.
Distributed Tracing in the Cloud
End-to-end observability and easy, effective debugging is critical for fast development and high performing applications, but is next to impossible for many companies to achieve with monitoring and logging alone. These traditional methods, which only give visibility into the working state of specific components, are no longer enough to serve the complexities of cloud native architectures. But where they fail, distributed tracing can help.
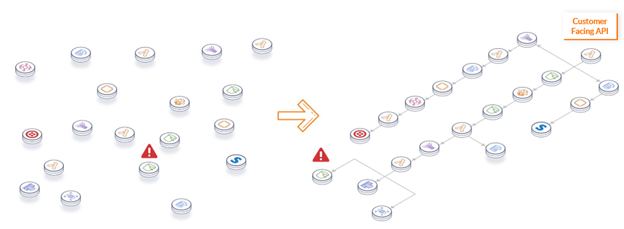
With distributed tracing, we observe a request or transaction as it moves through its workflow via a unique identifier to give us a better understanding of how services and resources are interacting in the larger context of the application.
Agentless Observability On the Cloud
Traditional monitoring relies heavily on agents to extract telemetry data, and this method worked well when developers coded and controlled applications in their entirety. In today’s cloud native environments however, many core components are offloaded to managed and third party services where agents can’t be installed. Sticking to an agent-based approach creates gaps in the data collection process and incomplete visibility.
Distributed tracing removes the need for agents and correlates all the metrics and logs from managed services into a structured format, allowing developers to quickly drill down and identify the root cause of an issue.
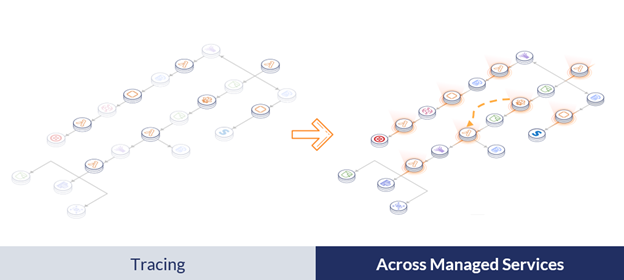
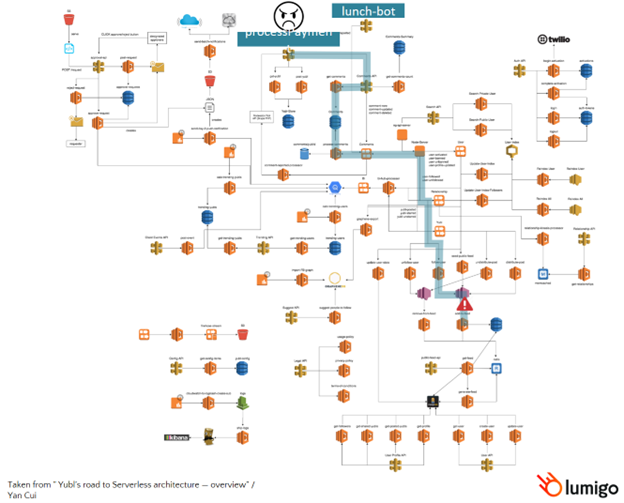
To identify the severity of the failing element, users must consider the dependencies and the externally exposed services this component provides. For example, a single Lambda may serve two different services, such as in the example below.
Components of Distributed Tracing
There are three main components of implementing distributed tracing:
- Generate the traces – Generating the traces from wherever code is running within the application
- Ingest and correlate – Ingesting these traces in a centralized location and attempting to correlate between these traces to build the full context
- Consume – Visualizing this data to make it user friendly
Distributed Tracing Solutions
Three main types of solutions are available in the market that enables the implementation of distributed tracing within an application:
- Cloud Vendor – Solutions like AWS X-Ray or CloudWatch are offered by public cloud vendors and are can be suitable for development of less complex architectures as they typically don’t support advanced options.
- DIY / Open Source – Available as an open-source distribution but require specialized knowledge and time to implement. These are suitable for companies that value building their solutions to reduce costs.
- Third-Party Platforms – Available for purchase and designed specifically for easy deployment of distributed tracing and bring in more advanced capabilities with dedicated support teams.
Building a DIY / Open Source Solution
The basics of setting up a DIY distributed tracing solution boil down into the following components:
- Tracer Side – Tracer Side is similar to the client side of an application, where the developers configure all the required traces within the application.
- Ingestion Mechanism- This is the centralized collection mechanism capable of managing all the data
Tracer
The first steps to setting up a tracer are to:
- Instrument your code to collect the required data from every call and response in each of your libraries
- Add relevant context to each span to allow you to see the connection between the different parts of your architecture
- Assign a unique ID to each transaction or request which is passed through every service in the workflow.
- Send all the traces to one place for correlation and visualization. It should be noted that this is all happening inside your application code, so make sure that latency isn’t increasing because you’re sending a lot of information out to one place at one time.
Ingestion
The ingestion mechanism requires a highly scalable and redundant architecture to keep up with the inherent scalability of a microservice application. As an application scales, so does the number of traces–and the need to quickly ingest, correlate and visualize observability data in real-time.
Open Source Solutions for Distributed Tracing
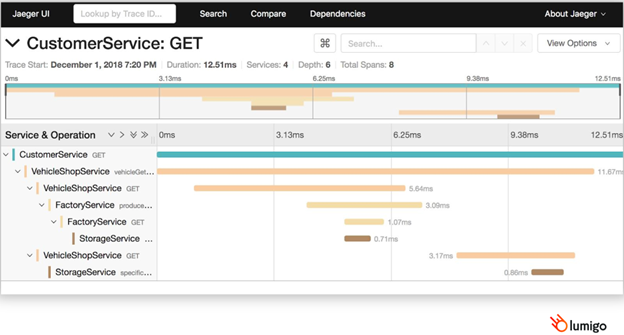
Many open-source solutions in the market provide comprehensive traceability. One well-known solution is OpenTelemetry, which contains tools and libraries that provide extensive trace collection capabilities. Another solution is Jaeger, which offers centralized visualization capabilities for distributed tracing.
Third Party Platforms
Open source tools provide a way to build your own traceability solution, however, these solutions lack some of the more advanced features that third-party observability platforms offer out-of-the-box.
These platforms simplify visualization by providing intuitive system maps that show the relationships between the different components and services within an application rather than just providing timelines of transaction executions. It enables developers to make changes to the architecture without worrying about unknown or unexpected dependencies.
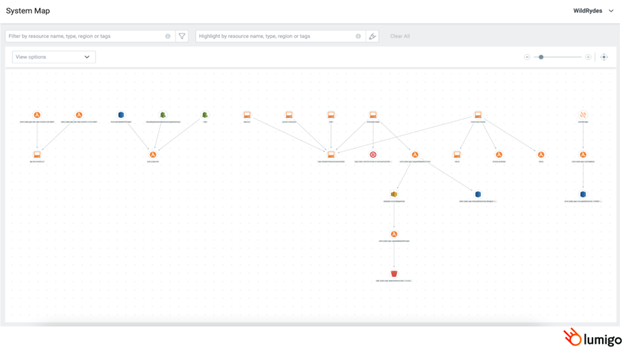
These advanced platforms outperform their open source counterparts by enabling automated distributed tracing of each component, and some can even trace the various requests and responses made to managed services such as DynamoDB.
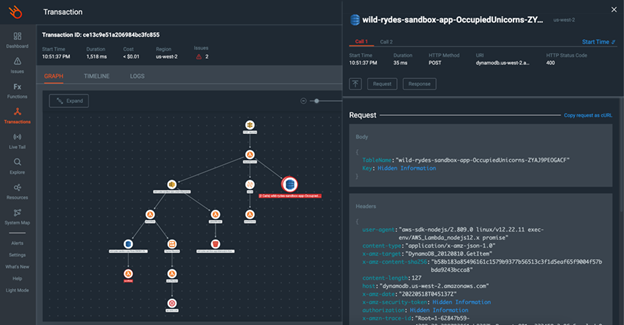
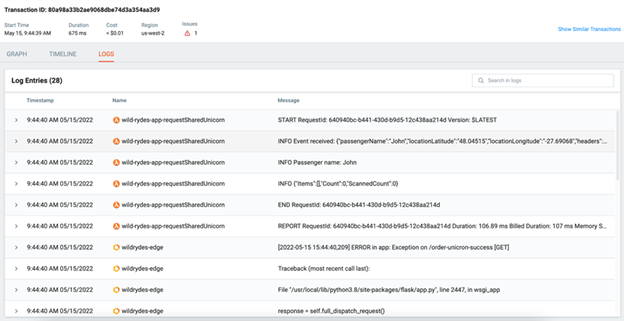
This tracing level enables a user to minimize log requirements, as traces contain most of the information that typically comes from logs so even if the configured logs do not show the required information, traces can fill in the gaps to provide context to each transaction.
In addition to these advanced features, these platforms perform core functionalities such as visualizing timelines and collecting logs and metrics. The added advantage of using tracing over traditional log collection is that the users don’t need to look for specific logs related to a transaction since the unique identifiers help narrow down the logs for each particular transaction.
Best Practices for Distributed Tracing
It is practically impossible to conduct tracing manually for applications with hundreds or thousands of transactions each minute. Therefore, the only way of conducting effective tracing is by automating these processes from day one to make them effective and efficient.
While automating these functions, it is crucial to collect traces from all the components within the application since missing any components in the transaction flow will hinder the view of each transaction.
Finally, correlation logs and metrics will provide more context and information about each transaction, which is key to having a complete tracing solution.
Main Takeaways
It is essential to understand that there is no restriction on using containers over serverless. However, designing architecture while keeping in mind the desired application functionality will reduce most of the issues within cloud-native applications.
Upon finalizing the architecture for a cloud-native application with distributed environments, the architecture must include appropriately distributed tracing. While this is achievable in different ways, choosing the suitable method for an application can help increase efficiency and reduce the time taken to troubleshoot.

