


Java has long been a foundational pillar in application development, its versatility and robustness serving as key drivers behind its widespread adoption. Since its inception, Java has evolved to meet the ever-changing demands of scalable deployments, offering a reliable platform for creating everything from web applications to complex, server-side systems. Its platform-independent nature and strong security emphasis have made it well-suited for building scalable applications in diverse environments and has been adaptable across the evolving state of application and system development.
However, as applications grow in complexity and scale, significant challenges exist in maintaining performance and identifying issues. The intricate interactions within modern, distributed applications can obscure the root causes of problems, making efficient troubleshooting a daunting task. This is where the integration of observability tools like OpenTelemetry comes into play, offering a pathway to gain deep insights into application behavior and performance, thereby simplifying the task of pinpointing issues in Java-based applications.
Before we get into a hands-on practical code demo, let’s briefly review OpenTelemetry and how it can help.
Exploring OpenTelemetry
OpenTelemetry is a robust and all-encompassing framework that simplifies the collection and distribution of traces and metrics from your deployed applications. It comprises several useful tools such as APIs, libraries, agents, and instrumentation, all built to integrate seamlessly with each other. This unified ecosystem for telemetry data empowers you to monitor, debug, and optimize your applications with greater effectiveness, even when dealing with multiple components across distributed architecture.
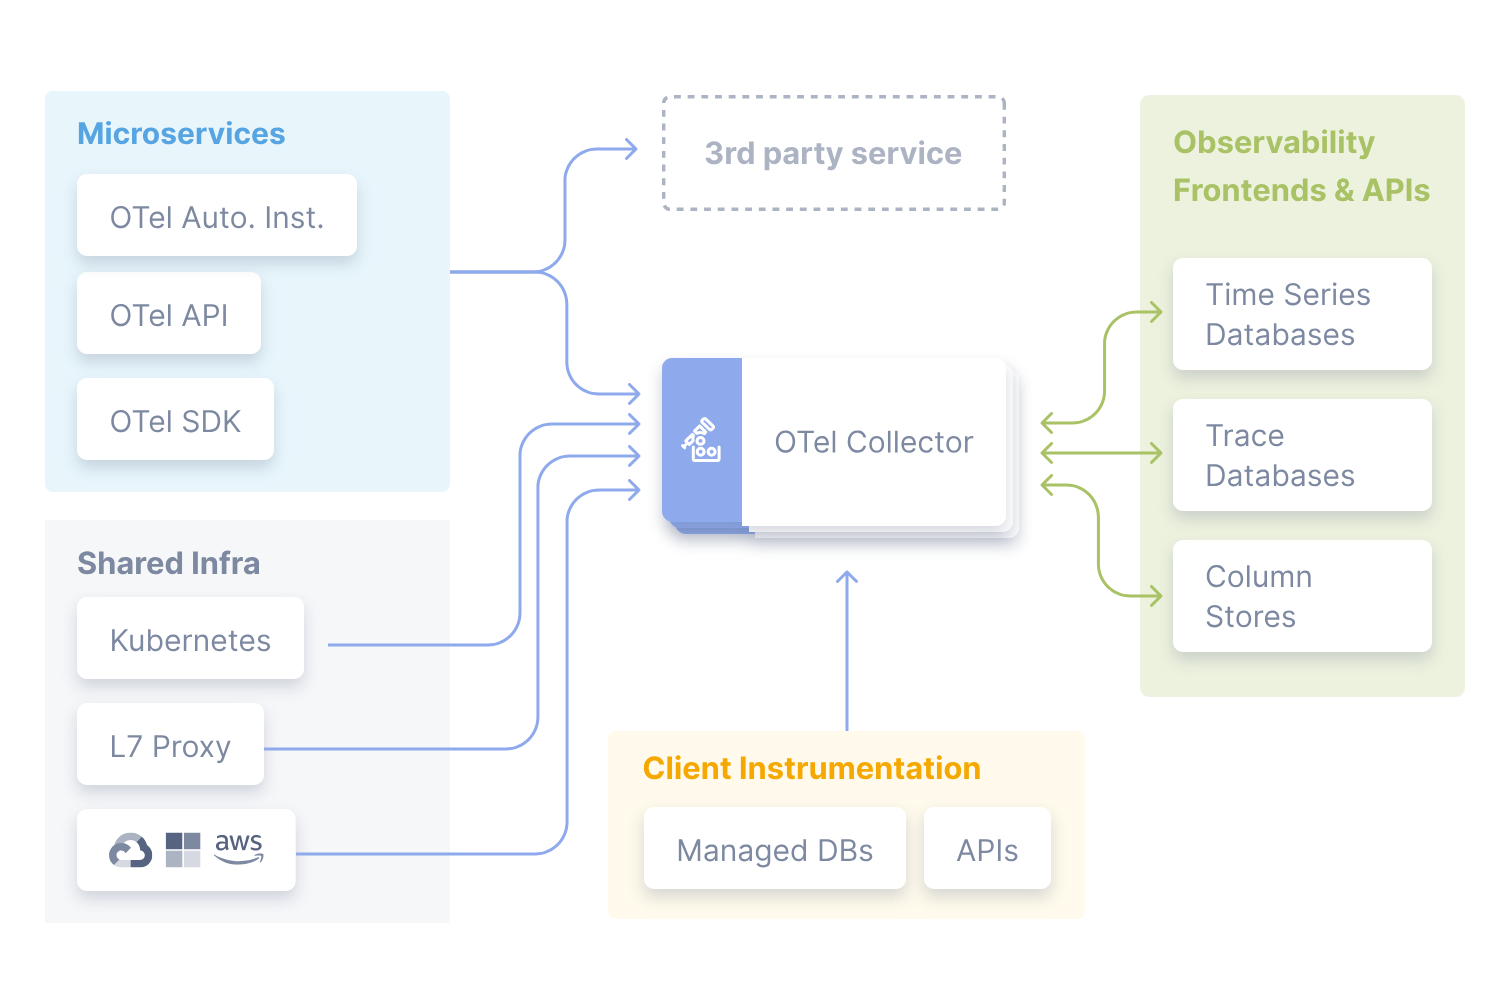
At its core, OpenTelemetry enables the collection of rich, detailed insights into the performance and health of applications. It supports various programming languages and frameworks, making it a versatile choice when working across different platforms. By providing detailed traces and metrics, OpenTelemetry allows for the tracing of the path of requests through applications to better understand dependencies and pinpoint performance bottlenecks.
One of OpenTelemetry’s key features is its protocol, the OpenTelemetry Protocol (OTLP). OTLP is designed for high performance and scalability, facilitating the efficient transmission of telemetry data between the application and the backend analytics platform. This protocol is a cornerstone for any project aiming to build and deploy highly scalable applications, as it ensures that the overhead of instrumentation is minimal while providing maximum insight.
A Minimal Working Java Demo Using the OpenTelemetry OTLP
Let’s put theory into practice by creating a minimal Java application that utilizes OpenTelemetry with the OTLP exporter. This demo will guide you through setting up OpenTelemetry in a Java application to collect traces, using as minimal code as possible, and send them to an observability backend that supports OTLP.
First, you are going to need a few pre-requisites:
- Java installed in your development environment
- Maven installed in your dev environment
- Sign up for Lumigo and retrieve your Lumigo Token
Hint: Your Lumigo token can be found in settings > tracing
First, create a new directory for your project and navigate into it:
mkdir java-opentelemetry-demo && cd java-opentelemetry-demo
Initialize a new Maven project, which can be done by creating a `pom.xml` file in your project directory with the following content:
<project xmlns="http://maven.apache.org/POM/4.0.0"
         xmlns:xsi="http://www.w3.org/2001/XMLSchema-instance"
         xsi:schemaLocation="http://maven.apache.org/POM/4.0.0 http://maven.apache.org/xsd/maven-4.0.0.xsd">
    <modelVersion>4.0.0</modelVersion>

    <groupId>com.example</groupId>
    <artifactId>java-opentelemetry-demo</artifactId>
    <version>1.0-SNAPSHOT</version>

    <dependencies>
        <dependency>
            <groupId>io.opentelemetry</groupId>
            <artifactId>opentelemetry-api</artifactId>
            <version>1.36.0</version>
        </dependency>
        <dependency>
            <groupId>io.opentelemetry</groupId>
            <artifactId>opentelemetry-sdk</artifactId>
            <version>1.36.0</version>
        </dependency>
        <dependency>
            <groupId>io.opentelemetry</groupId>
            <artifactId>opentelemetry-exporter-otlp</artifactId>
            <version>1.36.0</version>
        </dependency>
    </dependencies>
</project>
Now, create a Java file named App.java in the src/main/java/com/example directory of your project (you might need to create the directories if they don’t exist), and copy the following code:
package com.example;


import io.opentelemetry.api.GlobalOpenTelemetry;

import io.opentelemetry.api.trace.Span;

import io.opentelemetry.api.trace.Tracer;

import io.opentelemetry.context.Scope;

import io.opentelemetry.exporter.otlp.http.trace.OtlpHttpSpanExporter;

import io.opentelemetry.sdk.OpenTelemetrySdk;

import io.opentelemetry.sdk.resources.Resource;

import io.opentelemetry.sdk.trace.SdkTracerProvider;

import io.opentelemetry.sdk.trace.export.BatchSpanProcessor;


import java.util.concurrent.TimeUnit;


public class App {

    public static void main(String[] args) {

        Resource resource = Resource.getDefault().merge(

            Resource.builder().put("service.name", "OtlpExporterExampleService").build());


        // Ensure the Authorization header is set according to Lumigo's requirements

        String lumigoToken = "Your_Token_Here"; // Replace with your actual Lumigo token

        String authorizationHeaderValue = "LumigoToken " + lumigoToken;


        OtlpHttpSpanExporter exporter = OtlpHttpSpanExporter.builder()

                .setEndpoint("https://ga-otlp.lumigo-tracer-edge.golumigo.com/v1/traces") // Confirm this is the correct endpoint

                .addHeader("Authorization", authorizationHeaderValue) // Set the Authorization header correctly

                .build();


        SdkTracerProvider tracerProvider = SdkTracerProvider.builder()

                .setResource(resource)

                .addSpanProcessor(BatchSpanProcessor.builder(exporter)

                    .setScheduleDelay(100, TimeUnit.MILLISECONDS)

                    .build())

                .build();


        OpenTelemetrySdk openTelemetrySdk = OpenTelemetrySdk.builder()

                .setTracerProvider(tracerProvider)

                .buildAndRegisterGlobal();


        Tracer tracer = GlobalOpenTelemetry.getTracer("com.example.App", "1.0");


        Span span = tracer.spanBuilder("example-span").startSpan();

        try (Scope scope = span.makeCurrent()) {

            System.out.println("This is a simple span example being exported");

        } finally {

            span.end();

        }


        try {

            Thread.sleep(2000); // Allow time for the span to be exported

        } catch (InterruptedException e) {

            e.printStackTrace();

        }


        openTelemetrySdk.getSdkTracerProvider().shutdown();

    }

}
In this code, replace your-otlp-endpoint with your actual OTLP endpoint and 'Your_Token_Here' with your lumigo token retrieved from the pre-requisites. This Java demo app simulates an operation, traces it as example-span, and then exports the trace via the OTLP exporter configured with your token sending sample trace data back to your Lumigo instance.
To run the demo app, navigate to the project root and execute:
mvn compile exec:java -Dexec.mainClass="com.example.App"
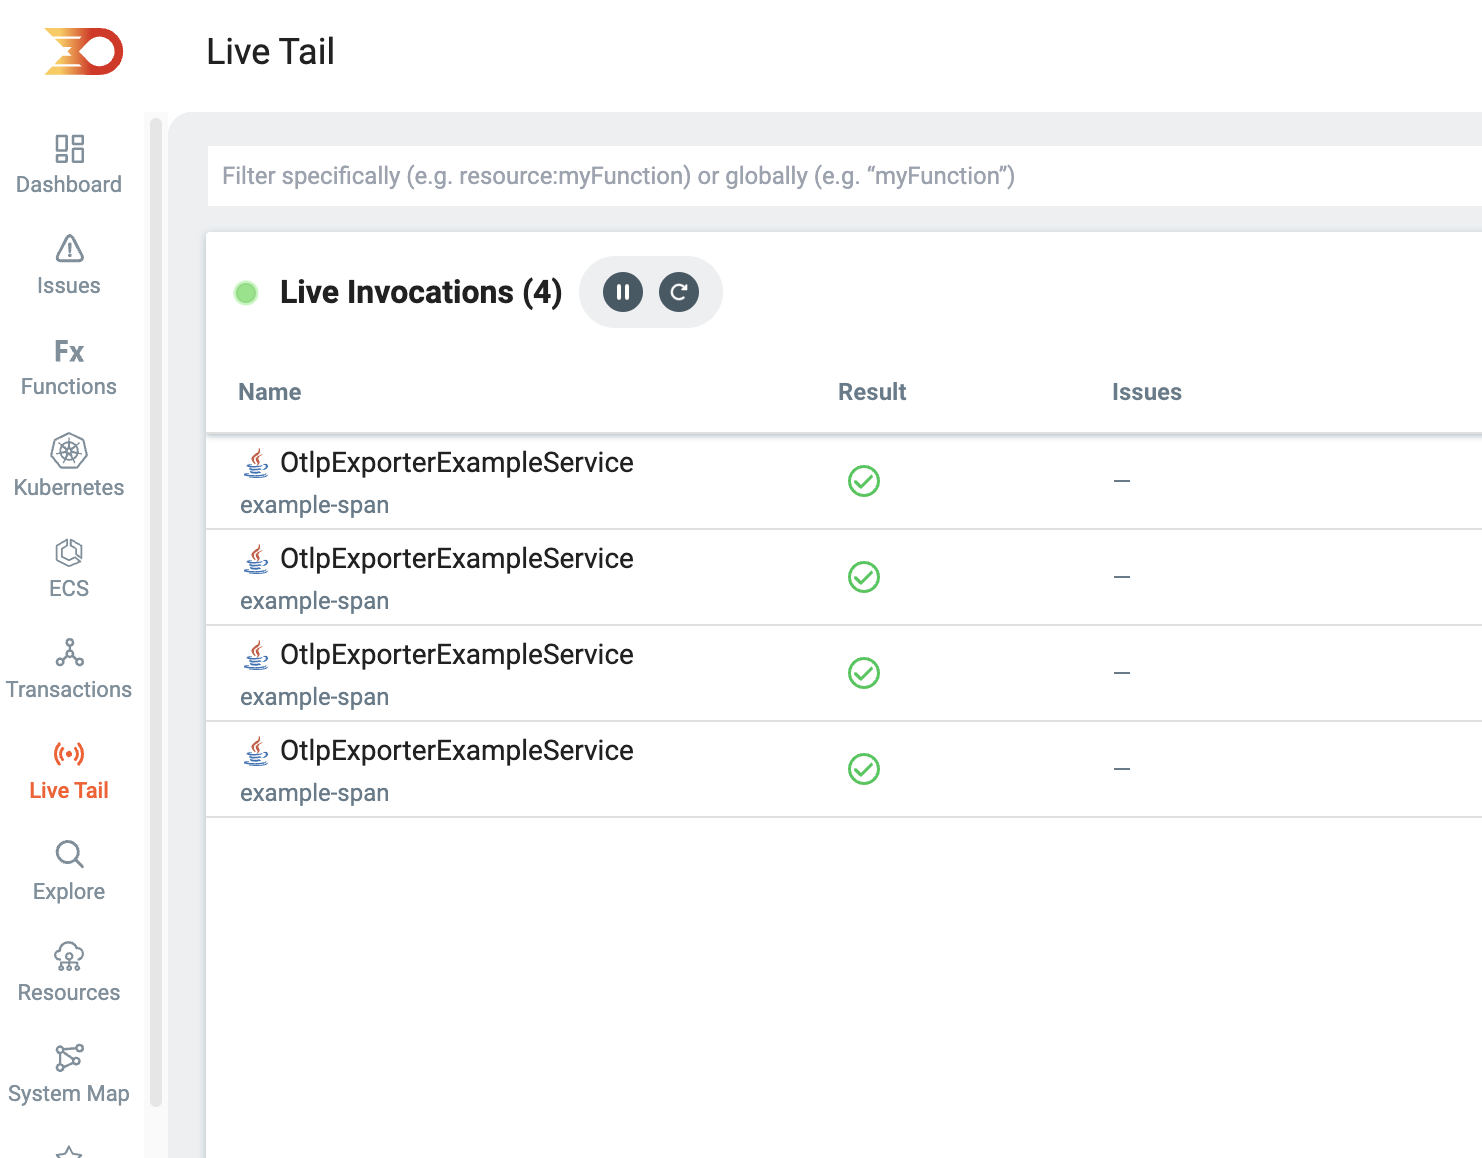
Run the application a few times to generate some traces. Then, log into your Lumigo instance dashboard to start seeing the telemetry data from the demo java app. As you run it also open to the live tail Tab on lumigo and youll see the trace data come in just after you each time you trigger it.
The SDKs of OpenTelemetry are essential for exporting spans, as they comprise multiple components that expand the scope of observability. These components include intricate systems for gathering metrics, refined logging mechanisms, and context propagation techniques crucial for coherent distributed tracing. They provide a better understanding of system dynamics and performance nuances, enabling the identification of inefficiencies and optimization of operations. The SDKs also offer extensive instrumentation libraries that automatically collect telemetry data across various popular frameworks and technologies, enhancing observability with minimal manual intervention.
Test it out with your Java Deployments
Integrating Java applications with OpenTelemetry and OTLP through platforms like Lumigo can significantly enhance observability. Lumigo builds on the foundational capabilities of OpenTelemetry, introducing features such as auto-instrumentation, which simplifies the process of collecting telemetry data without the need for extensive manual coding. By leveraging the power of the OpenTelemetry framework, Lumigo provides enriched insights into system performance and behavior, enabling a more intuitive understanding of complex, scalable environments.
Sign up to Lumigo today and get enriched visibility into your deployments, along with full in-context correlation and body payloads.