


The .NET framework is a powerful platform for creating various applications, from web-based services to comprehensive enterprise solutions. Its extensive libraries, support for multiple programming languages, and powerful development tools enable the creation of high-performance, scalable applications that can be customized to suit various needs. This framework continuously evolves to meet the demands of modern software development with a complete ecosystem of add-ons created by an enthusiastic community.
As with many other programming languages, debugging and maintaining performance across multiple components in complex .NET distributed deployments can be challenging. The interactions within distributed systems, especially those with numerous services and components, can hide the underlying causes of issues, making troubleshooting difficult. In this context, OpenTelemetry emerges as a critical tool, providing a systematic approach to gather and analyze telemetry data, such as logs, metrics, and traces. By integrating OpenTelemetry with .NET, the process of diagnosing and resolving issues is significantly streamlined, offering clearer visibility into the inner workings of applications and simplifying the management of complex, distributed architectures.
Let’s begin by first looking at OpenTelemetry and how it can help with .Net app development.
Understanding OpenTelemetry in the .NET Context
OpenTelemetry is an observability framework that aims to provide standardized and high-quality telemetry data for cloud-native software applications. It is comprised of a set of APIs, libraries, agents, and instrumentation that work together to collect, process, and export telemetry data such as metrics, traces, and logs from applications. The main objective of OpenTelemetry is to simplify the process of observing and understanding systems, which can help improve performance, detect issues more quickly, and gain a better understanding of how applications behave in production environments. By offering a unified approach to observability, OpenTelemetry breaks down the barriers between logging, tracing, and metrics, providing a cohesive view of system performance and behavior.
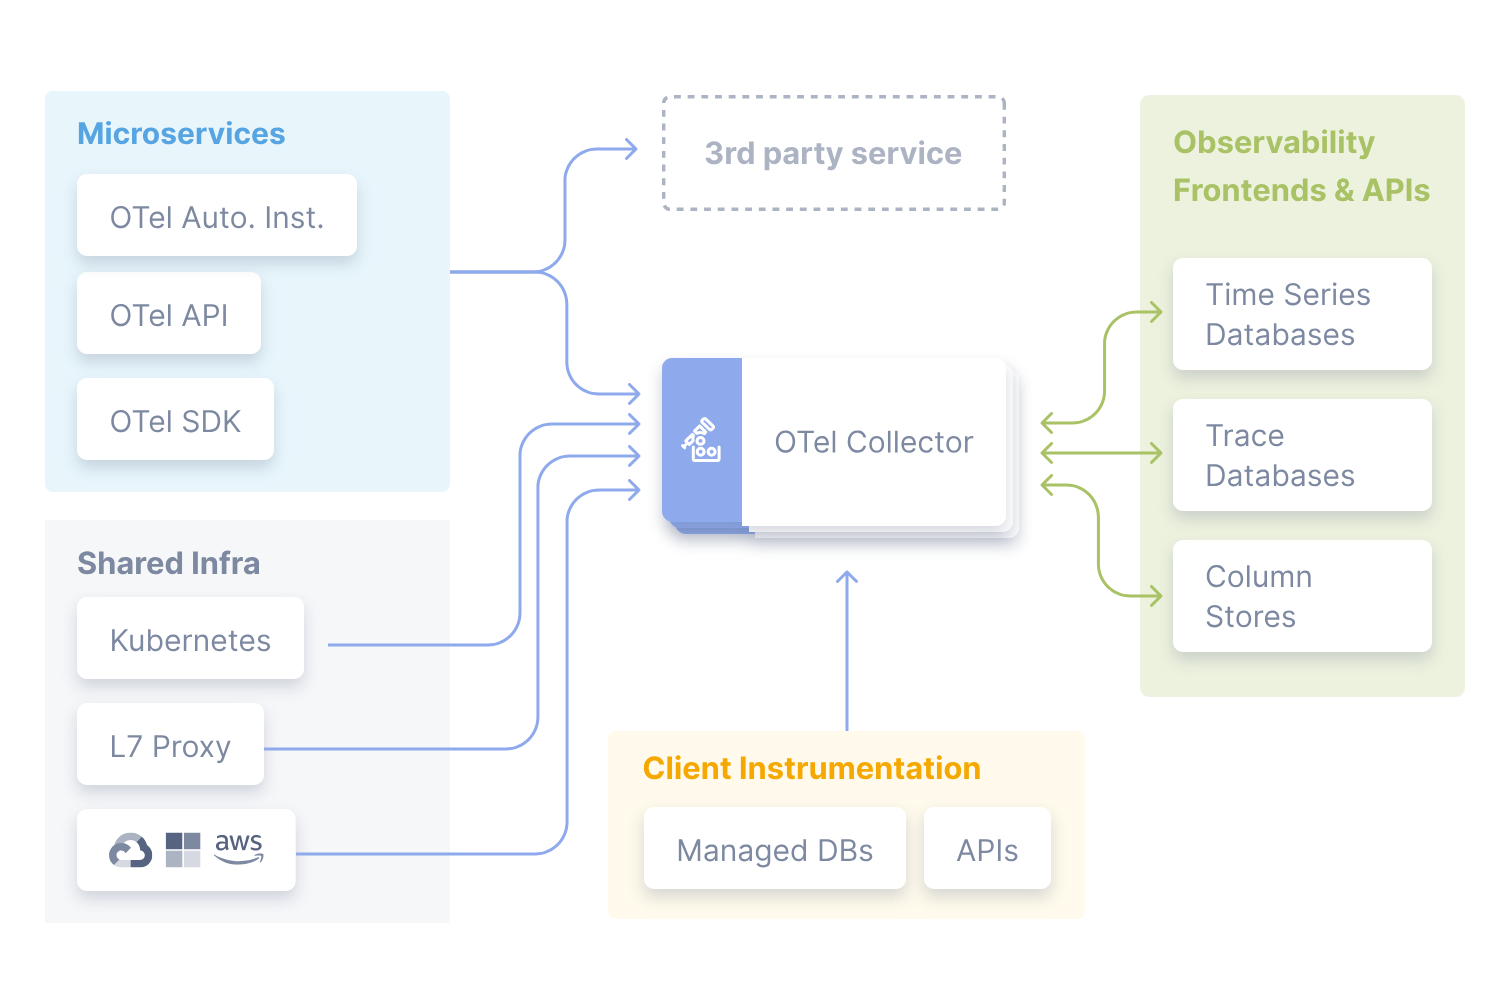
To collect telemetry data from various points within an application’s operation, the application needs to be instrumented. This can be done automatically, by leveraging existing libraries and frameworks within the application, or manually, by adding specific code to capture custom telemetry data. Once the data is collected, it is processed and enriched with additional context, which makes it more useful for analysis and debugging. The data can then be exported to a variety of analysis tools and backend platforms, where it can be visualized, queried, and used to generate insights about the application’s performance and behavior. This end-to-end process enables teams to gain a comprehensive understanding of their applications, from high-level performance metrics to detailed traces of individual requests.
The OpenTelemetry Protocol (OTLP) is a crucial part of the OpenTelemetry ecosystem. It provides a highly efficient and scalable method for transmitting telemetry data between applications and backend analytics platforms. OTLP is designed to be lightweight and vendor-neutral, ensuring broad compatibility and minimal performance overhead. It supports gRPC and HTTP protocols for data transmission, offering flexibility in sending and receiving data. The protocol is optimized for batch processing, allowing for efficient transmission of large volumes of telemetry data while minimizing resource consumption. With the help of OTLP, OpenTelemetry ensures that the collected data is efficiently and reliably delivered to backend systems. The delivered data can be further analyzed and utilized to drive improvements in application performance and reliability.
Crafting a Minimal .NET Application with OpenTelemetry and OTLP
To demonstrate the integration of OpenTelemetry within a .NET application, lets build out a simple .NET console app that utilizes the OpenTelemetry SDK with the OTLP exporter to send trace data to the Lumigo.
Before diving into the code, ensure you have the following:
– .NET SDK installed on your machine
– Sign up for an account on Lumigo, then access to your Lumigo Token
Begin by creating a new .NET console application:
dotnet new console -n DotNetOpenTelemetryDemo

cd DotNetOpenTelemetryDemo
Add the necessary OpenTelemetry NuGet packages to your project:
dotnet add package OpenTelemetry

dotnet add package OpenTelemetry.Exporter.OpenTelemetryProtocol

dotnet add package OpenTelemetry.Instrumentation.Http

dotnet add package OpenTelemetry.Exporter.Console
Open your Program.cs file and update it with the following code, which sets up OpenTelemetry tracing with the OTLP exporter:
using System;

using System.Diagnostics;

using OpenTelemetry;

using OpenTelemetry.Trace;

using OpenTelemetry.Resources;

using OpenTelemetry.Exporter;

using OpenTelemetry.Logs;


class Program

{

    static void Main(string[] args)

    {

        var serviceName = "DotNetOTLPExample";

        var serviceVersion = "1.0.0";

        var lumigoToken = "Your_Lumigo_Token_Here"; // Replace with your actual token


        var resourceBuilder = ResourceBuilder.CreateDefault().AddService(serviceName: serviceName, serviceVersion: serviceVersion);


        using var tracerProvider = Sdk.CreateTracerProviderBuilder()

            .SetResourceBuilder(resourceBuilder)

            .AddSource(serviceName)

            .AddHttpClientInstrumentation()

            .AddOtlpExporter(options =>

            {

                options.Endpoint = new Uri("https://ga-otlp.lumigo-tracer-edge.golumigo.com/v1/traces");

                options.Headers = $"Authorization=LumigoToken {lumigoToken}";

                options.Protocol = OtlpExportProtocol.HttpProtobuf;

            })

            // Adding console logging for the exporter to help debug export issues

            .AddConsoleExporter()

            .Build();


        var activitySource = new ActivitySource(serviceName);


        // Generate some tracing data

        using (var activity = activitySource.StartActivity("SampleOperation"))

        {

            if (activity != null)

            {

                activity.SetTag("custom.attribute", "value");

                Console.WriteLine("Hello, OpenTelemetry!");


                // Simulate some detailed operations within the main activity

                using (var childActivity = activitySource.StartActivity("ChildOperation"))

                {

                    childActivity?.SetTag("child.attribute", "child value");

                    // Simulate work in the child activity

                    System.Threading.Thread.Sleep(200);

                }


                // Simulate some work in the main activity

                System.Threading.Thread.Sleep(300);

            }

        }


        // Wait for a moment to ensure the export of traces

        Console.WriteLine("Waiting for trace export...");

        System.Threading.Thread.Sleep(5000); // Increased wait time to ensure export

    }

}
In this example, replace Your_Lumigo_Token_Here with your actual Lumigo token and adjust the endpoint to match your Lumigo instance. This minimal application initiates a trace, marks a simple operation, and then exports this trace to Lumigo using OTLP.
It is important to note that usually when using the Lumigo OTLP endpoint, you don’t need to add /v1/traces to the endpoint. However, in this particular case, you need to add it due to how the current SDK handles the endpoint. If you don’t include it, you won’t see any trace data.
To execute your application, run the following command in your terminal:
dotnet run
You should see a console output that will provide useful debugging information from the SDK, which is somewhat meta as it’s debugging information for debugging.

Run the code several times alongside your lumigo dashboard and open the Live Tail tab. You should be able to see then additional trace information starts to appear within the page view. Integrating OpenTelemetry with Lumigo enriches your observability insights, offering a clearer understanding of your application’s behavior and performance.

Try it out with your .Net Apps
Integrating .NET applications with OpenTelemetry, OTLP, and Lumigo’s specialized tracing capabilities can significantly improve system observability. Lumigo utilizes OpenTelemetry’s comprehensive toolset, including advanced auto-instrumentation, to simplify telemetry data collection without the need for complex manual coding efforts. This integration enhances the observability of .NET applications and enables Lumigo to provide profound insights into system performance and intricacies. With Lumigo, gaining a deeper understanding of even the most complex and scalable .NET environments becomes more intuitive, providing a clear view of the inner workings of your applications.
Join Lumigo to gain enhanced visibility into your .NET deployments, ensuring you have access to detailed insights and in-context correlations that fully represent your system’s health and efficiency.