


This is the third and final blog post in a series about shifting Observability left. If you have not yet read the first two, you can find the first post here and the second post here.
Observability is fundamental to modern software development, enabling developers to gain deep insights into their application’s behavior and performance. Developers can quickly and easily detect and resolve issues by adopting observability tools, ensuring a faster troubleshooting resolution plus more reliable user experiences for end users. However, the plethora of observability tools available can make the selection process daunting.
In this blog post, we’ll guide you through choosing the right tools for a developer toolchain, focusing strongly on two everyday use cases focusing on comparing Prometheus and OpenTelemetry.
Understanding Observability Tools
Observability tools are a collection of software solutions designed to gather, analyze, and visually represent data about the performance and health of an application. These tools cover a variety of OpenTelemetry nuances such as monitoring, logging, tracing, and metrics, which are essential for any developer-centric toolchain. They capture valuable data from different parts of the application, enabling developers to comprehend how their system behaves and to identify any anomalies or bottlenecks.
Factors to Consider When Choosing Observability Tools
- Data Collection Capabilities: Look for tools that offer robust data collection capabilities. Most Observability tools can gather data from various sources, such as logs, metrics, and distributed traces. It’s important to note that from a developer’s point of view, having access to the complete request and response payload is highly valuable when troubleshooting an issue.
- Scalability and Performance: Ensure the chosen tool can scale effortlessly with your application’s growth and not introduce significant overhead on system performance.
- Ease of Integration: Choose tools that seamlessly integrate with your existing tech stack, including programming languages, frameworks, and cloud platforms. Additionally, ensure the process is automated so you don’t have to configure monitoring with every new release continuously.
- Visualization and Dashboarding: Effective visualization is essential for quick data interpretation. Look for tools with intuitive dashboards that provide the context to resolve issues in a single screen.
- Alerting Mechanisms: Timely alerts are crucial for proactive issue resolution. Seek tools that provide flexible alerting mechanisms based on customizable thresholds.
- Community Support and Documentation: A vibrant community and well-documented tools can be immensely helpful in troubleshooting and leveraging the full potential of the observability platform.
Prometheus: An Overview
Prometheus is an open-source monitoring and alerting toolkit initially developed at SoundCloud. It has gained popularity for its scalability, reliability, and powerful query language, PromQL. Key features of Prometheus include:
- Data Model: Prometheus uses a multidimensional data model with metrics represented as time-series data. This model allows for efficient data storage and querying.
- Data Collection: Prometheus scrapes metrics from instrumented targets using the HTTP pull model, making it suitable for traditional server-based architectures and cloud-native environments.
- Alerting Rules: Prometheus provides a flexible and powerful alerting system to send notifications based on predefined rules and conditions.
- Visualization: Grafana, a popular open-source visualization tool, seamlessly integrates with Prometheus, allowing developers to create insightful dashboards.
OpenTelemetry: An Overview
OpenTelemetry is an open-source project focused on standardizing the collection of distributed traces and metrics in modern cloud-native applications. It offers a vendor-agnostic approach to observability and is widely supported across multiple languages and frameworks. Key features of OpenTelemetry include:
- Distributed Tracing: OpenTelemetry facilitates distributed tracing, allowing developers to monitor the flow of requests across microservices and identify bottlenecks in complex architectures.
- Instrumentation Libraries: OpenTelemetry provides libraries and SDKs for various programming languages, making it easier to instrument applications and collect telemetry data.
- Pluggable Architecture: The pluggable nature of OpenTelemetry enables seamless integration with different observability backends, including Prometheus, Jaeger, and more.
- Context Propagation: With OpenTelemetry, developers can propagate context between services, ensuring that request information is maintained throughout the entire application flow.
Choosing the Right Observability Tools: Prometheus vs. OpenTelemetry
Now that we’ve explored the key features of both Prometheus and OpenTelemetry, let’s take a closer look at specific use cases and how each tool from the opentelemetry tool chain shines:
- Prometheus Use Cases:
-
-
- Prometheus is an excellent choice for traditional monolithic applications or those with a limited number of microservices, where metrics collection and monitoring are the primary focus.
- It works well for applications with a straightforward architecture and fewer distributed components.
-
- OpenTelemetry Use Cases:
-
- OpenTelemetry is ideal for complex, cloud-native applications with multiple microservices and service-to-service communication.
- It excels in scenarios where distributed tracing is critical for understanding the interactions between different components.
OpenTelemetry is the Clear Choice for Developers Running Microservices
Choosing the right observability tools for a development toolchain is a crucial decision that can significantly impact your application’s reliability and performance. You can make an informed decision by considering data collection capabilities, scalability, integration ease, visualization, alerting mechanisms, and community support. Based on this criteria, OpenTelemetry is the clear choice for developers to troubleshoot the microservices applications.
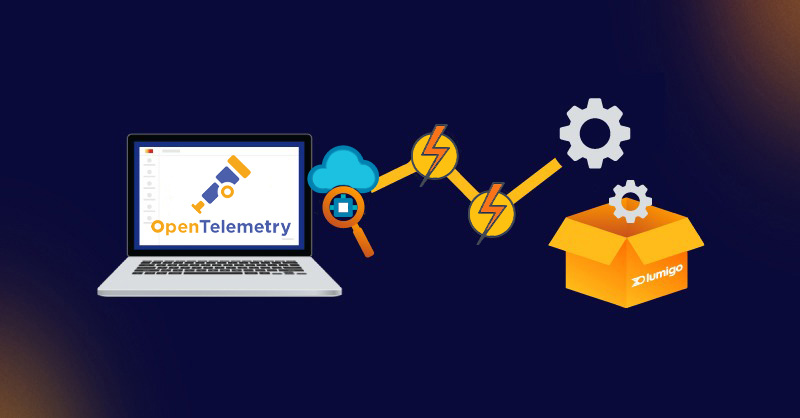
This is why Lumigo has built our container and Kubernetes tracing using OpenTelemetry, an industry standard. Lumigo’s microservice troubleshooting platform provides developers and DevOps with the power of OpenTelemetry with a single click. Users can harness Lumigo’s best-in-class debugging and observability platform for all microservices-based environments. Whether you are operating in a serverless, containerized, or Kubernetes-based environment, Lumigo automatically captures and contextualizes all of the data needed to troubleshoot issues in production. The expanded support into containers allows for autonomous deployment of OpenTelemetry in under five minutes.