
- Guide Content
What Is Zipkin? Features, Architecture, and a Quick Tutorial
What Is Zipkin?
Zipkin is a distributed tracing system that was originally developed by Twitter to gather timely data needed to troubleshoot complex microservices architectures. It is based on the Google Dapper paper (Barosso et, al, 2010). The primary purpose of Zipkin is to provide visibility into the latency of your application’s service calls. It manages both the collection and lookup of this data, enabling you to understand the detailed operations of your system and identify any issues or improvements needed.
Zipkin works by collecting timing data from various points in your application’s service architecture, and then provides a detailed view of this data through a web-based UI. This allows you to trace the path of requests and responses across various services and systems, giving you a holistic view of your application’s performance.
Zipkin has a minimalistic design, and it is straightforward to set up and use. Even though it is simple, it is also highly effective, and it has been successfully adopted by many large-scale web applications around the world.
This is part of an extensive series of guides about open source.

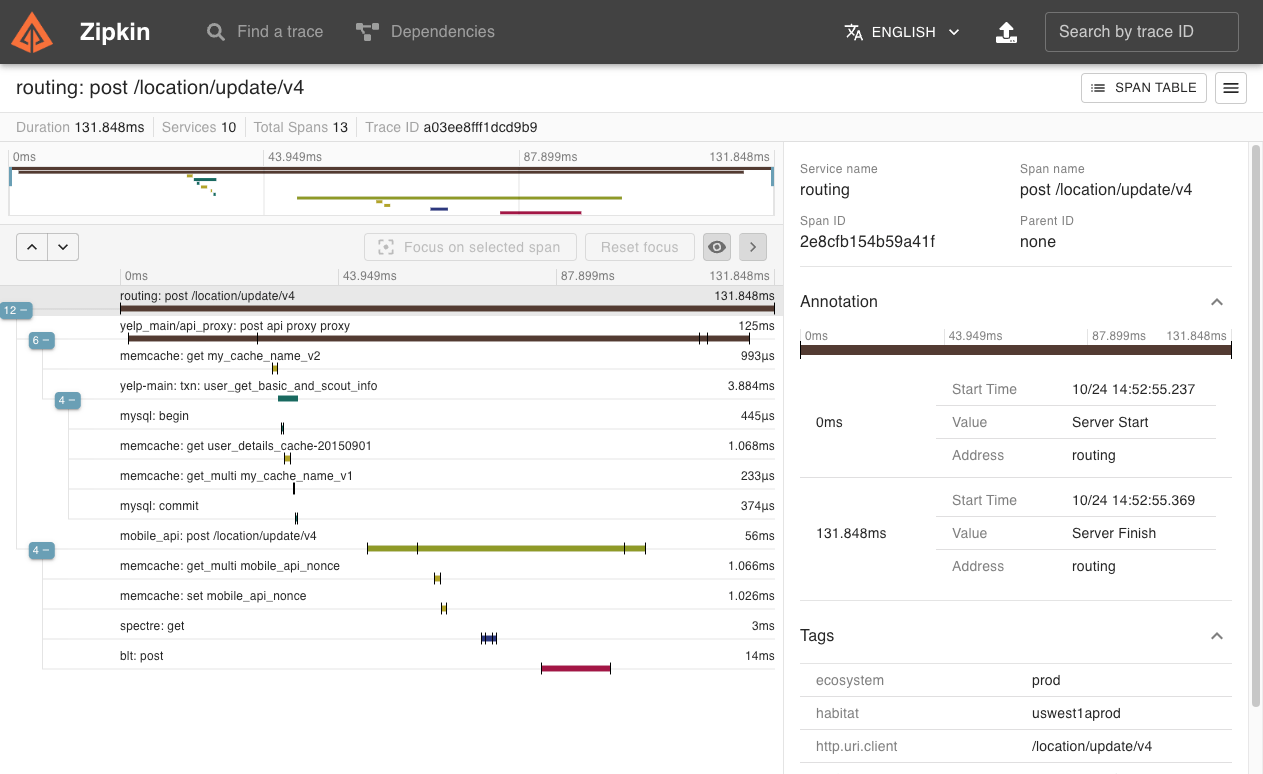
Image Source: Zipkin.io
In this article
Zipkin Use Cases
Performance Optimization
By providing a detailed view of service call latency, Zipkin allows developers to identify bottlenecks and optimize their applications accordingly. For example, if a particular service takes longer than expected to process a request, this will be clearly visible in the Zipkin UI. This insight can then be used to investigate the cause and optimize the service.
Zipkin not only identifies slow services but also helps in spotting inefficient service interactions. In a microservices architecture, a request often involves multiple services. If these interactions are not efficient, it can significantly impact the overall performance of the application. Zipkin helps identify such issues by giving a detailed view of the interactions between services.
Microservices Dependencies Mapping
In a microservices architecture, services are often interconnected, forming a complex network. Understanding this network and the dependencies between services is crucial for maintaining and evolving the system.
Zipkin provides a dependencies diagram that shows how services call each other. This diagram can be invaluable for understanding the overall structure of the application. It can also help identify potential risks if one service fails, how it might affect other services in the network.
Troubleshooting Errors
Zipkin is also highly useful for troubleshooting errors. If a request fails, Zipkin can help pinpoint the exact service and operation that caused the failure. This makes it much easier for developers to identify and fix the issue.
In addition, Zipkin provides detailed trace data that can be used to understand the context of the error. This includes the request and response data, the time taken by each service, and more. This detailed data can significantly reduce the time needed to troubleshoot and resolve issues.
Monitoring and Alerting
Zipkin provides real-time data about the performance of your application, which can be used to monitor the system’s health. If a service starts performing poorly or fails altogether, this will be immediately apparent in the Zipkin UI.
Furthermore, Zipkin can be integrated with alerting tools to automatically notify developers or operators when something goes wrong. This can help ensure that issues are detected and addressed as quickly as possible, minimizing the impact on users.
Key Features of Zipkin
Distributed Tracing
The core feature of Zipkin is, of course, distributed tracing. This is the process of tracking and analyzing the path of a request as it flows through a system of microservices. Zipkin collects timing data from each service involved in handling a request, and then aggregates this data into a single comprehensive trace.
This trace provides a detailed view of the entire journey of a request, from the moment it enters the system until it leaves. It shows the interactions between services, the time taken by each service, and any errors that occurred along the way. This information is invaluable for understanding and optimizing the performance of your application.
Data Visualization
Zipkin also provides powerful data visualization tools. It includes a web-based UI that offers various ways to view and analyze trace data. For example, you can view a timeline of a request, showing the sequence of service calls and their respective latencies. You can also view a dependencies diagram that shows how services interact with each other.
These visualization tools make it much easier to understand and interpret the trace data. They provide a clear and intuitive view of the system’s operations, helping developers identify issues and opportunities for optimization.
Storage Options
Zipkin supports a variety of storage options for trace data. By default, it uses an in-memory storage that is suitable for testing and development. For production use, it supports more robust options such as MySQL, Cassandra, and Elasticsearch.
These storage options provide flexibility in terms of scalability and durability. For example, if you need to handle a large volume of trace data, you can use a scalable storage like Cassandra. If you need high durability, you can use a replicated storage like Elasticsearch.
API for Custom Instrumentation
Finally, Zipkin provides an API for custom instrumentation. This allows you to integrate Zipkin with your application and collect custom trace data. For example, you can add custom annotations to your traces, or you can collect additional timing data from specific parts of your application.
This custom instrumentation can greatly enhance the usefulness of Zipkin. It allows you to collect precisely the data you need to understand and optimize your application.
Zipkin Architecture: 5 Key Components
1. Instrumented Services
Instrumented services are the backbone of the Zipkin architecture. They are the applications or systems that you monitor using Zipkin. These services can range from simple web applications to complex microservice architectures.
Instrumentation involves modifying a service so it can report timing data to Zipkin. This can be done manually, but more often, it is done using open source libraries that do the heavy lifting. These libraries exist for several programming languages and frameworks, making it easy to integrate Zipkin into your existing services.
The primary role of these instrumented services is to generate trace data. This data provides valuable insights into the system’s behavior, revealing bottlenecks and latency issues that might otherwise remain hidden.
2. Collector
Once the instrumented services generate trace data, it needs to be collected and processed. This is where the collector comes in.
The collector is responsible for receiving the traces from the instrumented services and validating them. Once the traces are validated, they are stored for later retrieval and analysis. The collector can receive data over various protocols such as HTTP, Kafka, and RabbitMQ, making it flexible and adaptable to different system architectures.
3. Storage
Once the trace data has been collected and validated, it needs to be stored. Zipkin provides support for a variety of storage backends, including in-memory storage, MySQL, Cassandra, and Elasticsearch.
The choice of storage backend depends on the specific requirements of your system. For instance, in-memory storage might be suitable for a small system or for development and testing, but it wouldn’t be the best choice for a larger, production-grade system where data persistence is critical.
4. API
Zipkin’s API provides a way for clients to query the stored trace data. This can be done using a simple RESTful interface, making it easy for developers to integrate Zipkin data into their own applications or tools.
This API is also used by the Zipkin Web UI, another essential component of Zipkin, to retrieve the data for visualization. This flexibility makes the API a crucial bridge between the raw trace data and the tools that can make sense of this data.
5. Web UI
The Web UI is where the magic of Zipkin truly comes to life. It provides a visual interface for viewing and analyzing the trace data. You can view traces in a timeline, showing exactly when each service was called and how long it took.
The Web UI also allows you to drill down into specific traces to get more details. This can be especially useful when you’re trying to debug a complex issue involving multiple services.
Zipkin vs. Similar Tools
Zipkin vs. Jaeger
Jaeger, like Zipkin, is an open source distributed tracing system. However, there are some key differences between the two. Jaeger supports more instrumentation libraries out of the box, and it also provides advanced sampling strategies. However, Zipkin’s simplicity and ease of deployment make it a popular choice among developers.
Learn more in our detailed guide to Zipkin vs Jaeger
Zipkin vs. Prometheus
Prometheus is a powerful monitoring tool that focuses on time-series data. While Zipkin and Prometheus can both be used to monitor systems, they do so in different ways. Zipkin focuses on tracing requests through a system, while Prometheus focuses on collecting and querying time-series data.
Zipkin vs. OpenTelemetry
OpenTelemetry, a Cloud Native Computing Foundation (CNCF) project, aims to provide a comprehensive standard for observability, merging the capabilities of distributed tracing, metrics, and logs. Zipkin, in comparison, focuses solely on distributed tracing. The main differences between Zipkin and OpenTelemetry are their scope and the features they offer. OpenTelemetry provides a broader range of observability features—beyond distributed tracing, it also supports metrics collection and logging, making it more of an all-in-one solution for observability.
Getting Started with Zipkin: Quick Tutorial
Downloading and Installing Zipkin
To get started with Zipkin, the first task is to download and install it. The process is straightforward and doesn’t require much technical nous. You can download the latest release of Zipkin from their official GitHub repository. After downloading, you can typically start Zipkin by running a single command in your terminal.
However, it’s not just about downloading and installing Zipkin. You also need to ensure that it’s properly set up to collect and analyze trace data from your distributed systems.
Instrumentation
There are several libraries available that can automatically instrument your code for Zipkin, allowing you to start collecting trace data without having to write much, if any, additional code. These libraries are typically designed to work with a specific programming language or framework, so you’ll need to choose one that’s appropriate for your application. You can see a list of Zipkin instrumentation libraries here.
Once you’ve selected and integrated an instrumentation library, you’ll need to configure it to send trace data to your Zipkin installation. This typically involves setting the URL of your Zipkin server and potentially some other options, depending on the library you’re using.
Collecting Traces
The next step is to start collecting traces. Zipkin’s trace collection functionality is based on a concept known as a “span.” A span represents a single unit of work done by your application, such as sending a request to a database or rendering a web page.
Each span is composed of several pieces of information, including its start and end times, its parent span (if any), and any tags or annotations that provide additional information about the span.
To collect traces, you’ll need to ensure that your instrumentation libraries are properly configured and that your applications are generating spans as they execute. Learn more in the Zipkin documentation. Once this is done, you can start to analyze the trace data in Zipkin’s user interface.
Exploring Traces
One of the main benefits of Zipkin is its powerful trace exploration interface. This interface allows you to view all of the spans associated with a specific trace, as well as the relationships between them.
This can be incredibly useful for diagnosing problems and understanding how your application operates. For example, if your application is experiencing high latency, you can use Zipkin’s exploration interface to determine which spans are taking the longest to execute and potentially why that is the case.
Analyzing Performance
In addition to exploring individual traces, Zipkin also provides tools for analyzing the overall performance of your applications. This includes features like latency histograms and dependency diagrams that can help you understand where the bottlenecks in your system are and how different components of your system interact with each other.
By using these features, you can gain a deeper understanding of your system and make more informed decisions about where to focus your optimization efforts.
Troubleshooting
Finally, Zipkin can be an invaluable tool for troubleshooting problems in your distributed systems. When something goes wrong, you can use Zipkin’s trace exploration and performance analysis features to pinpoint the root cause of the problem.
For example, if your application is experiencing high error rates, you can use Zipkin to identify which spans are failing and potentially why they are failing. This can help you quickly diagnose and fix problems, reducing downtime and improving the reliability of your applications.
Distributed Tracing with Lumigo
Lumigo is a cloud native observability tool, purpose-built to navigate the complexities of microservices. Lumigo’s automated distributed tracing stitches together the many components of a containerized application and tracks every service in a request. When an error or failure occurs, users will see not only the impacted service, but the entire request in one visual map so you can easily understand the root cause, limit impact and prevent future failures.
With deep debugging data in to applications and infrastructure, developers have all the information they need to monitor and troubleshoot their containers with out any of the manual work:
- Automatic correlation of logs, metrics and traces into end-to-end visualization of requests and full system map of applications
- Monitor and debug third party APIs and managed services (ex. Amazon DynamoDB, Twilio, Stripe)
- Go from alert (in Slack, PagerDuty and other workflow tools) to root cause analysis in one click
- Understand system behavior and explore performance and cost issues
Get started with a free trial of Lumigo for your microservice applications
See Additional Guides on Key Open Source Topics
Together with our content partners, we have authored in-depth guides on several other topics that can also be useful as you explore the world of open source.
Openshift Container Platform
Authored by NetApp
- Understanding Red Hat OpenShift Container Platform
- OpenShift Persistent Storage via Cloud Volumes ONTAP
- OpenShift Deployment with Cloud Volumes ONTAP Using Ansible
ElasticSearch
Authored by Granulate
- Elasticsearch: Use Cases, Architecture, and 6 Best Practices
- Elasticsearch on AWS: A Practical Guide
- Elasticsearch on Docker: The Basics and a Quick Tutorial
Kubernetes Architecture
Authored by Run.AI