


- Guide Content
Docker Monitoring: Key Metrics, Challenges & 4 Best Practices
What Is Docker Container Monitoring?
Docker container monitoring is a process that involves keeping a close watch on the performance and health of Docker containers. Docker is an open-source platform that automates the deployment, scaling, and management of applications. Docker packages software into standardized units known as containers that contain everything the software needs to run, including libraries, system tools, code, and runtime.
Monitoring these containers ensures that they’re functioning optimally and allows for the early detection and remediation of potential issues. In addition to checking if containers are up and running, monitoring can provide in-depth insights into their performance. Docker container monitoring tracks metrics like CPU usage, memory usage, and network IO.
In this article
Key Metrics to Monitor in Docker
Here are some of the most important metrics you should monitor in a Docker environment:
- Container metrics: Information about the performance and resource usage of individual Docker containers. These include CPU usage, memory usage, network IO, and disk IO. Monitoring these metrics can help you understand how containers are performing and how they’re using resources.
- Docker Daemon Metrics: The Docker Daemon is a background service running on the host that manages Docker containers. Monitoring Docker Daemon metrics can provide insights into the overall health and performance of your Docker environment. These metrics include CPU usage, memory usage, and the number of running containers.
- Docker API Metrics: Docker provides an API that allows you to interact with the Docker Daemon and manage your containers. Monitoring Docker API metrics can give you insights into how your applications are interacting with Docker and help you detect potential issues.
- Service and application metrics: These metrics pertain to the applications running within your Docker containers and can provide insights into their performance and health. Application metrics vary, but commonly include the number of transactions, transaction latency, and error rates.
Notable Docker Container Monitoring Tools
1. Lumigo

Lumigo is a monitoring tool designed for cloud-native applications, with full support for Docker and Kubernetes. It provides automated tracing and debugging, allowing a more easier approach to pinpoint issues more quickly. Lumigo offers insights into performance bottlenecks, error rates, and resource utilization, enabling the ability to optimize containerized applications efficiently.
Leveraging AI to analyze container metrics, Lumigo delivers real-time alerts on anomalies. Its intuitive dashboard visualizes the entire application stack, facilitating easy monitoring of interconnected services within Docker environments. This holistic view aids in swift issue resolution, enhancing system reliability.

2. cAdvisor

cAdvisor is an open-source tool developed by Google for monitoring container performance and resource usage. It provides detailed information about container metrics such as CPU, memory, filesystem, and network usage. cAdvisor’s lightweight nature makes it particularly suited for real-time monitoring.
Integrating easily with other monitoring solutions, such as Prometheus and Grafana, cAdvisor enhances visibility into container health. It’s a basic tool that provides the ability to create real-time metrics for container performance optimization and troubleshooting.
3. Prometheus & Grafana

Prometheus collects and stores metrics as time series data, and when paired with Grafana for visualization, it offers a robust solution for Docker container monitoring. Prometheus’s dynamic service discovery adapts to containerized environmPents, automatically monitoring new containers.
Grafana dashboards present Prometheus data, allowing for visualization of container metrics, such as CPU and memory usage, enabling high-level and granular analysis of container health and performance. Grafana’s alerting features notify teams of potential issues.

Source: Prometheus
4. ELK stack

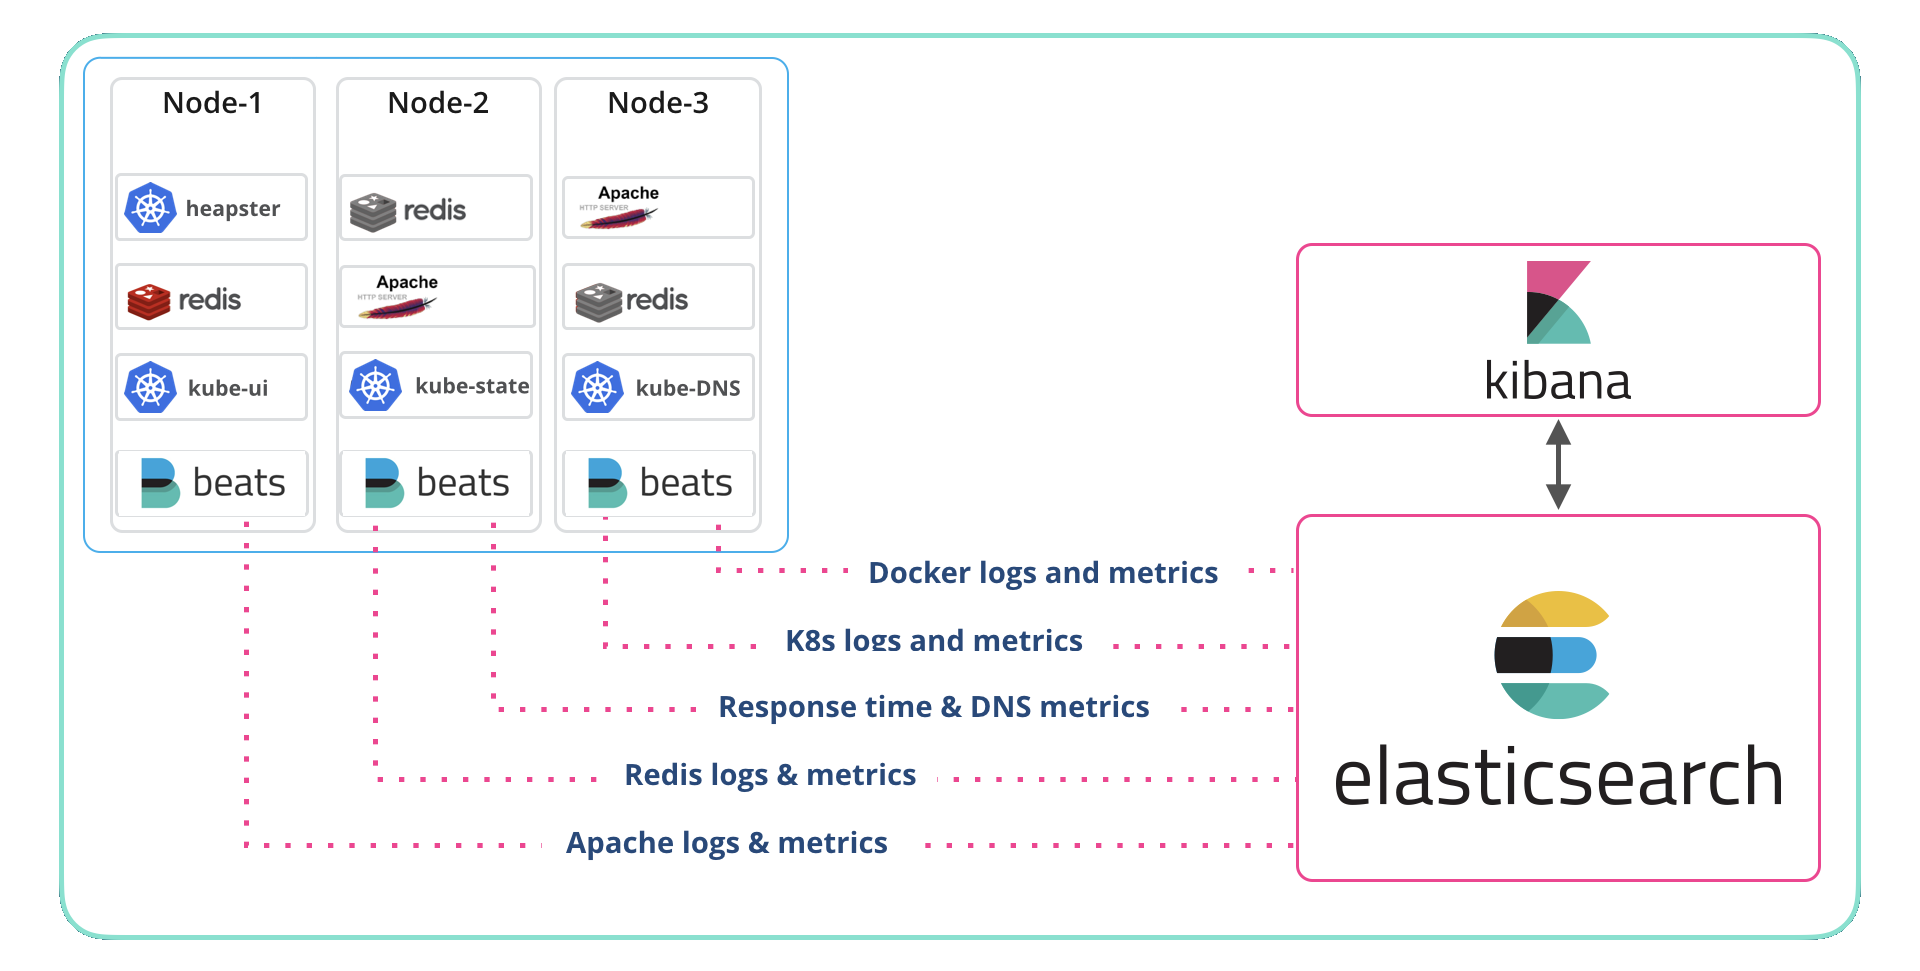
The ELK stack consists of Elasticsearch, Logstash, and Kibana. It’s a powerful combination for searching, analyzing, and visualizing data. ELK is commonly used for monitoring containerized environments, by aggregating logs and metrics and providing insights into container behavior.
When used for container monitoring, Elasticsearch indexes and stores container log data, Logstash processes and forwards it, and Kibana visualizes it. This enables the identification of patterns, anomalies, and trends in container activity. Configurable dashboards allow for the focus on specific metrics for proactive management and troubleshooting.

Source: Elastic
5. Datadog
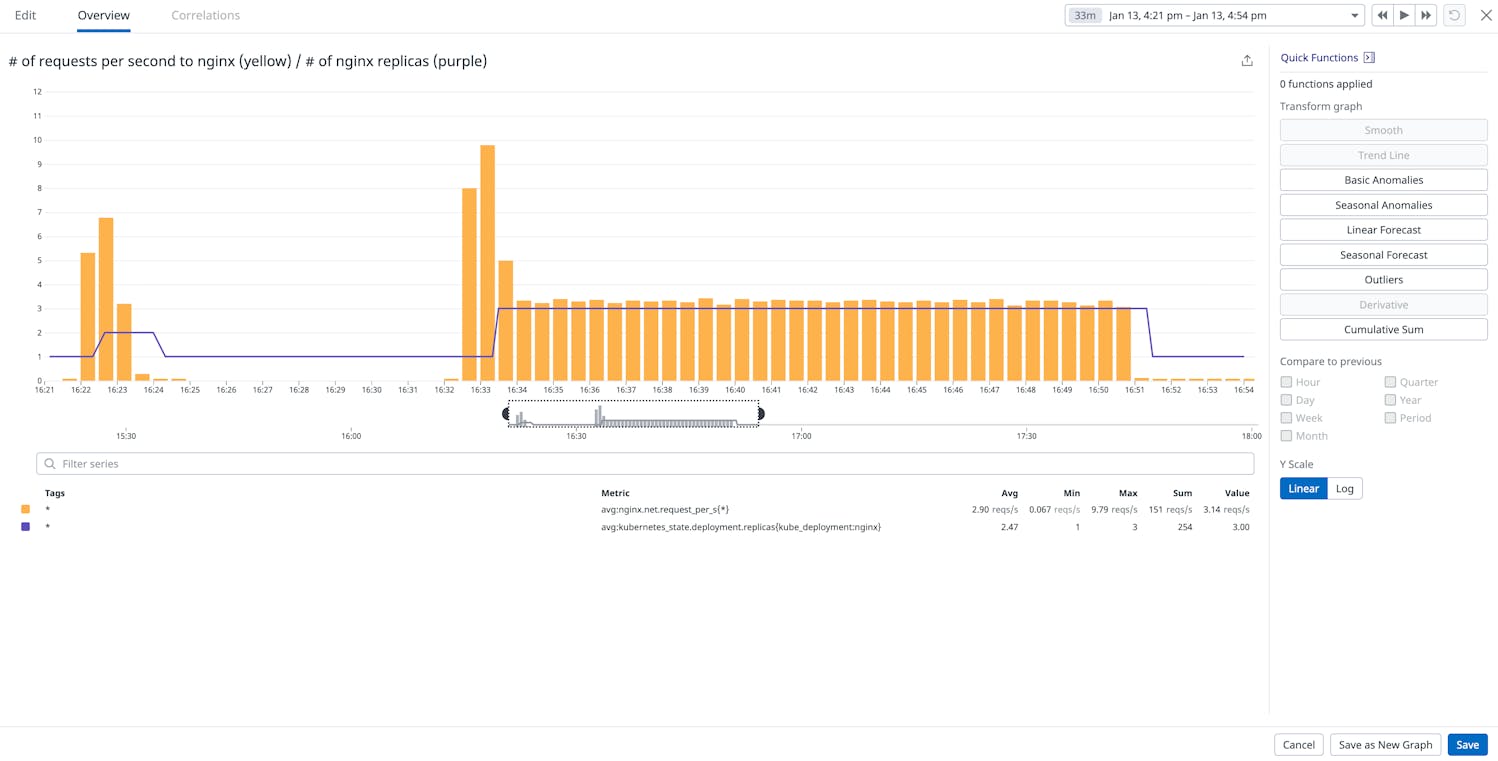
Datadog provides real-time monitoring and analytics for Docker containers. It collects metrics, traces, and logs, enabling comprehensive analysis of container performance. Datadog integrates with the Docker API, offering detailed insights into containers and the applications they host.
With custom dashboards and alerting, Datadog helps teams rapidly identify and troubleshoot issues. It can scale to support large-scale Docker deployments and provides AI-powered analytics to enhance decision-making about container optimization and management.

Source: Datadog
6. Sysdig
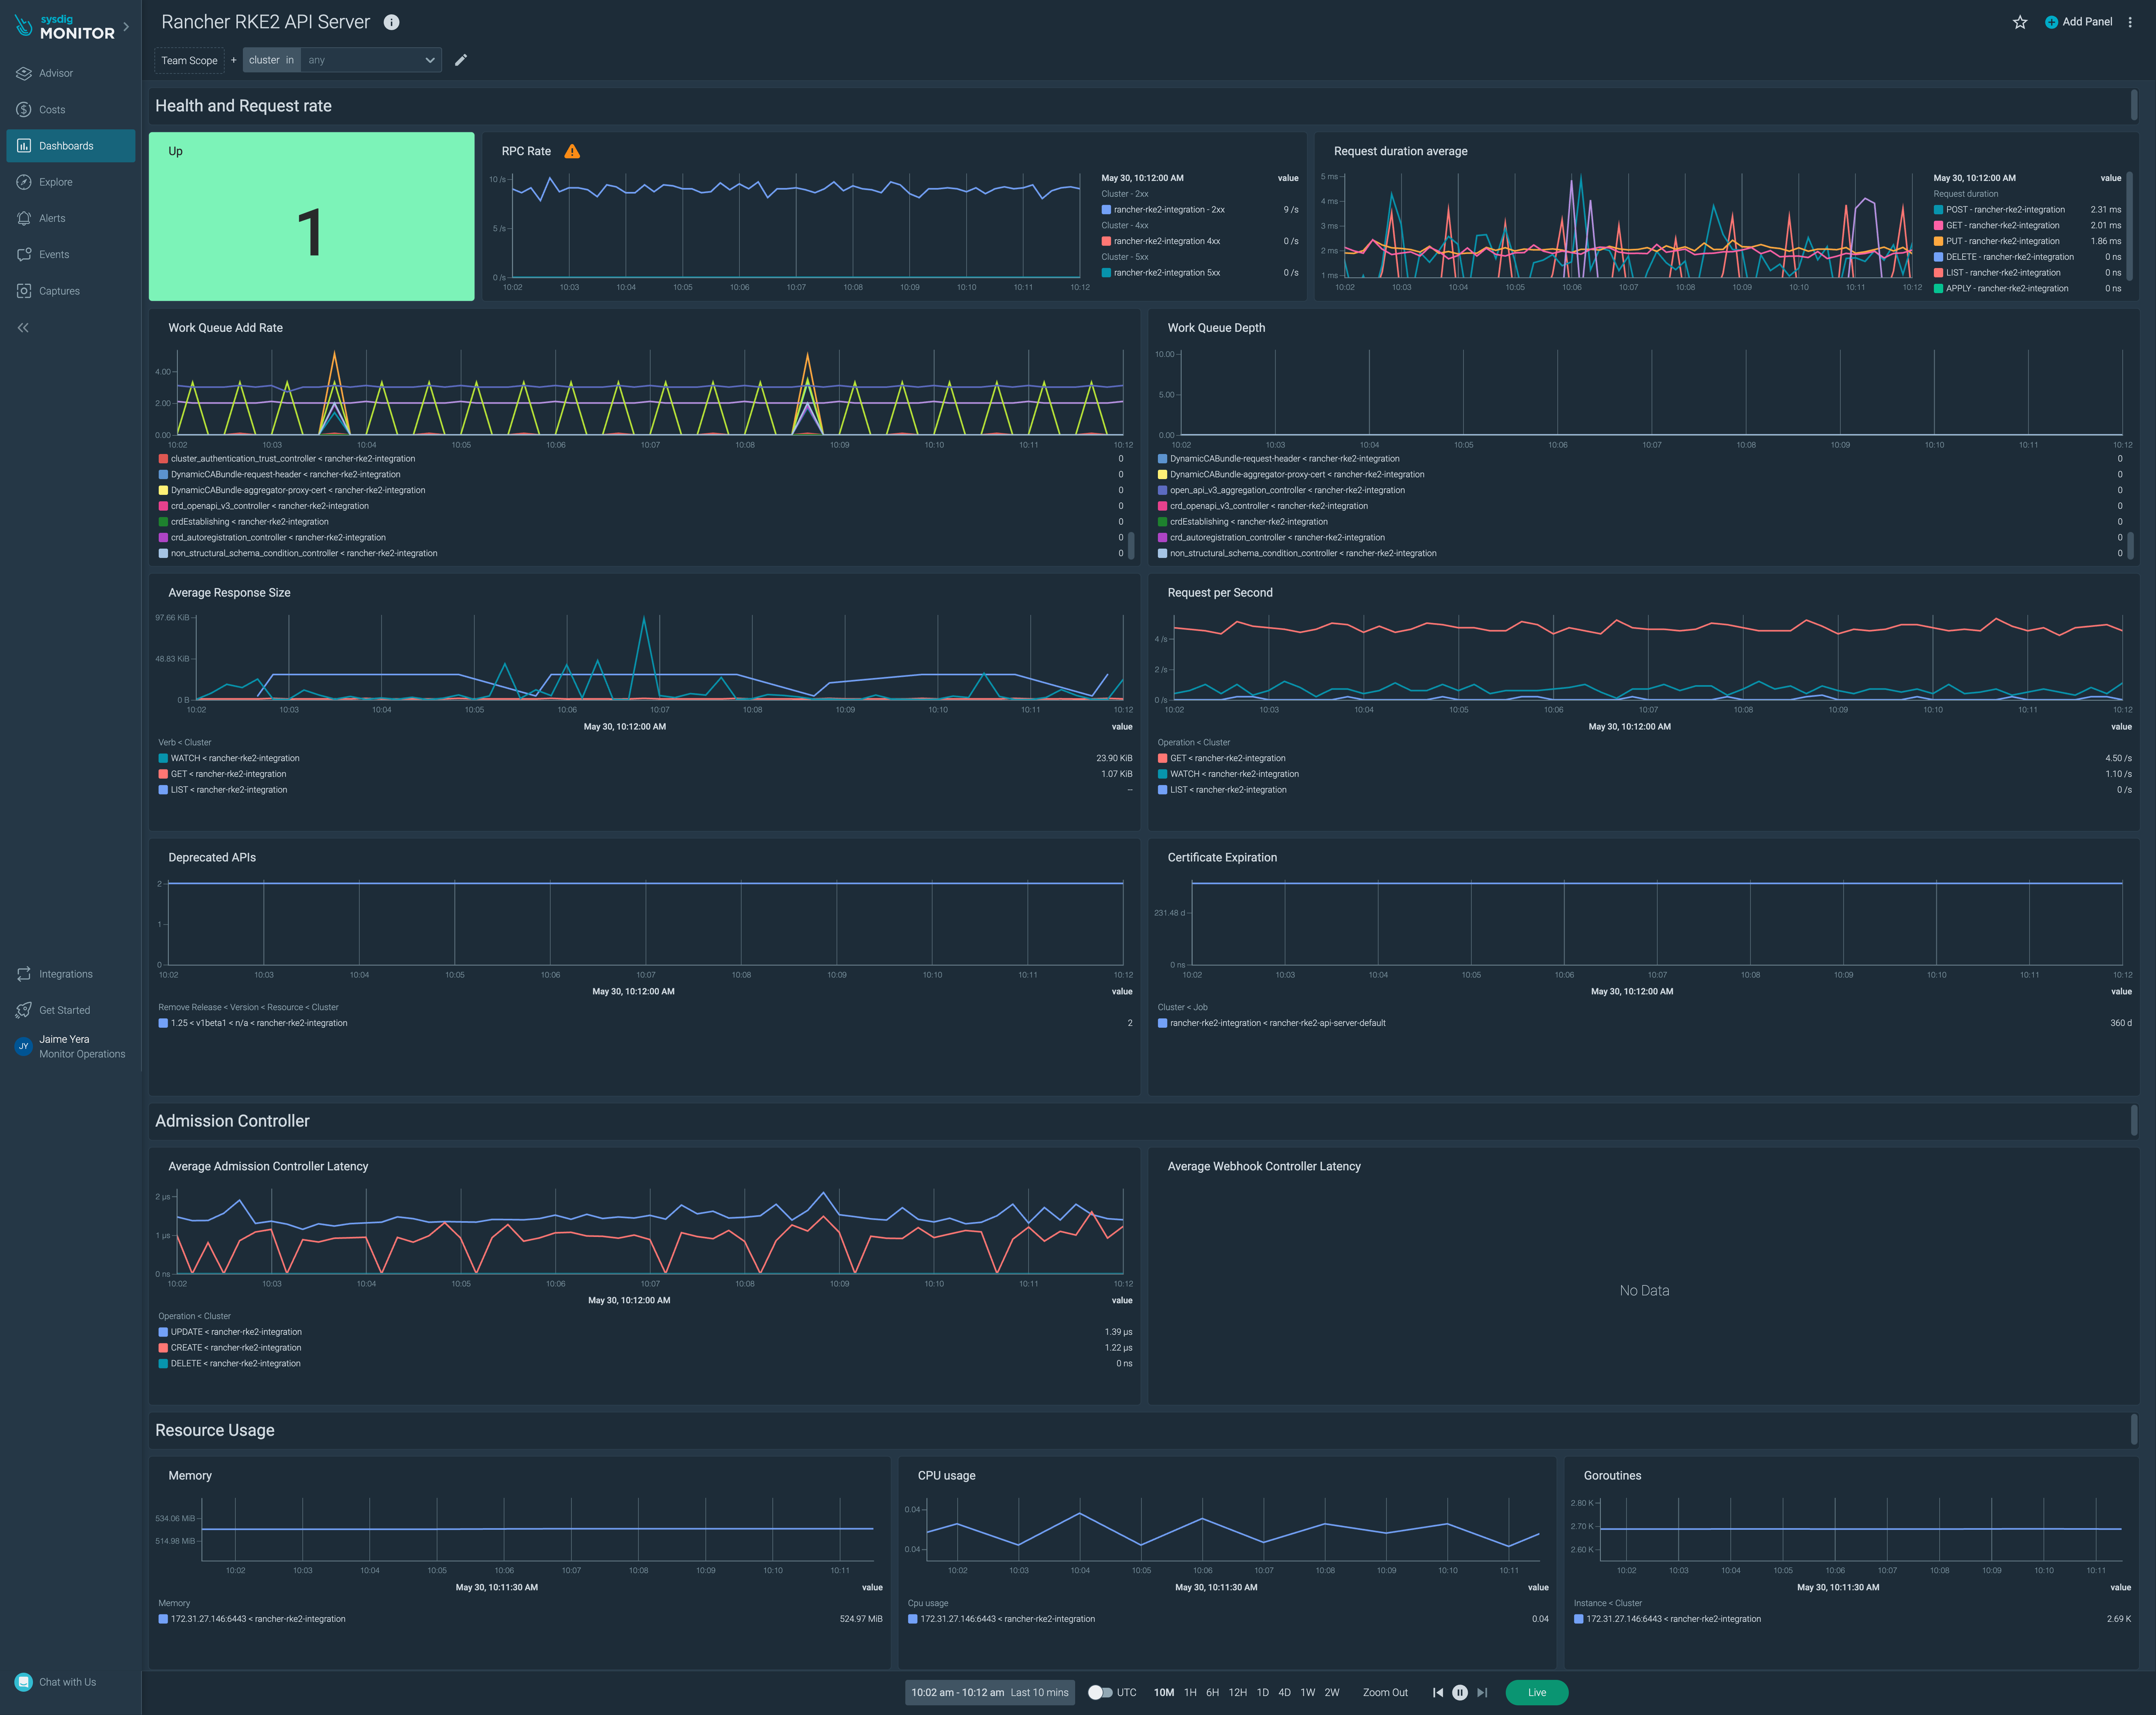
Sysdig offers deep visibility into container performance, security, and compliance enabling captured system calls to provide insights into container activity. Sysdig’s monitoring capabilities extend to Kubernetes environments, making it a comprehensive solution for container orchestration.
In addition to performance monitoring, the solution also offers Sysdig Secure, which focuses on runtime security and compliance. It monitors and protects containers from threats, ensuring the safety of containerized applications.

Source: Sysdig
7. Dynatrace
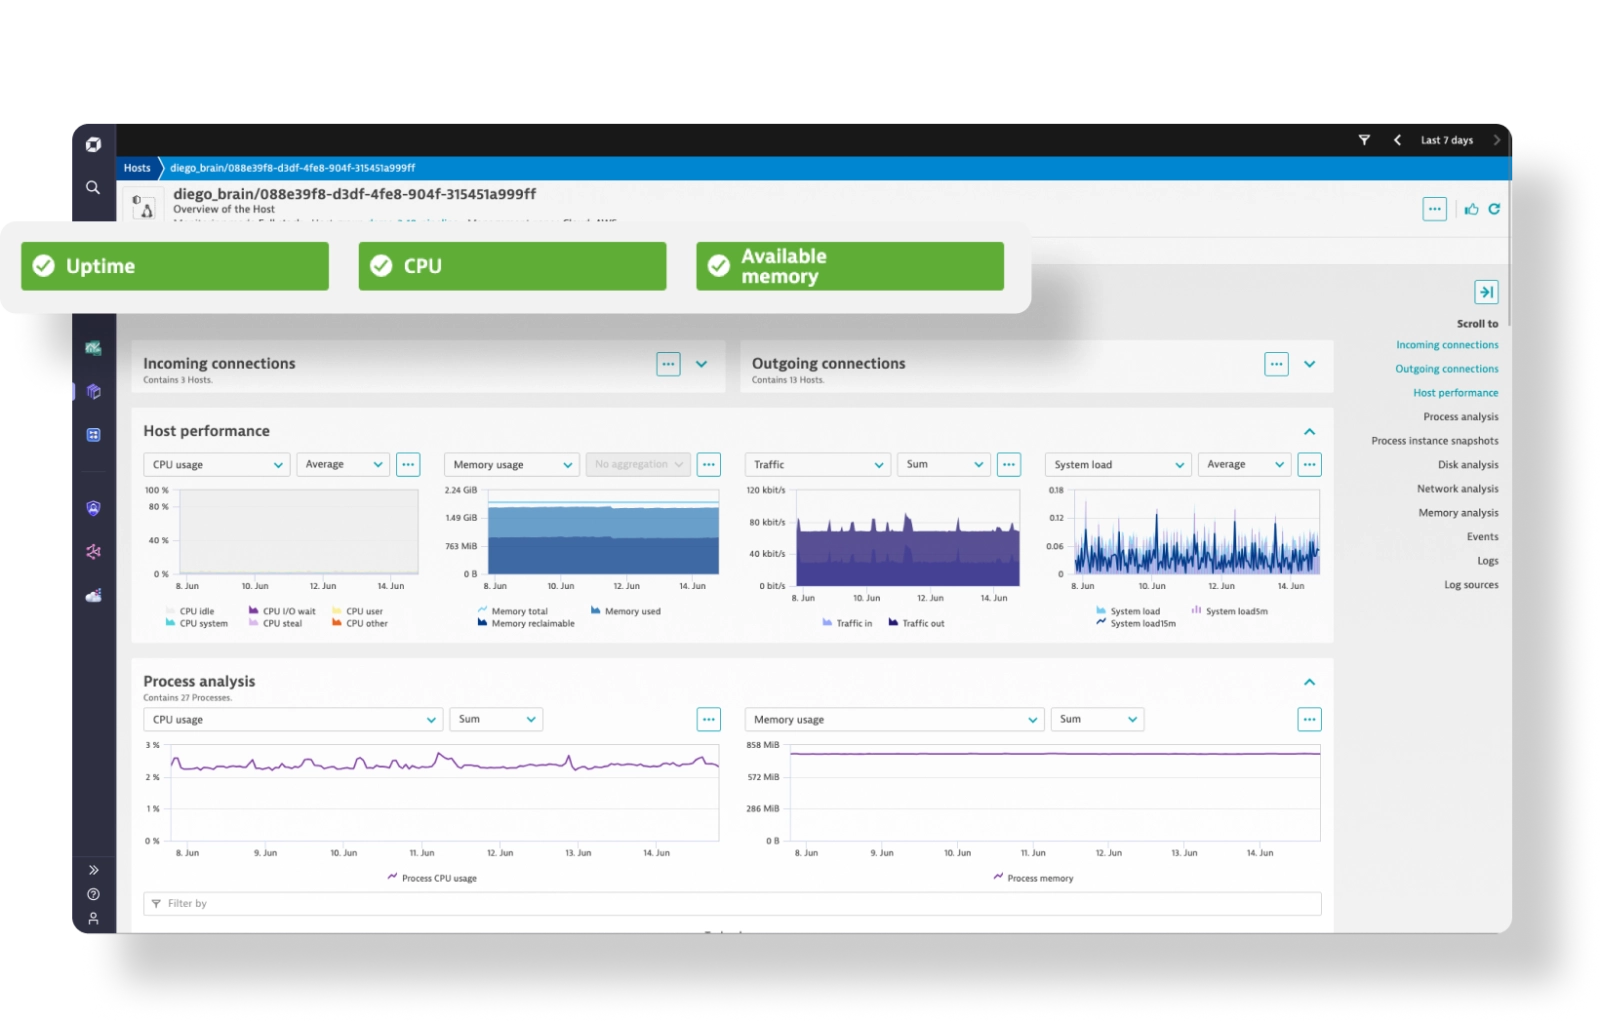
Dynatrace uses AI to automate the monitoring and management of containerized applications. It provides end-to-end visibility across the entire application stack within Docker environments. Dynatrace identifies performance issues and offers root cause analysis, simplifying troubleshooting.
With its Smartscape technology, Dynatrace maps dependencies within containerized applications, aiding in understanding and managing complex environments. It provides real-time notifications on performance degradation or anomalies.

Source: Dynatrace
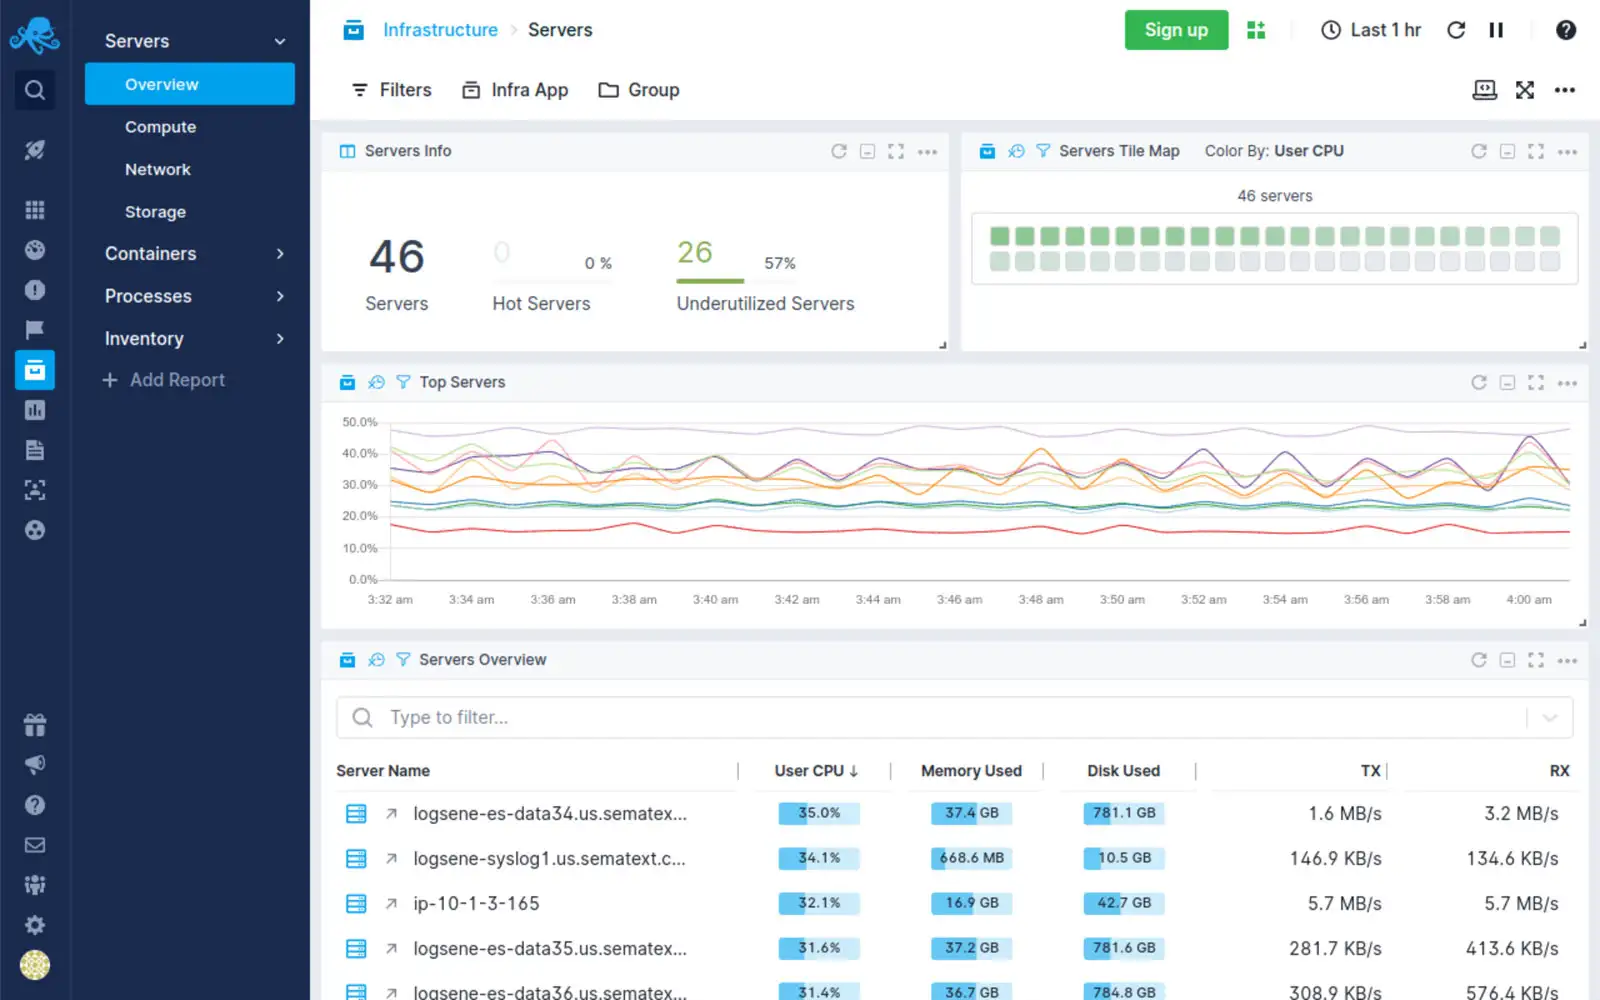
8. Sematext
Sematext offers monitoring, logging, and real-time analytics for Docker containers. It collects and analyzes logs and performance metrics, providing insights into container and application performance. Sematext’s user-friendly dashboard allows for easy tracking of key performance indicators.
The solution integrates with alerting systems to ensure teams are promptly notified of issues. Sematext has features that enable performance optimization and troubleshooting.

Source: Sematext
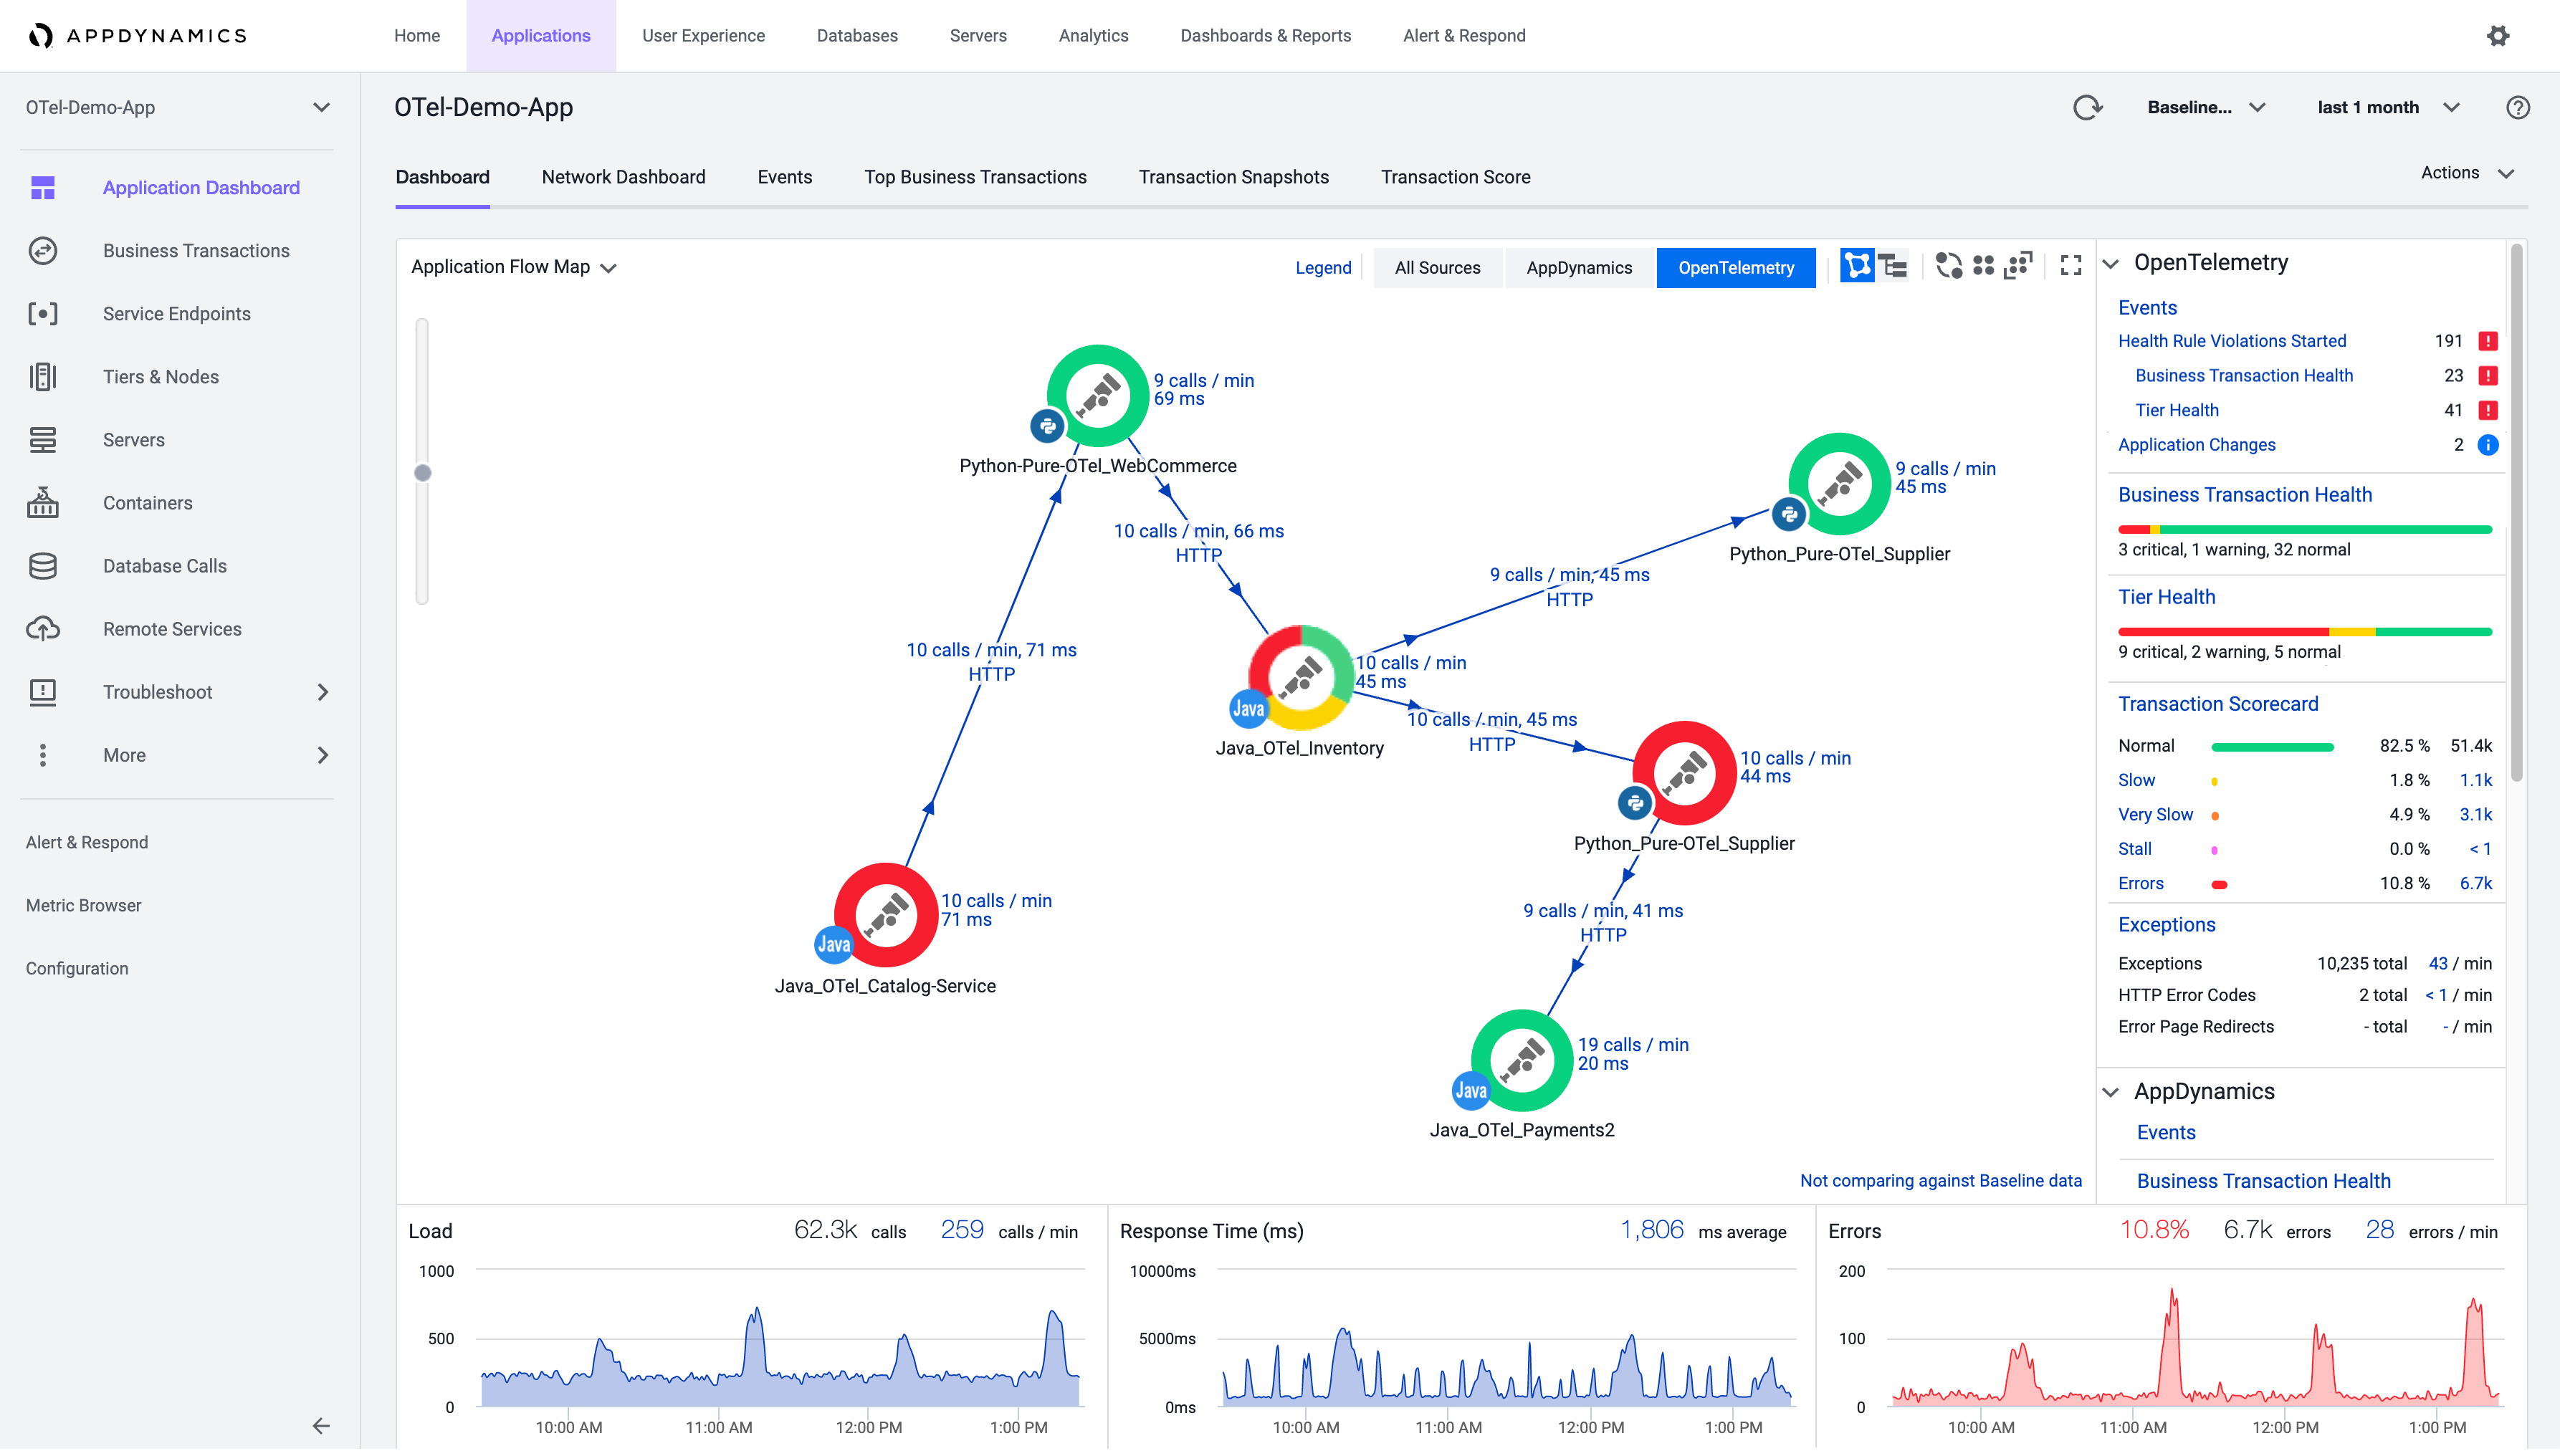
9. AppDynamics
AppDynamics provides application performance monitoring with support for Docker containers. It offers insights into application behavior, performance bottlenecks, and transaction tracing. This helps provide an understanding of how containerized applications perform under various conditions.
With its Business Transactions feature, Appdynamics identifies critical paths within applications, aiding in optimization and issue resolution. Real-time visibility and scalability make it suitable for monitoring complex, distributed containerized applications.

Source: AppDynamics
4 Best Practices for Docker Monitoring
1. Implement Monitoring From the Beginning of Container Adoption
It’s much easier and more effective to start monitoring your containers from the beginning rather than trying to retrofit processes later.
Early monitoring allows you to establish a baseline for your container performance, which can help you identify any deviations or anomalies in the future. It also enables you to understand the behavior of your containers under different loads and conditions, which can be invaluable in planning your capacity and scaling your systems.
Moreover, implementing monitoring from the start helps you ensure that your containers are set up correctly and are running efficiently.
2. Prioritize Actionable Metrics
Some monitoring strategies focus on collecting as much data as possible. But it’s more important to focus on actionable metrics. These are the metrics that can provide meaningful insights into your container performance and help you make informed decisions.
Collecting vast amounts of data can lead to information overload and make it difficult to identify and focus on those key metrics. It’s important to understand the purpose of each metric and how it relates to your container performance. This can help you prioritize the metrics that matter the most and collect the data you need to support those metrics.
Some of the key metrics to focus on include CPU usage, memory usage, network traffic, disk I/O, and container uptime. These metrics can provide a comprehensive overview of your container performance and help you identify any potential issues. There might be specific metrics that matter in your environment, and if so, you should focus on them.
3. Regularly Review Monitoring Configuration
As your system evolves and grows, your monitoring requirements may also change. Regular reviews can help you ensure that your monitoring configurations are still relevant and effective.
An important part of reviewing monitoring configuration is to update your alert thresholds. As you gain more understanding of your container behavior, you may need to adjust your alert thresholds to avoid false positives or missed alerts.
4. Integrate Monitoring with CI/CD
Integrating your Docker container monitoring with your Continuous Integration/Continuous Deployment (CI/CD) pipeline can be highly beneficial. This can allow you to detect and address potential issues early in the development cycle, before they impact your production environment.
By monitoring your containers in the CI/CD pipeline, you can catch performance issues, resource leaks, or configuration errors early on. This proactive approach can help you maintain high-quality code, reduce downtime, and improve the overall reliability and performance of your systems.
Get started with a free trial of Lumigo for your microservice applications.