


When we set out to trace applications running outside of AWS Lambda, there was little doubt in our minds that building on top OpenTelemetry was by far the best course of action. There are many reasons for this, but chiefly, it is a question of coverage. At its most fundamental level, achieving coverage requires as-wide-as-possible support for technologies, and interoperability among instrumentations. In our industry, there is an incredible amount of diversity in technology that is put in production every day. By its nature, distributed tracing requires non-trivial, bespoke work to support each technology, and that is something that a large community is better suited to do than any single vendor.
As a technical product manager, I was excited by the idea of building out a new tracing product using a combination of an extremely solid open-source technology like OpenTelemetry and effectively greenfield development on Lumigo’s side.
In distributed tracing products, there are two aspects tightly intertwined:
- The collection and dispatch of data (“tracer’s side”)
- The processing and querying of data (“backend side”)
Today, we focus on the tracer side of Lumigo, and specifically the Lumigo OpenTelemetry distributions for Node.js and Python. With each distribution, our goal is to create the easiest, best set up distribution of OpenTelemetry to be used either with Lumigo or other backends out there.
No lock-in, thank you very much
Before we discuss what the Lumigo OpenTelemetry distributions do on top of “vanilla” OpenTelemetry SDKs, let’s clarify what they do not do: lock-in. We take pains to avoid lock-in of our distros in Lumigo:
- No dedicated exporters: The Lumigo backend exposes an OTLP/HTTP endpoint that expects, as authentication, the Lumigo tracer token passed in an Authorization header. Literally every OpenTelemetry SDK we came across has out-of-the-box support for this setup.
- No proprietary semantic conventions: we are taking every chance to adopt OpenTelemetry Semantic Conventions, contributing also to implementations upstream (we started with aws.ecs and aws.logs tags, already merged in the upstream Java and JS OpenTelemetry SDKs, with Python and Go in review at the time of writing).
The ease of Lumigo OpenTelemetry distributions with other backends
The result is something we take great pride in:
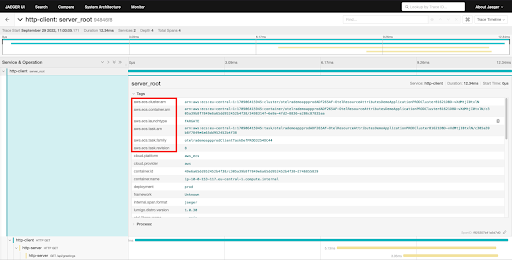
A trace collected by the Lumigo OpenTelemetry distributions for JS and Python and displayed in Jaeger.
In the image above, you see tracing data collected by two applications, a client and a server talking with one another over HTTP, and instrumented using the Lumigo OpenTelemetry distributions for Node.js and Python, respectively. With respect to a setup that works with Lumigo, all it took was adding and configuring the Jaeger exporter!
const { init } = require(‘@lumigo/opentelemetry’);

const { JaegerExporter } = require(‘@opentelemetry/exporter-jaeger’);

const { BatchSpanProcessor } = require(‘@opentelemetry/sdk-trace-base’);

(async () => {

  const { tracerProvider } = await init;

  tracerProvider.addSpanProcessor(

    new BatchSpanProcessor(

      new JaegerExporter({})

    )

  );

  …

);
The full demo is available as an AWS Cloud Development Kit in the Lumigo’s jaeger-demo repository.
The importance of being compatible
But why go to great lengths to keep upstream (and easy to enjoy) compatibility? There’s a few reasons:
- OSS done right: We believe in open-source software, the community and that a rising tide lifts all boats.
- Easy to try: We want the best possible experience for anybody wanting to try out Lumigo with their existing applications.
- Easy to leave: If you decide that Lumigo is not the right backend for you, we truly do not want to force you into work to switch to something else.
Going above and beyond on ease of adoption
Which brings us to the next point: what do Lumigo OpenTelemetry distributions do differently than other distros or the upstream OpenTelemetry SDKs?
- Ease of setup and maintenance: Thanks to their no-code setups (Node.js, Python), the Lumigo OpenTelemetry distributions are straightforward to install and update. You are up and running by literally just adding a dependency to your application, and a couple environment variables. And since we require no code in the application to be changed, updating to the latest tracer is just a matter of updating the version you include as a dependency to the latest and greatest.
- Metadata setup: No-code capabilities would be of little use, if the data resulting from it would be missing important metadata like resource attributes describing, for example, in which type of container orchestration is your workload running (Is it Kubernetes? Is it Elastic Container Service? What else?). We commit to expanding the metadata collection that happens out-of-the-box with Lumigo OpenTelemetry distributions as we expand support for container orchestrations in Lumigo, and to contribute to the upstream resource detectors, so others can too! We also automatically configure Batch exporters that reduce significantly the performance overhead of getting the data out of your application.
- Automated QA: If you have used distributed tracing before, chances are sometimes an update to a tracer or to a dependency instrumented by it, broke your application. This is a direct consequence of distributed tracing instrumentation often needing to be built as aspect-oriented programming, which sometimes has unfortunate dependencies on the internals of instrumented libraries and frameworks. Every change to a Lumigo OpenTelemetry distribution is tested against all supported versions of every supported package, and the outcome is documented in the support matrix that is bundled with the distribution itself, so that that information can be used at runtime. Moreover, nightly we check for new versions of dependencies we instrument, test them, and if all looks good, release a new version of the pertinent distribution. It is hard to quantify something that does not happen, but based on previous experience at other observability companies: the lack of support tickets and angry customers is thunderous.
Like what you read so far?
I could write more, talking about the redaction of confidential data, or the way we automatically inject the instrumentation, but this blog is way too long as it is. If you want to hear more, you can catch me on the floor of the AWS Community Days Netherlands, on Oct. 3, 2022. If you would like to exchange ideas about OpenTelemetry and distributed tracing in general, you can find me in the Cloud Native Computing Foundation Slack (user id: @mmanciop).
And if you want to see the magic that the backend of Lumigo can do with the wealth of data provided out-of-the-box by the Lumigo OpenTelemetry distributions, sign up for a Lumigo account and get started today.