


It’s no secret that application containerization has revolutionized the digital world as we know it by providing a transient gateway into elastic infrastructure that can scale and grow as needed. Where traditional virtualization was all about creating a single homogenous entity, containers are self-contained units of software, able to run in just about any environment, making them extremely portable.
Applications that scale rapidly via containerization also risk the chance to bring with them the potential to also scale issues within the applications, which either may not be identified during development, or may arise due to changes in connected services and infrastructure.

To look at it another way, and to build on a popular quote with ancient origins, “With great scale comes the need for great observability”. Tracing and monitoring can help surface these issues while observing the resources being utilized by your containers.
Here’s how to get started on observing and monitoring your ECS clusters with Lumigo.
The Setup
Like with all excellent adventures, there are a few things we need to prepare before we begin our journey. Have an AWS account set up and at least one ECS cluster deployed—extra points for also having a few Lambdas or other traceable services. To find out how Lumigo can help with your Lambda traces, check out this blog post.
The other thing you will need is a Lumigo account that is connected to your AWS. It’s easy to do, free, and only takes a few minutes.
To get started, head to the Lumigo signup page and create your account by clicking the “Continue with Google” button, or by entering an email and password. The next step is then to connect your AWS account by clicking the “Connect to AWS” button.
Once the AWS connection process is complete, Lumigo will automatically start scanning for services and applications to trace from the connected account. This process will identify resources of interest and will start tracing them in your Lumigo instance.
Give it a few moments to complete the initial scans, then explore your newly created Lumigo account to see which applications have been observed and discovered. Clicking into the ECS tab from your Lumigo instance will display any clusters that Lumigo has detected from your connected AWS account.
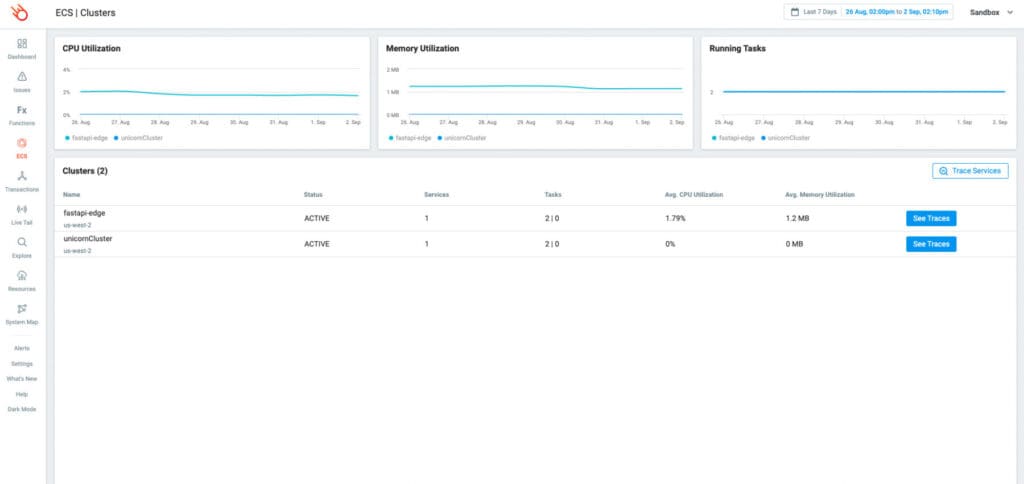
It’s really important to note here that those cluster metrics are only visible if you have CloudWatch container insights enabled on your cluster. Visit the AWS documentation to find out how to enable it.
Monitoring ECS
Clicking into a monitored ECS application will display an overview for a cluster that includes metrics such as CPU and Memory utilization alongside running task metrics. These metrics combined give a useful insight into where resources are being consumed and the timing associated with their usage.
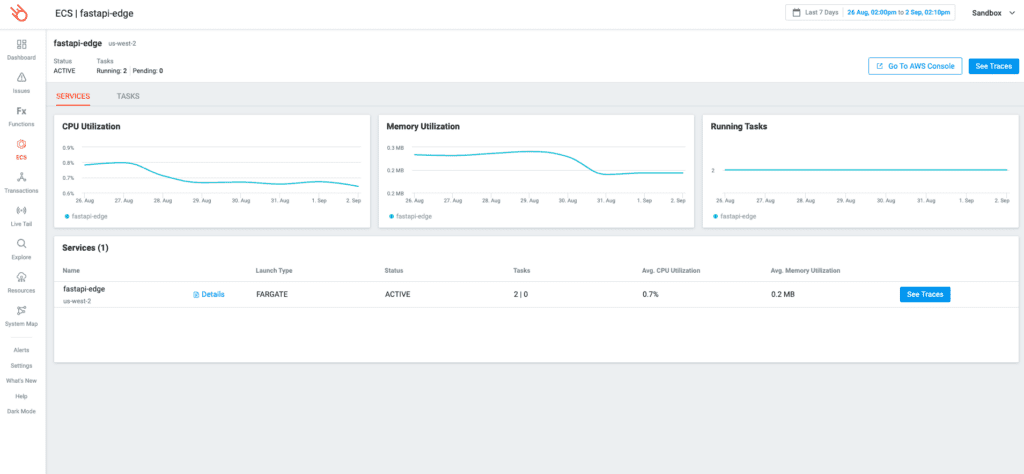
Delving down further, you can also see a list of services associated with the cluster along with the service status, region, and some associated metrics. Clicking into the Details section will bring up additional information around the service like configuration information, security group, subnets, and service event logs.
What I always find handy here is being able to click directly into the AWS Console directly from a point of interest like an ECS service detail page. This will launch you directly to the resource for configurational changes.
Clicking into the Tasks tab covers a further overview into the clusters defined tasks, showing easy-to-read insights into the container allocated CPU, Memory, and other associated task information.
Lumigo Tracer, Engage!
This is where things get REALLY interesting.
By adding the Lumigo tracers into our application you can gain even more insight into the inner workings of your ECS container applications.
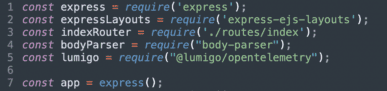
To get started all you need to do is add a library, a few lines of code, and some environmental variables. This will slightly vary depending on what your language and codebase look like, but first, let’s check out some libraries.
Lumigo has some open-source libraries for getting trace information from your application. It currently supports Python and NodeJS languages.
If you are using another language for your application, you can still connect your trace information, but you may need a few additional steps and should use one of the OpenTelemetry collector libraries.
[For more info, check out the Lumigo OpenTelemetry support documentation or reach out to our support team if you have any questions.]
Install the library with your nominated package manager and reference the library from within your application. Again, this may vary slightly depending on how your application is structured.
Finally, we need to set 2 environmental variables on the container as part of its deployment to ECS. These can be set within the code as part of the library, but it is highly recommended to set these as environment variables.
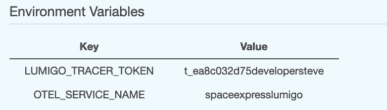
OTEL_SERVICE_NAME
This sets the application name on the service application traces and should reflect something specific to the application being traced within this container.
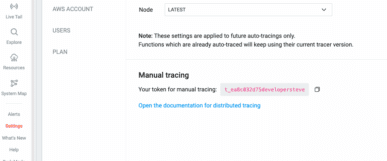
LUMIGO_TRACER_TOKEN
This helps identify your traces to your Lumigo instance. It can be found by visiting Settings and then Tracing from your Lumigo dashboard.
Now we will be able to see a lot more information from that ECS cluster application, right down to the application level and beyond. Clicking through from the services button on the cluster overview page will whisk you away to the Explore page with a resource filter set.
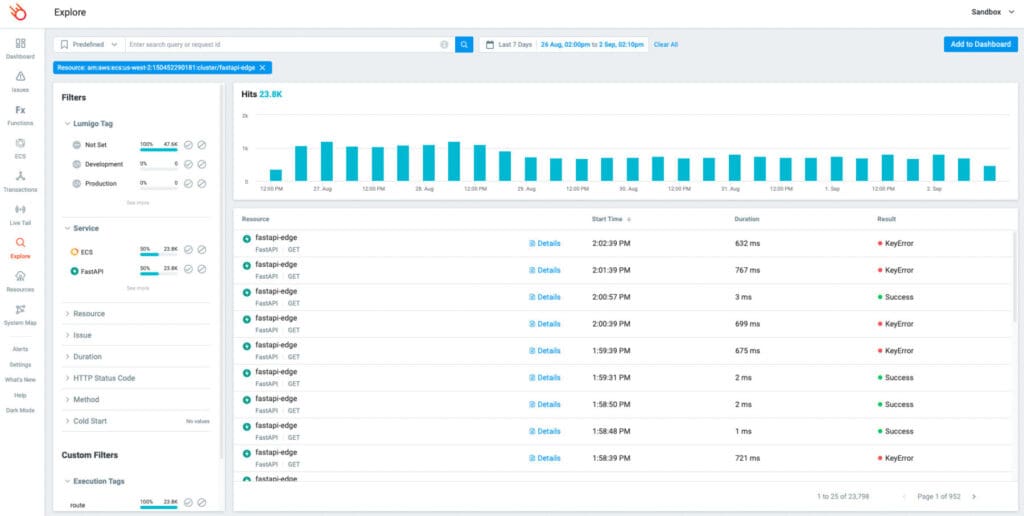
This will then let you see additional information from a trace and view the associated invocation in greater detail.
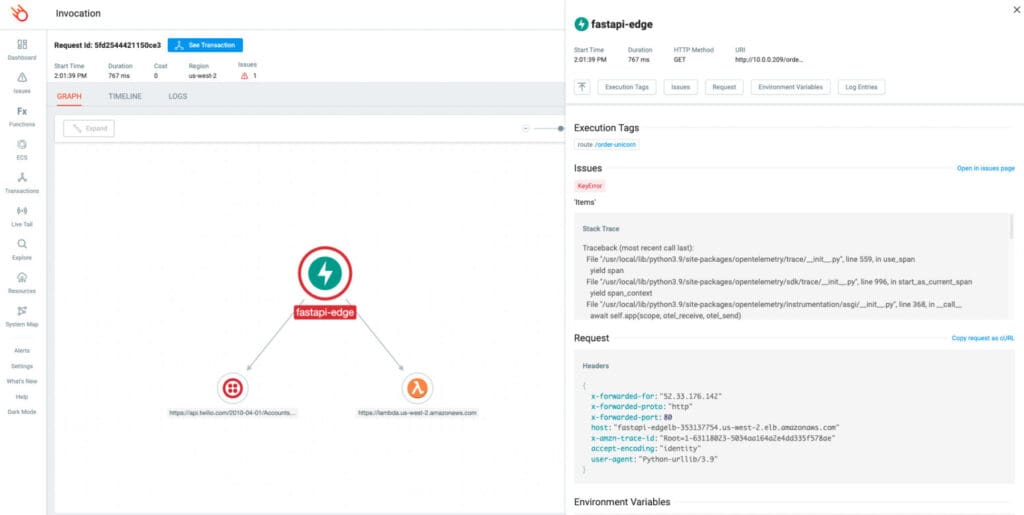
From the invocation view page you can see any associated connected services, which is really handy to being able to see the full end to end trace view from your ECS deployments.
Trace Your ECS Instances
Check out the Lumigo ECS documentation to find out more. Sign up for a free account and test it for yourself.