Apr 16 2024

Lumigo Launches Log Management, Reducing Issue Resolution Time While Slashing Costs Up to 60%
Lumigo has announced the addition of full log management capabilities into its microservices observability and troubleshooting platform, promising customers enormous savings while enabling automatic correlation between log data and distributed traces.
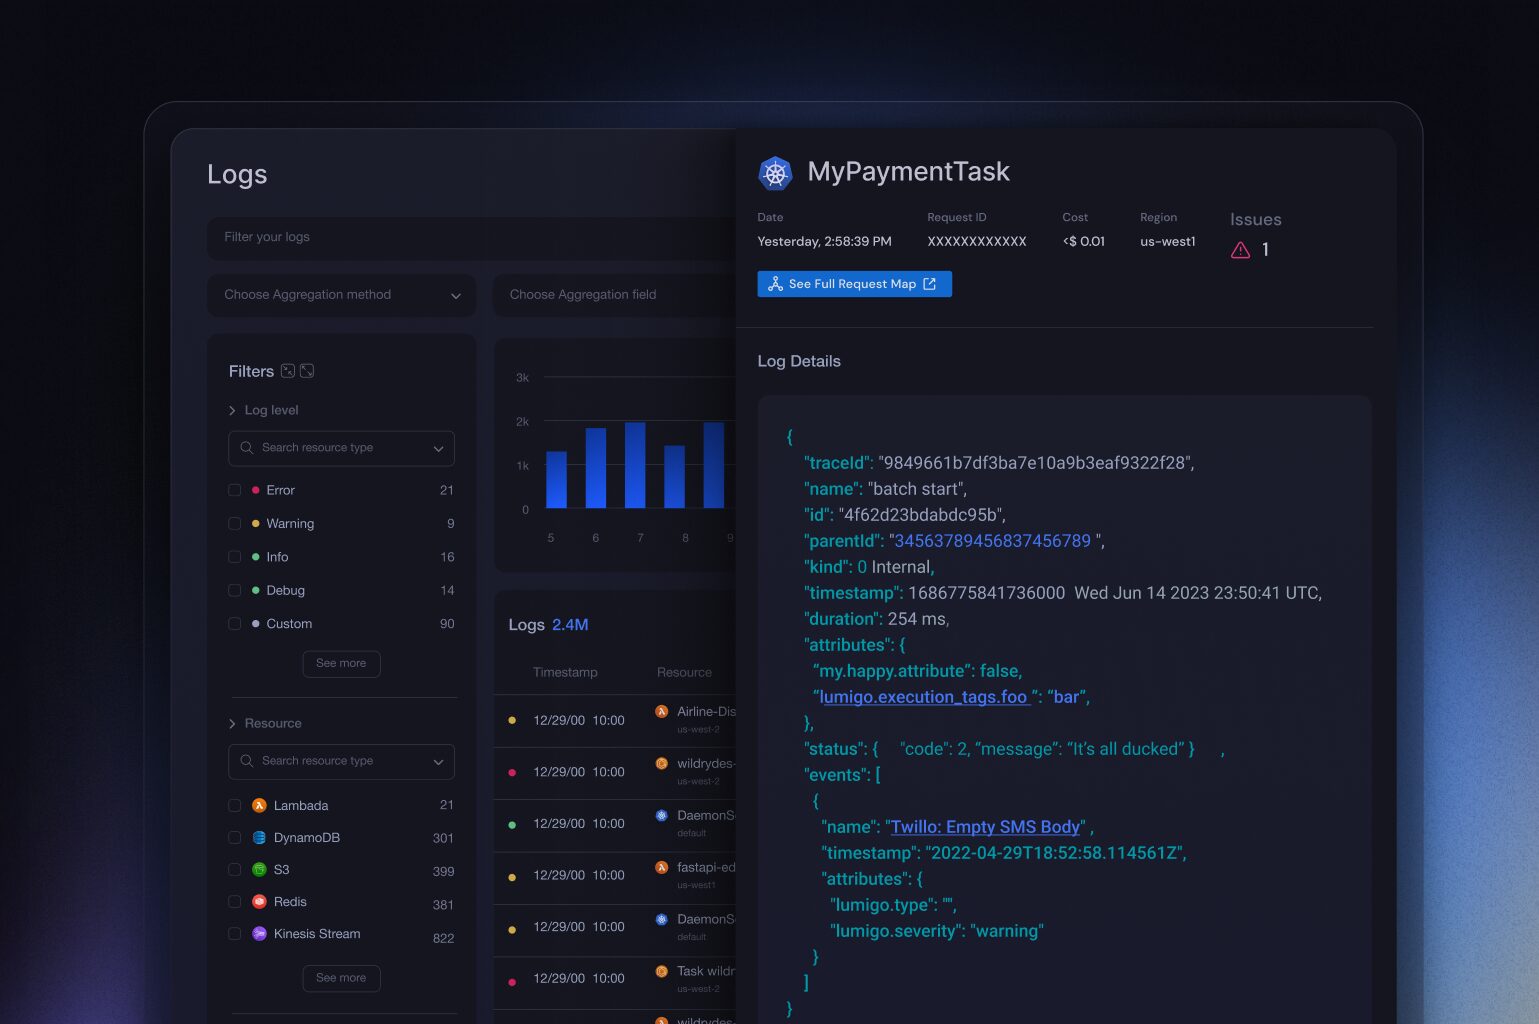
By unifying logs, metrics, and traces into a single interface, Lumigo empowers developers and DevOps teams with comprehensive context for analyzing and resolving issues swiftly. It reduces the time spent on root cause analysis by 80% while dramatically cutting costs. With Lumigo, troubleshooting becomes fast, efficient, and cost-effective, delivering unparalleled visibility across the entire stack. Users can seamlessly search and analyze logs and click directly into the corresponding traces, accelerating resolution times while enjoying significant cost savings.
“The cost of Log Aggregation tools has become prohibitive and unpredictable,” said Erez Berkner, CEO of Lumigo. “Lumigo is using state-of-the-art technology along with our unique custom data ingestion pipeline to provide log aggregation capabilities that are significantly more affordable than the competition. And by incorporating log management into our microservices troubleshooting solution, we’re providing developers with the crucial resources they need to manage the intricacies of contemporary distributed systems effortlessly.”
Control Your Observability Costs without Sacrificing Functionality
Current logging solutions, like Datadog, present a significant financial burden for organizations, especially those operating on tight budgets. Unpredictable expenses can be prohibitive, limiting your ability to leverage the sophisticated logging and monitoring capabilities desired. Furthermore, as organizations grow and expand their infrastructure, the cost of maintaining and scaling these logging solutions can escalate rapidly, potentially outpacing the budget allocated for IT operations. The high costs of these solutions often necessitate careful consideration to balance desired functionality and affordability.
Fortunately, there is now a better way to get all the observability data you need at an affordable cost without cutting corners.
Automated Trace and Log Correlation Improves Resolution Time
Unlock your developer efficiency with Lumigo’s cutting-edge Troubleshooting and Observability platform—now enhanced with comprehensive log management. Seamlessly search and analyze logs at half the cost of current solutions. For unparalleled performance, Lumigo’s correlation engine automatically correlates log data with distributed tracing turbocharging resolution times.
Cut costs, not logs
Gain control over your observability expenses without compromising visibility. Say goodbye to toggling logs on and off in production. Lumigo ensures comprehensive log coverage without breaking the bank, allowing you to maintain retention times according to your needs. With Lumigo, archive logs when you’re ready, not when costs become prohibitive. Leveraging state-of-the-art technology with a custom instrumented data ingestion pipeline, Lumigo ensures lightning-fast query speeds while passing on significant cost savings to you. Even during sudden spikes in log volume, Lumigo delivers reliable performance without daunting overages. The data found in traces and logs frequently overlaps, including request payload data. By consolidating logs and traces into one platform, Lumigo streamlines data aggregation, allowing you to eliminate duplicates and reduce the volume of required logs. This consolidation ultimately lowers overall costs.
Quickly get the answers you need with powerful SQL syntax
Simplify the search, filtering, aggregation, and visualization of logs using SQL for immediate access to pertinent troubleshooting information. With Lumigo, developers benefit from log-based alerts, ensuring critical issues are never overlooked. Analyze logs effortlessly with interactive dashboards and intelligent data visualizations while gaining deep insights that provide a quick understanding of any issue. Lumigo aggregates all logs into structured data accessible via SQL, consolidating logs from various sources into a single, searchable repository for real-time analysis.
Reduce troubleshooting time by over 80%
Lumigo automatically enriches traces with complete in-context request and response payloads and correlates them to the relevant logs and metrics. This enables developers to view logs in the context of the associated traces while seamlessly navigating from logs to traces and vice versa. Lumigo brings all your troubleshooting data into a single, correlated dashboard view. Pivot from logs to the corresponding APM traces with a single click for full context. Easily navigate from dashboards to associated logs for faster troubleshooting. Get alerted about irregularities and anomalies in your logs before they become incidents.
Schedule a Demo:
Schedule a demo to see how Lumigo’s observability platform can help you diagnose and fix issues quickly, troubleshoot faster than ever, and gain a deeper understanding of your microservice applications while also slashing the cost of log management.
About Lumigo:
Lumigo is an observability and troubleshooting platform for modern cloud applications that uses automated distributed tracing and log management to allow developers to quickly navigate to the root cause of issues with visual debugging, resolve performance bottlenecks with a clear breakdown of each component’s execution duration, and receive notifications on issues before they impact the business with smart alerts. Lumigo specializes in connecting the dots to present an end-to-end view across the full spectrum of modern cloud services, including Amazon DynamoDB, API Gateway, Step Functions, EKS, Lambda, Fargate, ECS, EventBridge, S3, Kinesys, Kubernetes, and many more. The platform is used by hundreds of leading companies, including Medtronic, Taco Bell, and Sonos. Lumigo has raised $37 million in funding to date.

